Cities with the Highest Percentage of Population Employed in Construction in Maryland
RELATED REPORTS & OPTIONS
Construction
Maryland
Compare Cities
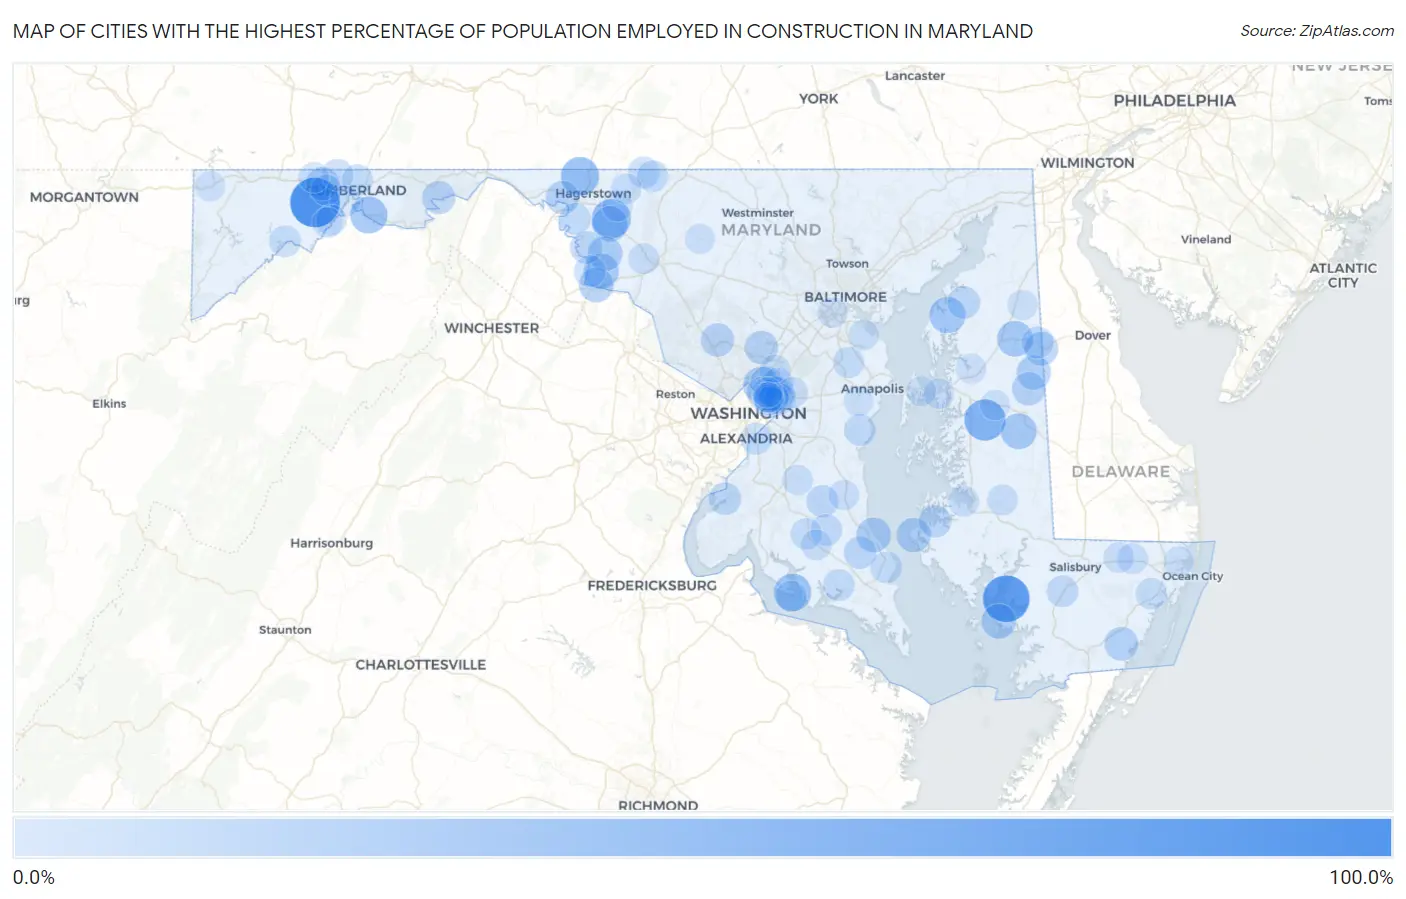
Map of Cities with the Highest Percentage of Population Employed in Construction in Maryland
0.0%
100.0%
Cities with the Highest Percentage of Population Employed in Construction in Maryland
| City | % Employed | vs State | vs National | |
| 1. | National | 100.0% | 7.4%(+92.6)#1 | 6.9%(+93.1)#30 |
| 2. | Nanticoke Acres | 86.5% | 7.4%(+79.1)#2 | 6.9%(+79.6)#50 |
| 3. | Lisbon | 68.6% | 7.4%(+61.2)#3 | 6.9%(+61.7)#93 |
| 4. | Cordova | 61.8% | 7.4%(+54.4)#4 | 6.9%(+54.9)#122 |
| 5. | San Mar | 52.6% | 7.4%(+45.3)#5 | 6.9%(+45.8)#192 |
| 6. | Cearfoss | 48.8% | 7.4%(+41.5)#6 | 6.9%(+42.0)#233 |
| 7. | Rock Point | 45.5% | 7.4%(+38.1)#7 | 6.9%(+38.6)#265 |
| 8. | Spring Gap | 42.9% | 7.4%(+35.5)#8 | 6.9%(+36.0)#306 |
| 9. | Fairlee | 39.9% | 7.4%(+32.5)#9 | 6.9%(+33.0)#364 |
| 10. | Langley Park | 39.6% | 7.4%(+32.2)#10 | 6.9%(+32.7)#370 |
| 11. | Barclay | 37.6% | 7.4%(+30.2)#11 | 6.9%(+30.7)#422 |
| 12. | Williston | 37.4% | 7.4%(+30.0)#12 | 6.9%(+30.5)#433 |
| 13. | Mapleville | 36.9% | 7.4%(+29.5)#13 | 6.9%(+30.0)#452 |
| 14. | Yarrowsburg | 34.8% | 7.4%(+27.4)#14 | 6.9%(+27.9)#519 |
| 15. | Rohrersville | 33.8% | 7.4%(+26.5)#15 | 6.9%(+27.0)#553 |
| 16. | Calvert Beach | 33.1% | 7.4%(+25.7)#16 | 6.9%(+26.2)#599 |
| 17. | Chance | 33.1% | 7.4%(+25.7)#17 | 6.9%(+26.2)#601 |
| 18. | Sandy Hook | 32.1% | 7.4%(+24.7)#18 | 6.9%(+25.2)#638 |
| 19. | Taylors Island | 31.2% | 7.4%(+23.9)#19 | 6.9%(+24.4)#679 |
| 20. | Goldsboro | 30.5% | 7.4%(+23.1)#20 | 6.9%(+23.6)#715 |
| 21. | Marydel | 29.2% | 7.4%(+21.8)#21 | 6.9%(+22.3)#793 |
| 22. | East Riverdale | 28.8% | 7.4%(+21.4)#22 | 6.9%(+21.9)#814 |
| 23. | Girdletree | 28.4% | 7.4%(+21.0)#23 | 6.9%(+21.5)#854 |
| 24. | Greensboro | 28.0% | 7.4%(+20.6)#24 | 6.9%(+21.1)#882 |
| 25. | Pinesburg | 27.5% | 7.4%(+20.1)#25 | 6.9%(+20.6)#923 |
| 26. | Lewistown | 27.2% | 7.4%(+19.8)#26 | 6.9%(+20.3)#952 |
| 27. | Spencerville | 27.2% | 7.4%(+19.8)#27 | 6.9%(+20.3)#954 |
| 28. | Washington Grove | 27.0% | 7.4%(+19.6)#28 | 6.9%(+20.1)#975 |
| 29. | Zihlman | 26.8% | 7.4%(+19.5)#29 | 6.9%(+20.0)#986 |
| 30. | Little Orleans | 26.7% | 7.4%(+19.3)#30 | 6.9%(+19.8)#1,000 |
| 31. | Romancoke | 23.8% | 7.4%(+16.4)#31 | 6.9%(+16.9)#1,272 |
| 32. | Worton | 23.7% | 7.4%(+16.3)#32 | 6.9%(+16.8)#1,282 |
| 33. | Madison | 23.7% | 7.4%(+16.3)#33 | 6.9%(+16.8)#1,287 |
| 34. | Broomes Island | 23.7% | 7.4%(+16.3)#34 | 6.9%(+16.8)#1,291 |
| 35. | Edmonston | 22.8% | 7.4%(+15.4)#35 | 6.9%(+15.9)#1,413 |
| 36. | Potomac Heights | 22.8% | 7.4%(+15.4)#36 | 6.9%(+15.9)#1,415 |
| 37. | Sharpsburg | 22.2% | 7.4%(+14.8)#37 | 6.9%(+15.3)#1,503 |
| 38. | Aquasco | 21.1% | 7.4%(+13.8)#38 | 6.9%(+14.3)#1,679 |
| 39. | Templeville | 20.8% | 7.4%(+13.5)#39 | 6.9%(+14.0)#1,733 |
| 40. | Dargan | 20.8% | 7.4%(+13.4)#40 | 6.9%(+13.9)#1,750 |
| 41. | Adelphi | 20.6% | 7.4%(+13.2)#41 | 6.9%(+13.7)#1,775 |
| 42. | Berwyn Heights | 20.2% | 7.4%(+12.9)#42 | 6.9%(+13.4)#1,848 |
| 43. | Golden Beach | 20.1% | 7.4%(+12.7)#43 | 6.9%(+13.2)#1,866 |
| 44. | Barrelville | 20.0% | 7.4%(+12.6)#44 | 6.9%(+13.1)#1,900 |
| 45. | Galesville | 20.0% | 7.4%(+12.6)#45 | 6.9%(+13.1)#1,917 |
| 46. | Riverdale Park | 19.9% | 7.4%(+12.5)#46 | 6.9%(+13.0)#1,922 |
| 47. | Eden | 19.7% | 7.4%(+12.3)#47 | 6.9%(+12.8)#1,967 |
| 48. | Forest Heights | 19.6% | 7.4%(+12.2)#48 | 6.9%(+12.7)#1,996 |
| 49. | Leonardtown | 19.6% | 7.4%(+12.2)#49 | 6.9%(+12.7)#2,000 |
| 50. | Chillum | 19.5% | 7.4%(+12.1)#50 | 6.9%(+12.6)#2,020 |
| 51. | Landover Hills | 19.4% | 7.4%(+12.0)#51 | 6.9%(+12.5)#2,042 |
| 52. | Bloomington | 19.4% | 7.4%(+12.0)#52 | 6.9%(+12.5)#2,054 |
| 53. | Highfield Cascade | 19.3% | 7.4%(+12.0)#53 | 6.9%(+12.5)#2,060 |
| 54. | Lusby | 19.2% | 7.4%(+11.8)#54 | 6.9%(+12.3)#2,089 |
| 55. | Downsville | 18.9% | 7.4%(+11.6)#55 | 6.9%(+12.1)#2,154 |
| 56. | Sabillasville | 18.9% | 7.4%(+11.5)#56 | 6.9%(+12.0)#2,157 |
| 57. | Woodlawn Cdp Prince George S County | 18.3% | 7.4%(+10.9)#57 | 6.9%(+11.4)#2,331 |
| 58. | Still Pond | 18.2% | 7.4%(+10.8)#58 | 6.9%(+11.3)#2,372 |
| 59. | Colmar Manor | 18.2% | 7.4%(+10.8)#59 | 6.9%(+11.3)#2,397 |
| 60. | Arden On The Severn | 18.0% | 7.4%(+10.6)#60 | 6.9%(+11.1)#2,437 |
| 61. | Cobb Island | 17.8% | 7.4%(+10.4)#61 | 6.9%(+10.9)#2,501 |
| 62. | Charlotte Hall | 17.7% | 7.4%(+10.3)#62 | 6.9%(+10.8)#2,519 |
| 63. | Newark | 17.6% | 7.4%(+10.2)#63 | 6.9%(+10.7)#2,555 |
| 64. | Bowmans Addition | 16.8% | 7.4%(+9.46)#64 | 6.9%(+9.97)#2,793 |
| 65. | Eckhart Mines | 16.8% | 7.4%(+9.46)#65 | 6.9%(+9.96)#2,800 |
| 66. | Maryland Park | 16.7% | 7.4%(+9.29)#66 | 6.9%(+9.79)#2,862 |
| 67. | Potomac Park | 16.6% | 7.4%(+9.25)#67 | 6.9%(+9.75)#2,919 |
| 68. | Beltsville | 16.6% | 7.4%(+9.23)#68 | 6.9%(+9.73)#2,922 |
| 69. | Willards | 16.3% | 7.4%(+8.94)#69 | 6.9%(+9.44)#3,018 |
| 70. | Lanham | 16.0% | 7.4%(+8.66)#70 | 6.9%(+9.16)#3,121 |
| 71. | Algonquin | 16.0% | 7.4%(+8.61)#71 | 6.9%(+9.12)#3,141 |
| 72. | Braddock Heights | 15.9% | 7.4%(+8.57)#72 | 6.9%(+9.07)#3,156 |
| 73. | East New Market | 15.9% | 7.4%(+8.56)#73 | 6.9%(+9.06)#3,159 |
| 74. | Bier | 15.4% | 7.4%(+8.01)#74 | 6.9%(+8.51)#3,388 |
| 75. | Cottage City | 15.3% | 7.4%(+7.97)#75 | 6.9%(+8.47)#3,424 |
| 76. | Mechanicsville | 15.3% | 7.4%(+7.95)#76 | 6.9%(+8.45)#3,430 |
| 77. | Pittsville | 15.2% | 7.4%(+7.86)#77 | 6.9%(+8.36)#3,474 |
| 78. | Cedarville | 15.0% | 7.4%(+7.60)#78 | 6.9%(+8.10)#3,617 |
| 79. | Callaway | 14.9% | 7.4%(+7.57)#79 | 6.9%(+8.07)#3,629 |
| 80. | Huntingtown | 14.9% | 7.4%(+7.56)#80 | 6.9%(+8.06)#3,640 |
| 81. | Rawlings | 14.9% | 7.4%(+7.53)#81 | 6.9%(+8.03)#3,663 |
| 82. | Bladensburg | 14.8% | 7.4%(+7.38)#82 | 6.9%(+7.88)#3,757 |
| 83. | Grasonville | 14.6% | 7.4%(+7.20)#83 | 6.9%(+7.70)#3,860 |
| 84. | Finzel | 14.5% | 7.4%(+7.11)#84 | 6.9%(+7.61)#3,928 |
| 85. | Mount Aetna | 14.4% | 7.4%(+7.05)#85 | 6.9%(+7.55)#3,955 |
| 86. | Brentwood | 14.2% | 7.4%(+6.84)#86 | 6.9%(+7.34)#4,091 |
| 87. | Riviera Beach | 14.0% | 7.4%(+6.62)#87 | 6.9%(+7.12)#4,216 |
| 88. | North Brentwood | 14.0% | 7.4%(+6.59)#88 | 6.9%(+7.09)#4,234 |
| 89. | Lansdowne | 13.9% | 7.4%(+6.56)#89 | 6.9%(+7.06)#4,259 |
| 90. | Smithsburg | 13.9% | 7.4%(+6.53)#90 | 6.9%(+7.03)#4,270 |
| 91. | Burnt Mills | 13.9% | 7.4%(+6.52)#91 | 6.9%(+7.02)#4,278 |
| 92. | Friendsville | 13.8% | 7.4%(+6.47)#92 | 6.9%(+6.97)#4,308 |
| 93. | Millington | 13.8% | 7.4%(+6.42)#93 | 6.9%(+6.92)#4,340 |
| 94. | Queen Anne | 13.7% | 7.4%(+6.35)#94 | 6.9%(+6.85)#4,389 |
| 95. | Ocean Pines | 13.7% | 7.4%(+6.35)#95 | 6.9%(+6.85)#4,397 |
| 96. | Hyattsville | 13.6% | 7.4%(+6.19)#96 | 6.9%(+6.69)#4,506 |
| 97. | Edgewater | 13.4% | 7.4%(+6.02)#97 | 6.9%(+6.52)#4,638 |
| 98. | Centreville | 13.3% | 7.4%(+5.96)#98 | 6.9%(+6.46)#4,672 |
| 99. | Libertytown | 13.3% | 7.4%(+5.93)#99 | 6.9%(+6.44)#4,704 |
| 100. | Chester | 13.1% | 7.4%(+5.75)#100 | 6.9%(+6.25)#4,827 |
Common Questions
What are the Top 10 Cities with the Highest Percentage of Population Employed in Construction in Maryland?
Top 10 Cities with the Highest Percentage of Population Employed in Construction in Maryland are:
#1
100.0%
#2
86.5%
#3
61.8%
#4
52.6%
#5
48.8%
#6
45.5%
#7
42.9%
#8
39.9%
#9
39.6%
#10
37.6%
What city has the Highest Percentage of Population Employed in Construction in Maryland?
National has the Highest Percentage of Population Employed in Construction in Maryland with 100.0%.
What is the Percentage of Population Employed in Construction in the State of Maryland?
Percentage of Population Employed in Construction in Maryland is 7.4%.
What is the Percentage of Population Employed in Construction in the United States?
Percentage of Population Employed in Construction in the United States is 6.9%.