Mechanicsville, MD Map & Demographics
Mechanicsville Map
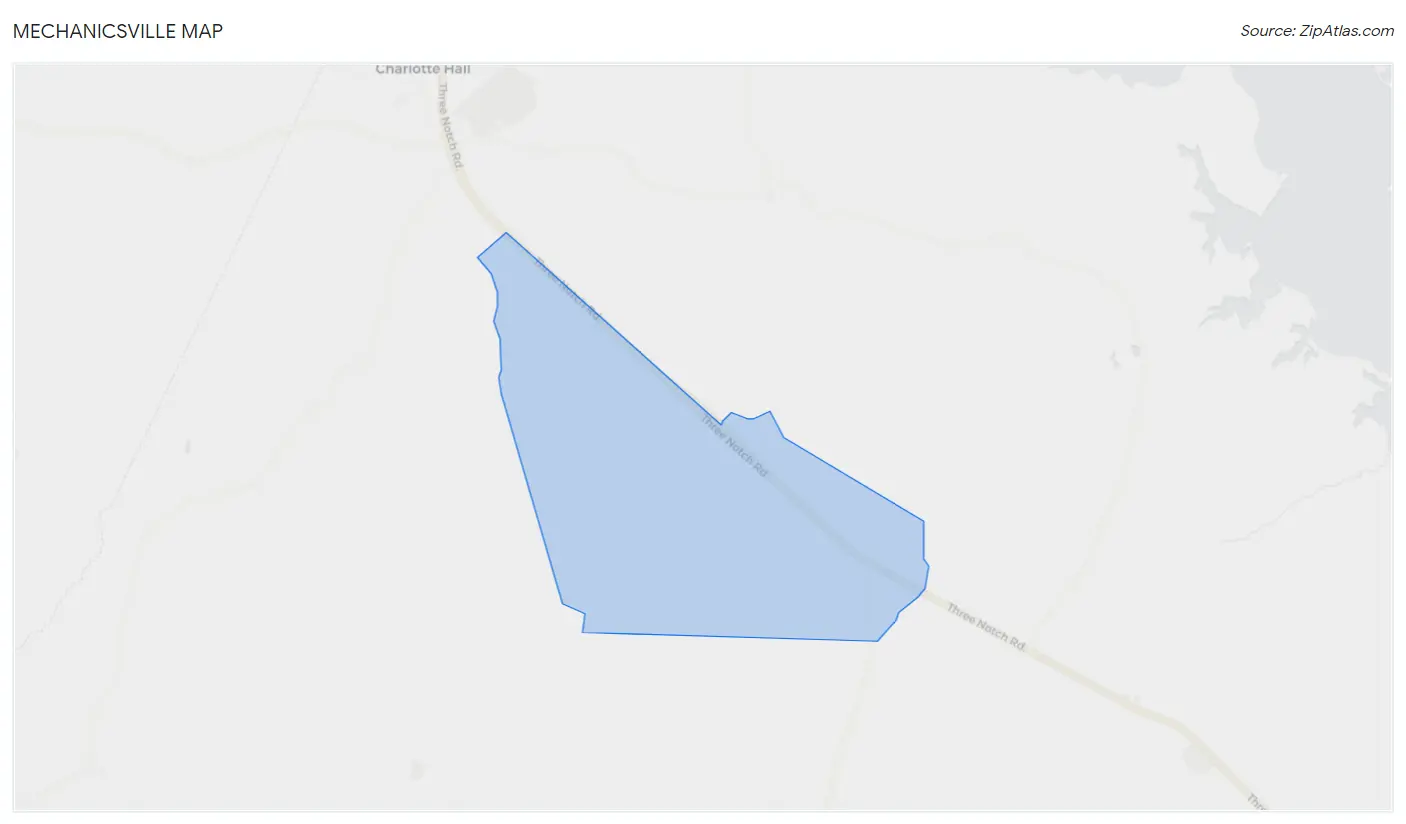
Mechanicsville Overview
$56,387
PER CAPITA INCOME
$129,000
AVG FAMILY INCOME
$114,318
AVG HOUSEHOLD INCOME
50.5%
WAGE / INCOME GAP [ % ]
49.5¢/ $1
WAGE / INCOME GAP [ $ ]
0.42
INEQUALITY / GINI INDEX
1,783
TOTAL POPULATION
878
MALE POPULATION
905
FEMALE POPULATION
97.02
MALES / 100 FEMALES
103.08
FEMALES / 100 MALES
41.4
MEDIAN AGE
3.2
AVG FAMILY SIZE
2.9
AVG HOUSEHOLD SIZE
1,050
LABOR FORCE [ PEOPLE ]
80.3%
PERCENT IN LABOR FORCE
3.9%
UNEMPLOYMENT RATE
Mechanicsville Zip Codes
Income in Mechanicsville
Income Overview in Mechanicsville
Per Capita Income in Mechanicsville is $56,387, while median incomes of families and households are $129,000 and $114,318 respectively.
| Characteristic | Number | Measure |
| Per Capita Income | 1,783 | $56,387 |
| Median Family Income | 482 | $129,000 |
| Mean Family Income | 482 | $156,138 |
| Median Household Income | 614 | $114,318 |
| Mean Household Income | 614 | $162,992 |
| Income Deficit | 482 | $0 |
| Wage / Income Gap (%) | 1,783 | 50.45% |
| Wage / Income Gap ($) | 1,783 | 49.55¢ per $1 |
| Gini / Inequality Index | 1,783 | 0.42 |
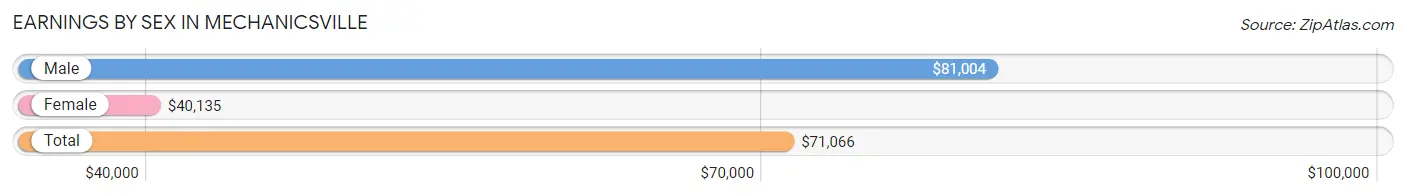
Earnings by Sex in Mechanicsville
Average Earnings in Mechanicsville are $71,066, $81,004 for men and $40,135 for women, a difference of 50.4%.
| Sex | Number | Average Earnings |
| Male | 515 (50.0%) | $81,004 |
| Female | 514 (49.9%) | $40,135 |
| Total | 1,029 (100.0%) | $71,066 |
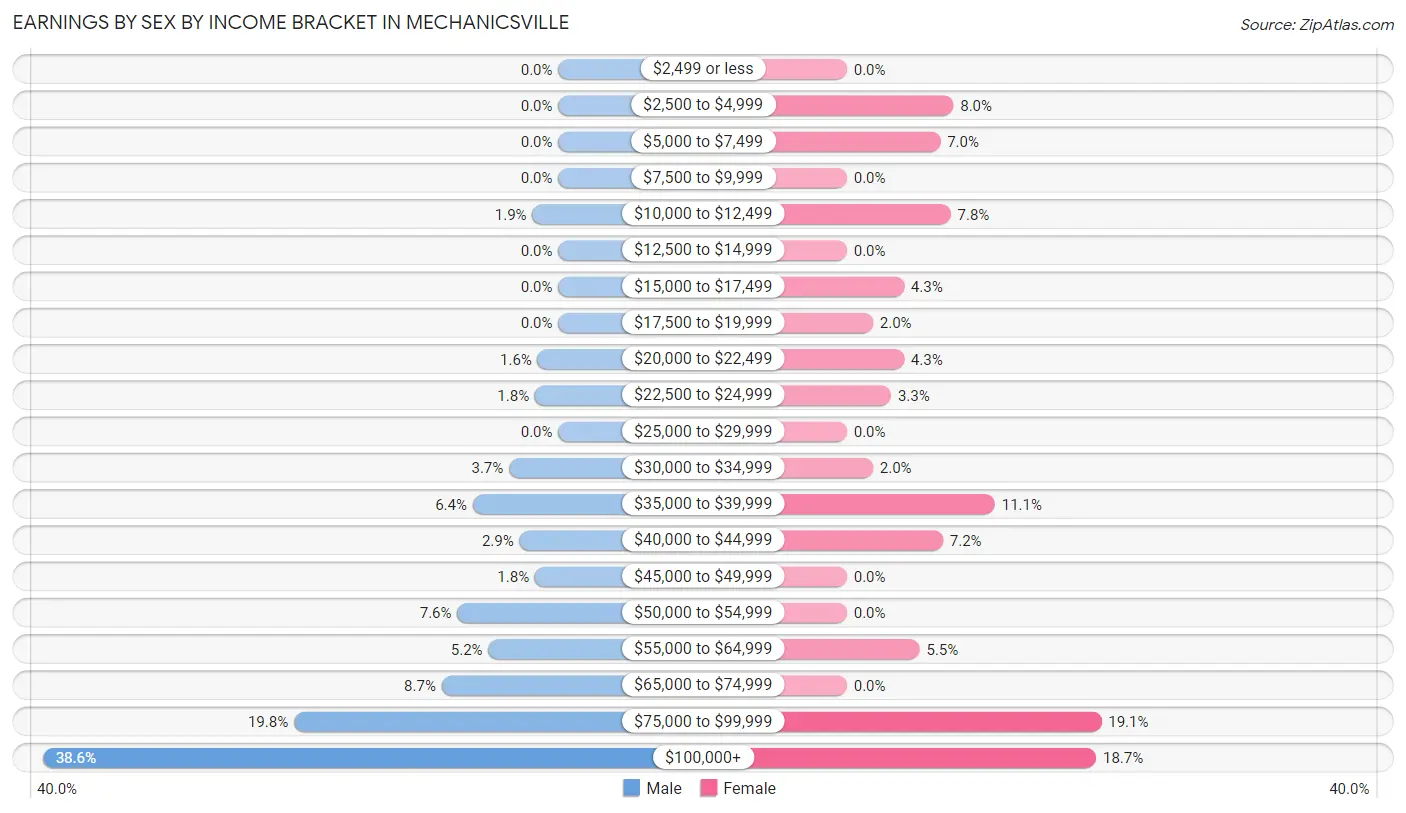
Earnings by Sex by Income Bracket in Mechanicsville
The most common earnings brackets in Mechanicsville are $100,000+ for men (199 | 38.6%) and $75,000 to $99,999 for women (98 | 19.1%).
| Income | Male | Female |
| $2,499 or less | 0 (0.0%) | 0 (0.0%) |
| $2,500 to $4,999 | 0 (0.0%) | 41 (8.0%) |
| $5,000 to $7,499 | 0 (0.0%) | 36 (7.0%) |
| $7,500 to $9,999 | 0 (0.0%) | 0 (0.0%) |
| $10,000 to $12,499 | 10 (1.9%) | 40 (7.8%) |
| $12,500 to $14,999 | 0 (0.0%) | 0 (0.0%) |
| $15,000 to $17,499 | 0 (0.0%) | 22 (4.3%) |
| $17,500 to $19,999 | 0 (0.0%) | 10 (1.9%) |
| $20,000 to $22,499 | 8 (1.5%) | 22 (4.3%) |
| $22,500 to $24,999 | 9 (1.8%) | 17 (3.3%) |
| $25,000 to $29,999 | 0 (0.0%) | 0 (0.0%) |
| $30,000 to $34,999 | 19 (3.7%) | 10 (1.9%) |
| $35,000 to $39,999 | 33 (6.4%) | 57 (11.1%) |
| $40,000 to $44,999 | 15 (2.9%) | 37 (7.2%) |
| $45,000 to $49,999 | 9 (1.8%) | 0 (0.0%) |
| $50,000 to $54,999 | 39 (7.6%) | 0 (0.0%) |
| $55,000 to $64,999 | 27 (5.2%) | 28 (5.4%) |
| $65,000 to $74,999 | 45 (8.7%) | 0 (0.0%) |
| $75,000 to $99,999 | 102 (19.8%) | 98 (19.1%) |
| $100,000+ | 199 (38.6%) | 96 (18.7%) |
| Total | 515 (100.0%) | 514 (100.0%) |
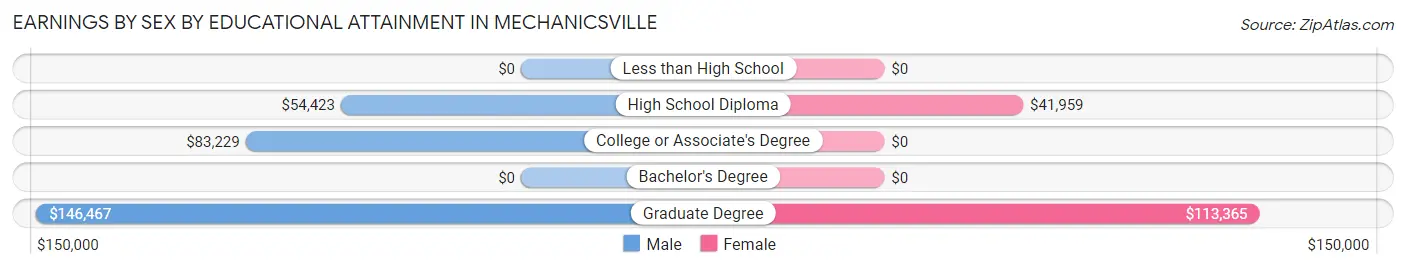
Earnings by Sex by Educational Attainment in Mechanicsville
Average earnings in Mechanicsville are $82,481 for men and $61,250 for women, a difference of 25.7%. Men with an educational attainment of graduate degree enjoy the highest average annual earnings of $146,467, while those with high school diploma education earn the least with $54,423. Women with an educational attainment of graduate degree earn the most with the average annual earnings of $113,365, while those with high school diploma education have the smallest earnings of $41,959.
| Educational Attainment | Male Income | Female Income |
| Less than High School | - | - |
| High School Diploma | $54,423 | $41,959 |
| College or Associate's Degree | $83,229 | $0 |
| Bachelor's Degree | - | - |
| Graduate Degree | $146,467 | $113,365 |
| Total | $82,481 | $61,250 |
Family Income in Mechanicsville
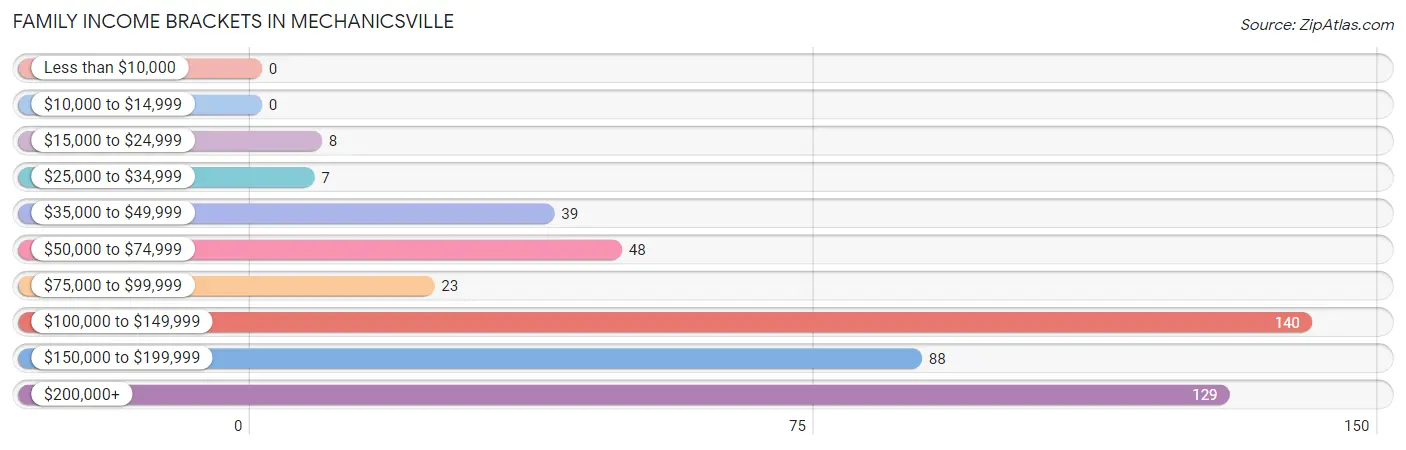
Family Income Brackets in Mechanicsville
According to the Mechanicsville family income data, there are 140 families falling into the $100,000 to $149,999 income range, which is the most common income bracket and makes up 29.0% of all families.
| Income Bracket | # Families | % Families |
| Less than $10,000 | 0 | 0.0% |
| $10,000 to $14,999 | 0 | 0.0% |
| $15,000 to $24,999 | 8 | 1.7% |
| $25,000 to $34,999 | 7 | 1.5% |
| $35,000 to $49,999 | 39 | 8.1% |
| $50,000 to $74,999 | 48 | 10.0% |
| $75,000 to $99,999 | 23 | 4.8% |
| $100,000 to $149,999 | 140 | 29.0% |
| $150,000 to $199,999 | 88 | 18.3% |
| $200,000+ | 129 | 26.8% |
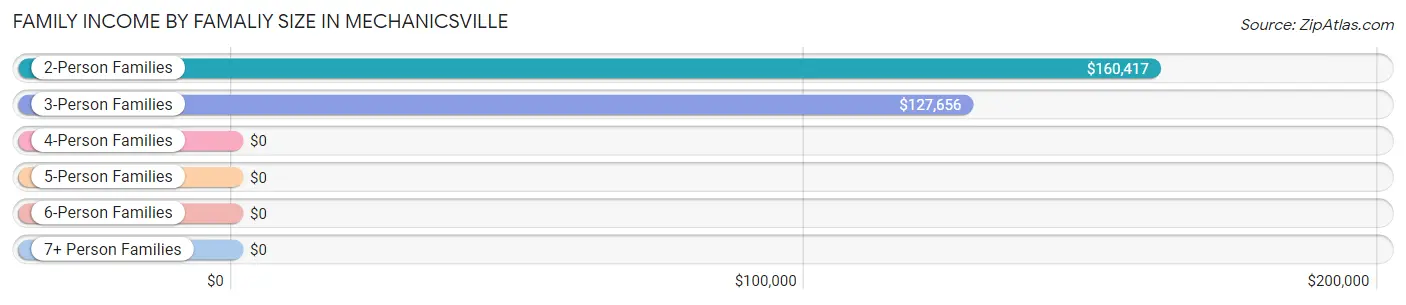
Family Income by Famaliy Size in Mechanicsville
2-person families (154 | 32.0%) account for the highest median family income in Mechanicsville with $160,417 per family, while 2-person families (154 | 32.0%) have the highest median income of $80,208 per family member.
| Income Bracket | # Families | Median Income |
| 2-Person Families | 154 (32.0%) | $160,417 |
| 3-Person Families | 147 (30.5%) | $127,656 |
| 4-Person Families | 148 (30.7%) | $0 |
| 5-Person Families | 19 (3.9%) | $0 |
| 6-Person Families | 7 (1.5%) | $0 |
| 7+ Person Families | 7 (1.5%) | $0 |
| Total | 482 (100.0%) | $129,000 |
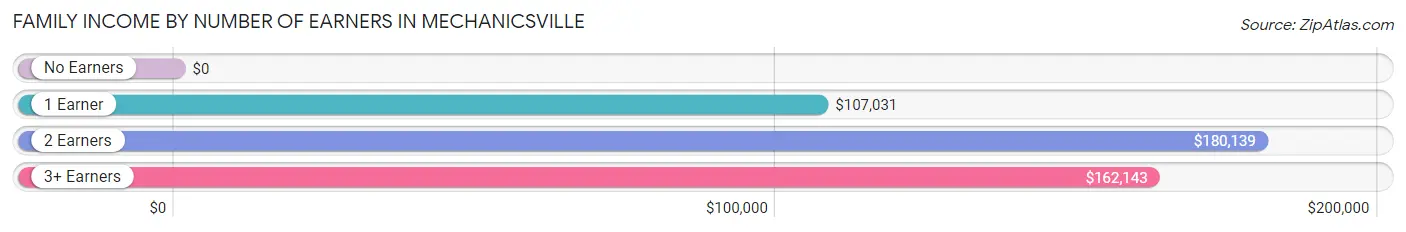
Family Income by Number of Earners in Mechanicsville
| Number of Earners | # Families | Median Income |
| No Earners | 7 (1.5%) | $0 |
| 1 Earner | 181 (37.6%) | $107,031 |
| 2 Earners | 214 (44.4%) | $180,139 |
| 3+ Earners | 80 (16.6%) | $162,143 |
| Total | 482 (100.0%) | $129,000 |
Household Income in Mechanicsville
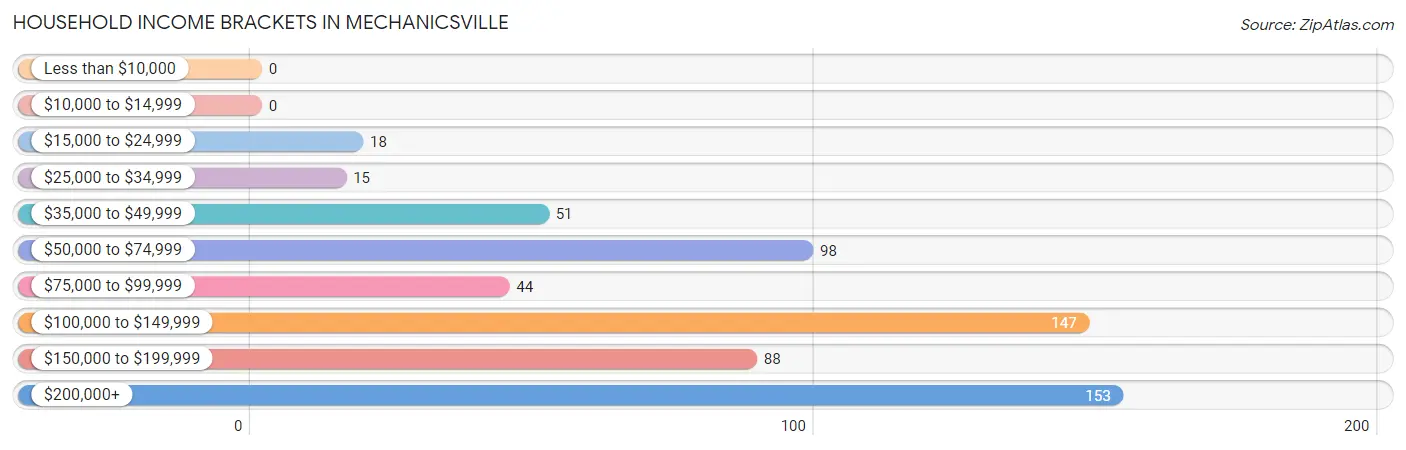
Household Income Brackets in Mechanicsville
With 153 households falling in the category, the $200,000+ income range is the most frequent in Mechanicsville, accounting for 24.9% of all households.
| Income Bracket | # Households | % Households |
| Less than $10,000 | 0 | 0.0% |
| $10,000 to $14,999 | 0 | 0.0% |
| $15,000 to $24,999 | 18 | 2.9% |
| $25,000 to $34,999 | 15 | 2.4% |
| $35,000 to $49,999 | 51 | 8.3% |
| $50,000 to $74,999 | 98 | 16.0% |
| $75,000 to $99,999 | 44 | 7.2% |
| $100,000 to $149,999 | 147 | 23.9% |
| $150,000 to $199,999 | 88 | 14.3% |
| $200,000+ | 153 | 24.9% |
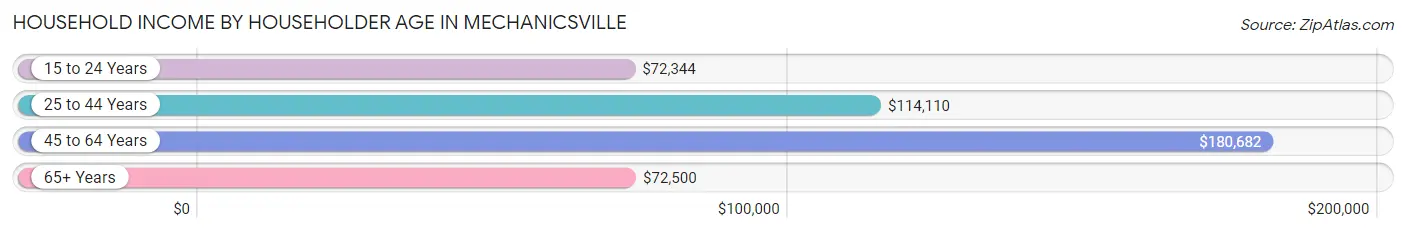
Household Income by Householder Age in Mechanicsville
The median household income in Mechanicsville is $114,318, with the highest median household income of $180,682 found in the 45 to 64 years age bracket for the primary householder. A total of 288 households (46.9%) fall into this category. Meanwhile, the 15 to 24 years age bracket for the primary householder has the lowest median household income of $72,344, with 33 households (5.4%) in this group.
| Income Bracket | # Households | Median Income |
| 15 to 24 Years | 33 (5.4%) | $72,344 |
| 25 to 44 Years | 179 (29.1%) | $114,110 |
| 45 to 64 Years | 288 (46.9%) | $180,682 |
| 65+ Years | 114 (18.6%) | $72,500 |
| Total | 614 (100.0%) | $114,318 |
Poverty in Mechanicsville
Income Below Poverty by Sex and Age in Mechanicsville
With 1.1% poverty level for males and 3.2% for females among the residents of Mechanicsville, 55 to 64 year old males and 65 to 74 year old females are the most vulnerable to poverty, with 10 males (8.8%) and 9 females (11.5%) in their respective age groups living below the poverty level.
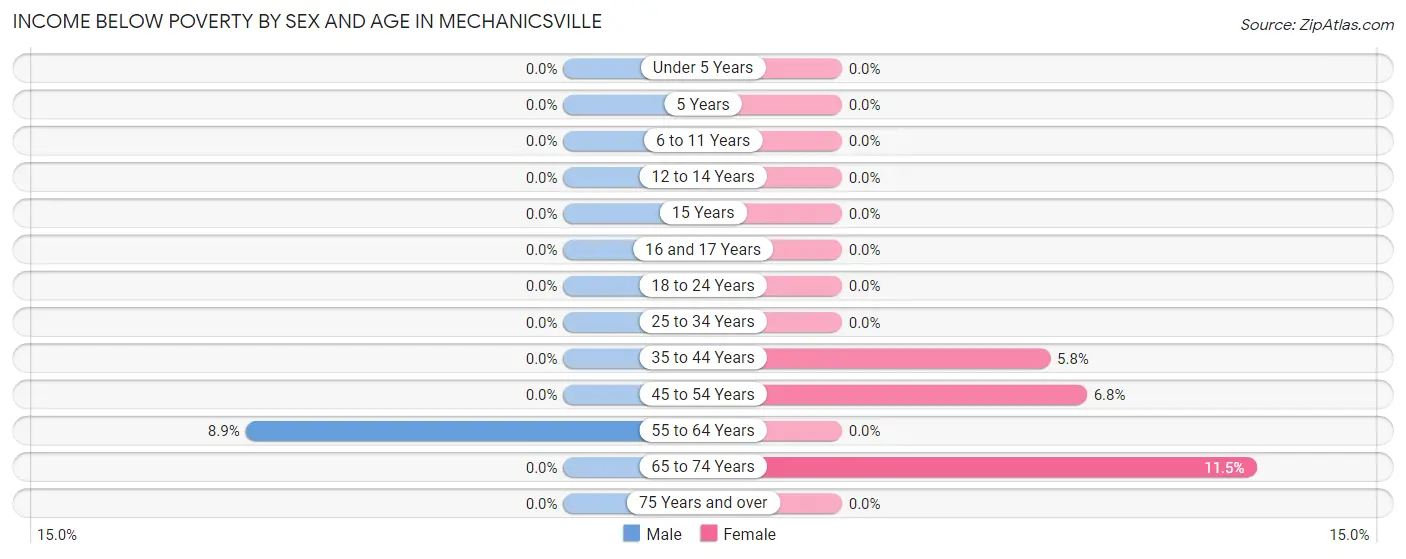
| Age Bracket | Male | Female |
| Under 5 Years | 0 (0.0%) | 0 (0.0%) |
| 5 Years | 0 (0.0%) | 0 (0.0%) |
| 6 to 11 Years | 0 (0.0%) | 0 (0.0%) |
| 12 to 14 Years | 0 (0.0%) | 0 (0.0%) |
| 15 Years | 0 (0.0%) | 0 (0.0%) |
| 16 and 17 Years | 0 (0.0%) | 0 (0.0%) |
| 18 to 24 Years | 0 (0.0%) | 0 (0.0%) |
| 25 to 34 Years | 0 (0.0%) | 0 (0.0%) |
| 35 to 44 Years | 0 (0.0%) | 8 (5.8%) |
| 45 to 54 Years | 0 (0.0%) | 12 (6.8%) |
| 55 to 64 Years | 10 (8.8%) | 0 (0.0%) |
| 65 to 74 Years | 0 (0.0%) | 9 (11.5%) |
| 75 Years and over | 0 (0.0%) | 0 (0.0%) |
| Total | 10 (1.1%) | 29 (3.2%) |
Income Above Poverty by Sex and Age in Mechanicsville
According to the poverty statistics in Mechanicsville, males aged under 5 years and females aged under 5 years are the age groups that are most secure financially, with 100.0% of males and 100.0% of females in these age groups living above the poverty line.
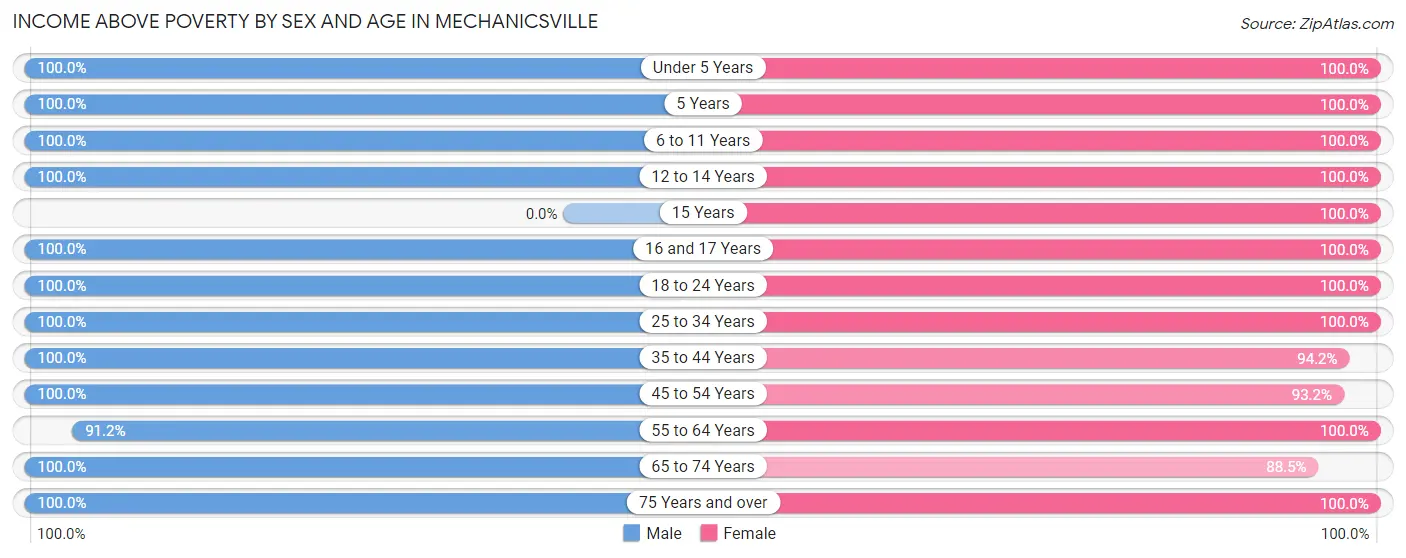
| Age Bracket | Male | Female |
| Under 5 Years | 15 (100.0%) | 27 (100.0%) |
| 5 Years | 9 (100.0%) | 7 (100.0%) |
| 6 to 11 Years | 164 (100.0%) | 83 (100.0%) |
| 12 to 14 Years | 79 (100.0%) | 85 (100.0%) |
| 15 Years | 0 (0.0%) | 7 (100.0%) |
| 16 and 17 Years | 14 (100.0%) | 7 (100.0%) |
| 18 to 24 Years | 78 (100.0%) | 91 (100.0%) |
| 25 to 34 Years | 28 (100.0%) | 61 (100.0%) |
| 35 to 44 Years | 108 (100.0%) | 130 (94.2%) |
| 45 to 54 Years | 175 (100.0%) | 164 (93.2%) |
| 55 to 64 Years | 103 (91.1%) | 129 (100.0%) |
| 65 to 74 Years | 87 (100.0%) | 69 (88.5%) |
| 75 Years and over | 8 (100.0%) | 16 (100.0%) |
| Total | 868 (98.9%) | 876 (96.8%) |
Income Below Poverty Among Married-Couple Families in Mechanicsville
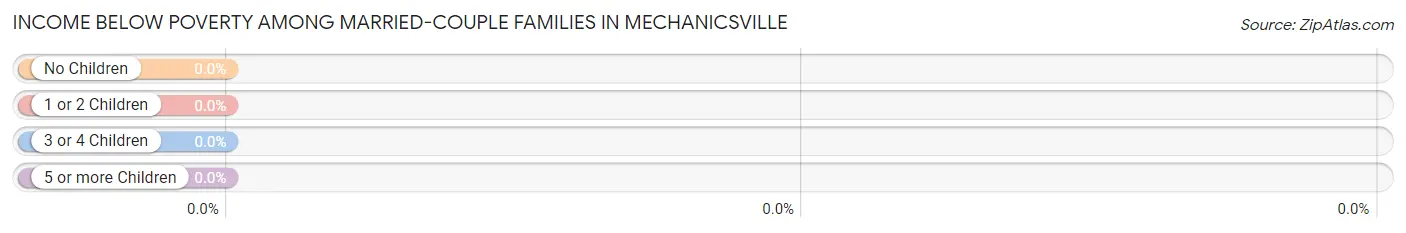
| Children | Above Poverty | Below Poverty |
| No Children | 162 (100.0%) | 0 (0.0%) |
| 1 or 2 Children | 226 (100.0%) | 0 (0.0%) |
| 3 or 4 Children | 33 (100.0%) | 0 (0.0%) |
| 5 or more Children | 0 (0.0%) | 0 (0.0%) |
| Total | 421 (100.0%) | 0 (0.0%) |
Income Below Poverty Among Single-Parent Households in Mechanicsville
| Children | Single Father | Single Mother |
| No Children | 0 (0.0%) | 0 (0.0%) |
| 1 or 2 Children | 0 (0.0%) | 0 (0.0%) |
| 3 or 4 Children | 0 (0.0%) | 0 (0.0%) |
| 5 or more Children | 0 (0.0%) | 0 (0.0%) |
| Total | 0 (0.0%) | 0 (0.0%) |
Income Below Poverty Among Married-Couple vs Single-Parent Households in Mechanicsville
| Children | Married-Couple Families | Single-Parent Households |
| No Children | 0 (0.0%) | 0 (0.0%) |
| 1 or 2 Children | 0 (0.0%) | 0 (0.0%) |
| 3 or 4 Children | 0 (0.0%) | 0 (0.0%) |
| 5 or more Children | 0 (0.0%) | 0 (0.0%) |
| Total | 0 (0.0%) | 0 (0.0%) |
Race in Mechanicsville
The most populous races in Mechanicsville are White / Caucasian (1,551 | 87.0%), Black / African American (185 | 10.4%), and Two or more Races (47 | 2.6%).
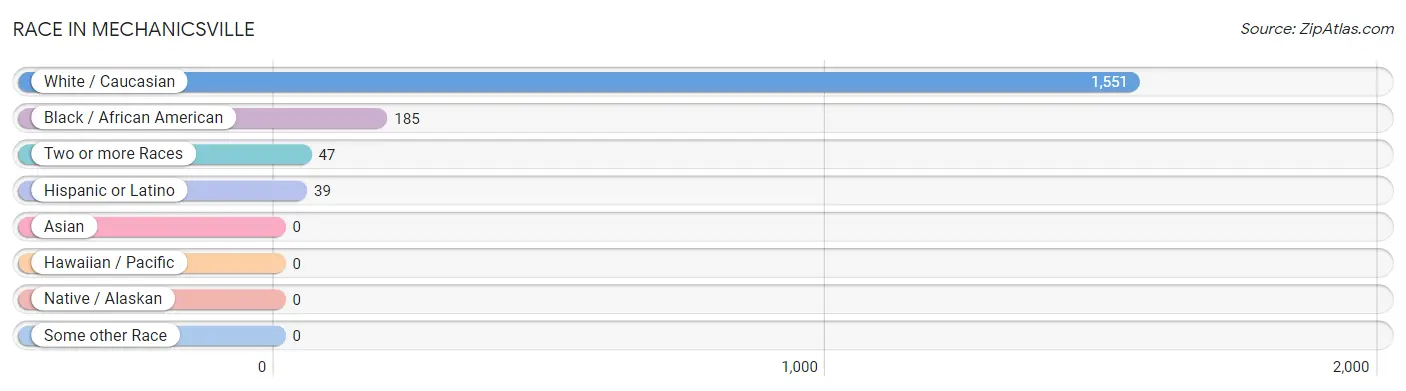
| Race | # Population | % Population |
| Asian | 0 | 0.0% |
| Black / African American | 185 | 10.4% |
| Hawaiian / Pacific | 0 | 0.0% |
| Hispanic or Latino | 39 | 2.2% |
| Native / Alaskan | 0 | 0.0% |
| White / Caucasian | 1,551 | 87.0% |
| Two or more Races | 47 | 2.6% |
| Some other Race | 0 | 0.0% |
| Total | 1,783 | 100.0% |
Ancestry in Mechanicsville
The most populous ancestries reported in Mechanicsville are Irish (576 | 32.3%), German (563 | 31.6%), French (265 | 14.9%), English (236 | 13.2%), and Polish (168 | 9.4%), together accounting for 101.4% of all Mechanicsville residents.
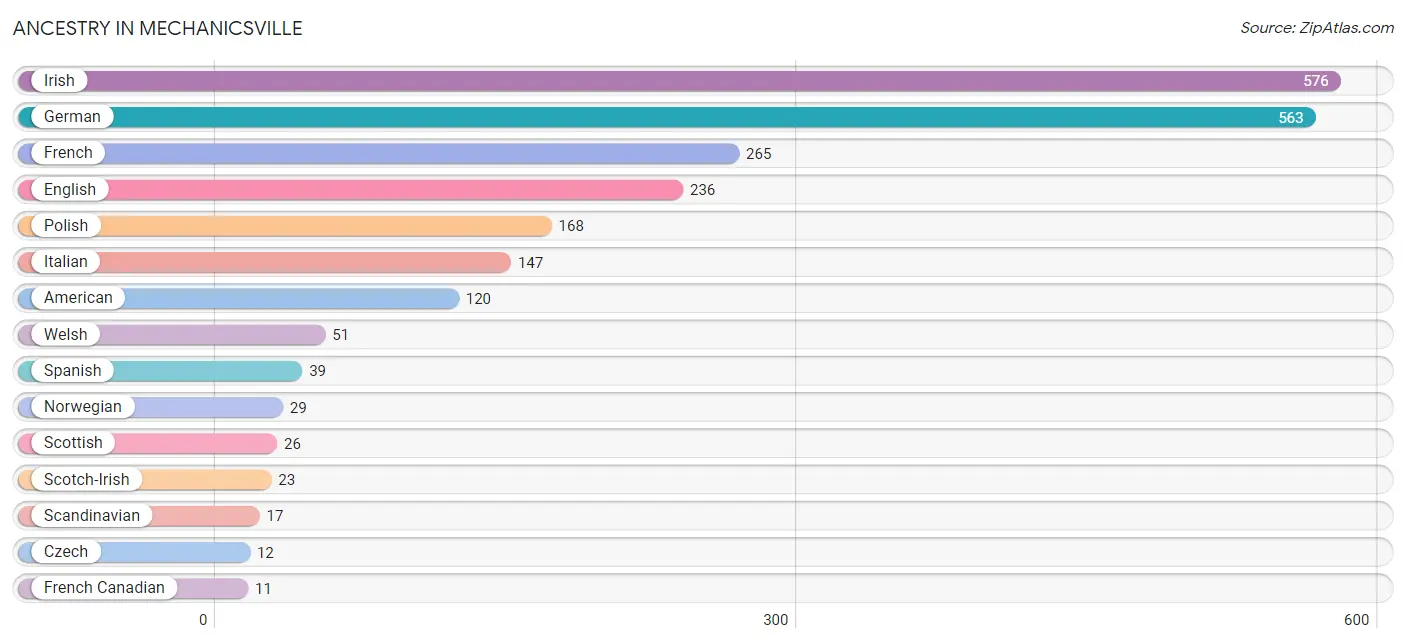
| Ancestry | # Population | % Population |
| American | 120 | 6.7% |
| Czech | 12 | 0.7% |
| Delaware | 8 | 0.4% |
| Dutch | 8 | 0.4% |
| English | 236 | 13.2% |
| European | 9 | 0.5% |
| French | 265 | 14.9% |
| French Canadian | 11 | 0.6% |
| German | 563 | 31.6% |
| Greek | 9 | 0.5% |
| Irish | 576 | 32.3% |
| Italian | 147 | 8.2% |
| Norwegian | 29 | 1.6% |
| Polish | 168 | 9.4% |
| Scandinavian | 17 | 0.9% |
| Scotch-Irish | 23 | 1.3% |
| Scottish | 26 | 1.5% |
| Spanish | 39 | 2.2% |
| Welsh | 51 | 2.9% | View All 19 Rows |
Immigrants in Mechanicsville

| Immigration Origin | # Population | % Population | View All 0 Rows |
Sex and Age in Mechanicsville
Sex and Age in Mechanicsville
The most populous age groups in Mechanicsville are 5 to 9 Years (140 | 16.0%) for men and 45 to 49 Years (152 | 16.8%) for women.
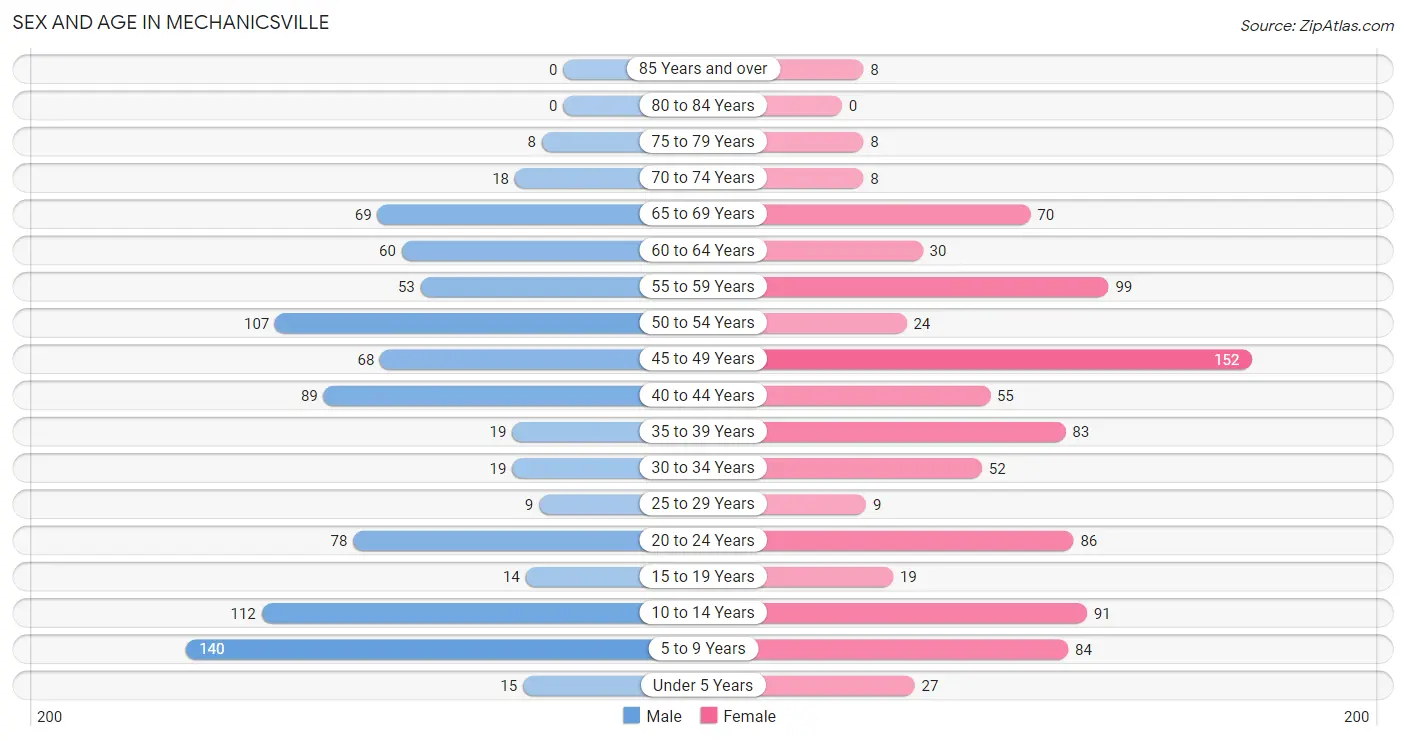
| Age Bracket | Male | Female |
| Under 5 Years | 15 (1.7%) | 27 (3.0%) |
| 5 to 9 Years | 140 (16.0%) | 84 (9.3%) |
| 10 to 14 Years | 112 (12.8%) | 91 (10.1%) |
| 15 to 19 Years | 14 (1.6%) | 19 (2.1%) |
| 20 to 24 Years | 78 (8.9%) | 86 (9.5%) |
| 25 to 29 Years | 9 (1.0%) | 9 (1.0%) |
| 30 to 34 Years | 19 (2.2%) | 52 (5.8%) |
| 35 to 39 Years | 19 (2.2%) | 83 (9.2%) |
| 40 to 44 Years | 89 (10.1%) | 55 (6.1%) |
| 45 to 49 Years | 68 (7.7%) | 152 (16.8%) |
| 50 to 54 Years | 107 (12.2%) | 24 (2.6%) |
| 55 to 59 Years | 53 (6.0%) | 99 (10.9%) |
| 60 to 64 Years | 60 (6.8%) | 30 (3.3%) |
| 65 to 69 Years | 69 (7.9%) | 70 (7.7%) |
| 70 to 74 Years | 18 (2.1%) | 8 (0.9%) |
| 75 to 79 Years | 8 (0.9%) | 8 (0.9%) |
| 80 to 84 Years | 0 (0.0%) | 0 (0.0%) |
| 85 Years and over | 0 (0.0%) | 8 (0.9%) |
| Total | 878 (100.0%) | 905 (100.0%) |
Families and Households in Mechanicsville
Median Family Size in Mechanicsville
The median family size in Mechanicsville is 3.24 persons per family, with married-couple families (421 | 87.3%) accounting for the largest median family size of 3.29 persons per family. On the other hand, single female/mother families (8 | 1.7%) represent the smallest median family size with 2.25 persons per family.
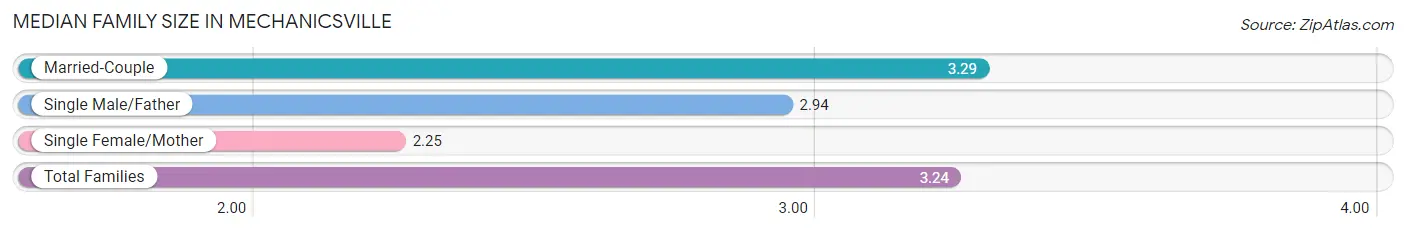
| Family Type | # Families | Family Size |
| Married-Couple | 421 (87.3%) | 3.29 |
| Single Male/Father | 53 (11.0%) | 2.94 |
| Single Female/Mother | 8 (1.7%) | 2.25 |
| Total Families | 482 (100.0%) | 3.24 |
Median Household Size in Mechanicsville
The median household size in Mechanicsville is 2.90 persons per household, with single male/father households (53 | 8.6%) accounting for the largest median household size of 3.74 persons per household. non-family households (132 | 21.5%) represent the smallest median household size with 1.37 persons per household.
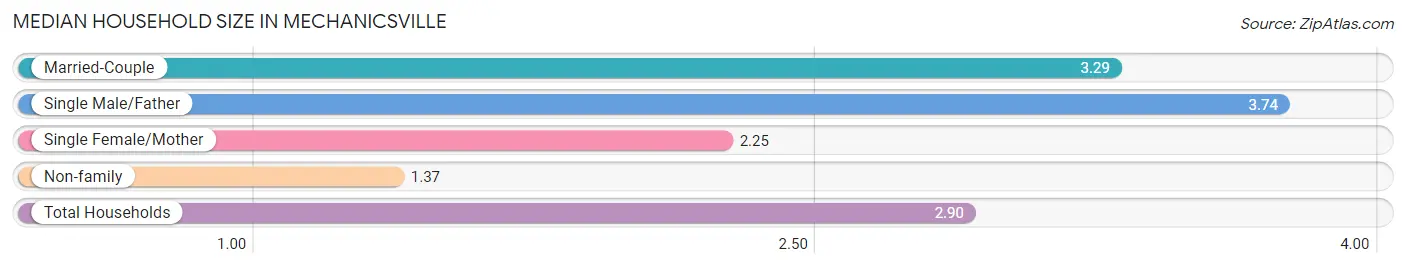
| Household Type | # Households | Household Size |
| Married-Couple | 421 (68.6%) | 3.29 |
| Single Male/Father | 53 (8.6%) | 3.74 |
| Single Female/Mother | 8 (1.3%) | 2.25 |
| Non-family | 132 (21.5%) | 1.37 |
| Total Households | 614 (100.0%) | 2.90 |
Household Size by Marriage Status in Mechanicsville
Out of a total of 614 households in Mechanicsville, 482 (78.5%) are family households, while 132 (21.5%) are nonfamily households. The most numerous type of family households are 3-person households, comprising 170, and the most common type of nonfamily households are 1-person households, comprising 93.
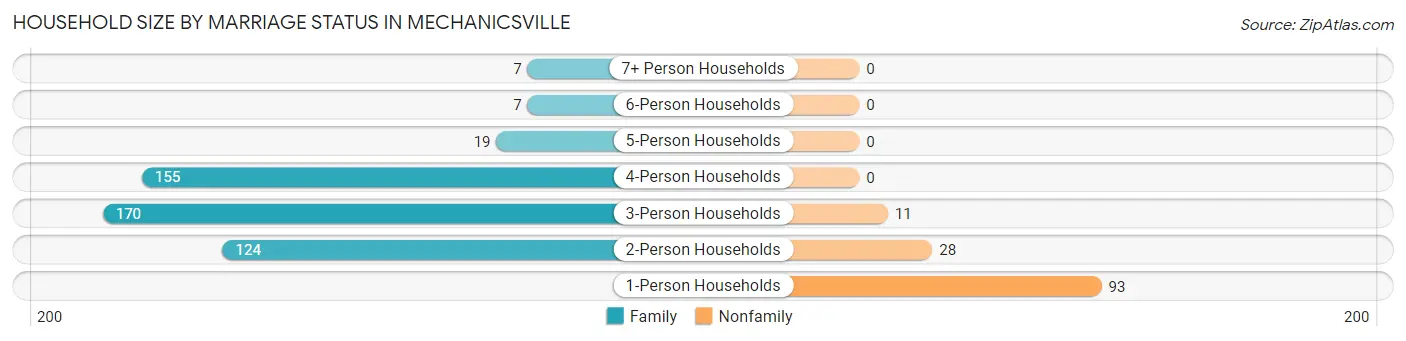
| Household Size | Family Households | Nonfamily Households |
| 1-Person Households | - | 93 (15.1%) |
| 2-Person Households | 124 (20.2%) | 28 (4.6%) |
| 3-Person Households | 170 (27.7%) | 11 (1.8%) |
| 4-Person Households | 155 (25.2%) | 0 (0.0%) |
| 5-Person Households | 19 (3.1%) | 0 (0.0%) |
| 6-Person Households | 7 (1.1%) | 0 (0.0%) |
| 7+ Person Households | 7 (1.1%) | 0 (0.0%) |
| Total | 482 (78.5%) | 132 (21.5%) |
Female Fertility in Mechanicsville
Fertility by Age in Mechanicsville
Average fertility rate in Mechanicsville is 28.0 births per 1,000 women. Women in the age bracket of 20 to 34 years have the highest fertility rate with 88.0 births per 1,000 women. Women in the age bracket of 20 to 34 years acount for 100.0% of all women with births.
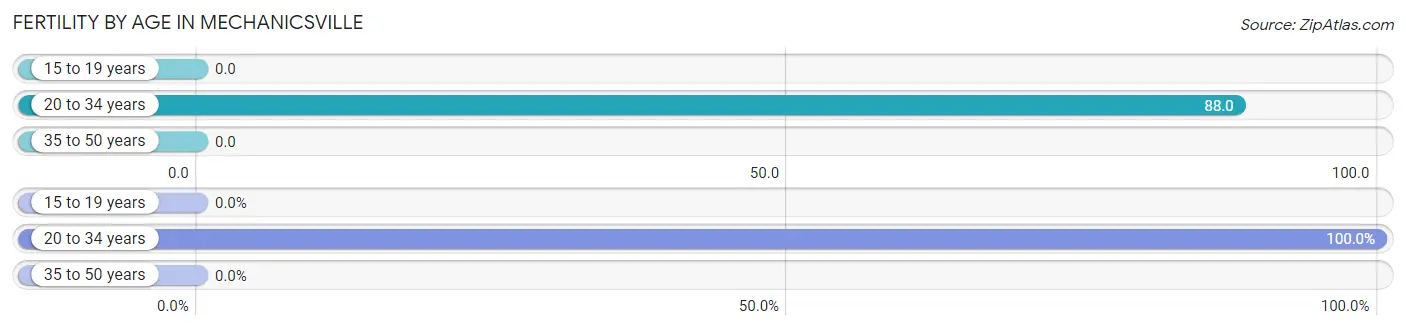
| Age Bracket | Women with Births | Births / 1,000 Women |
| 15 to 19 years | 0 (0.0%) | 0.0 |
| 20 to 34 years | 13 (100.0%) | 88.0 |
| 35 to 50 years | 0 (0.0%) | 0.0 |
| Total | 13 (100.0%) | 28.0 |
Fertility by Age by Marriage Status in Mechanicsville
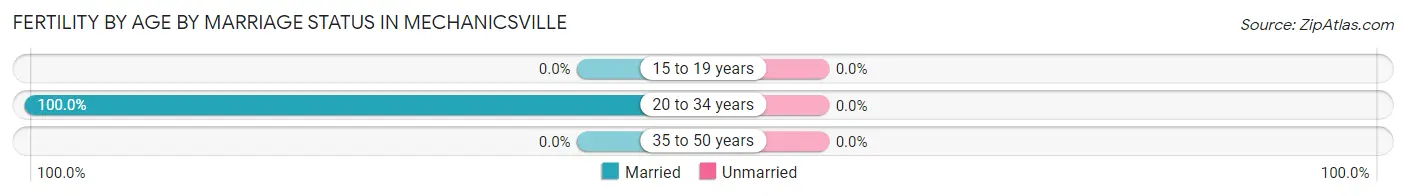
| Age Bracket | Married | Unmarried |
| 15 to 19 years | 0 (0.0%) | 0 (0.0%) |
| 20 to 34 years | 13 (100.0%) | 0 (0.0%) |
| 35 to 50 years | 0 (0.0%) | 0 (0.0%) |
| Total | 13 (100.0%) | 0 (0.0%) |
Fertility by Education in Mechanicsville
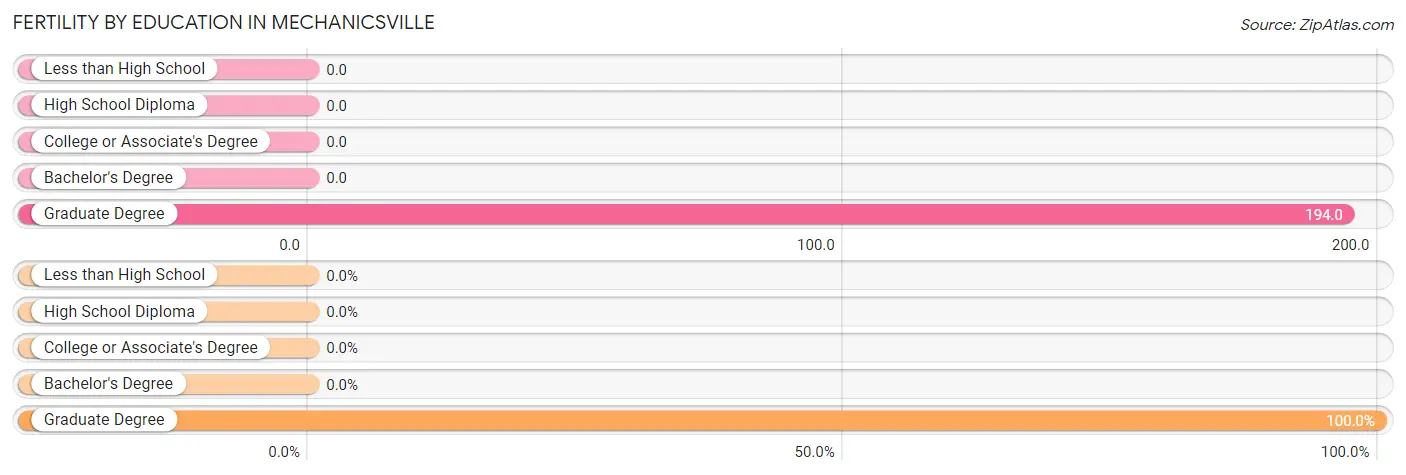
| Educational Attainment | Women with Births | Births / 1,000 Women |
| Less than High School | 0 (0.0%) | 0.0 |
| High School Diploma | 0 (0.0%) | 0.0 |
| College or Associate's Degree | 0 (0.0%) | 0.0 |
| Bachelor's Degree | 0 (0.0%) | 0.0 |
| Graduate Degree | 13 (100.0%) | 194.0 |
| Total | 13 (100.0%) | 28.0 |
Fertility by Education by Marriage Status in Mechanicsville
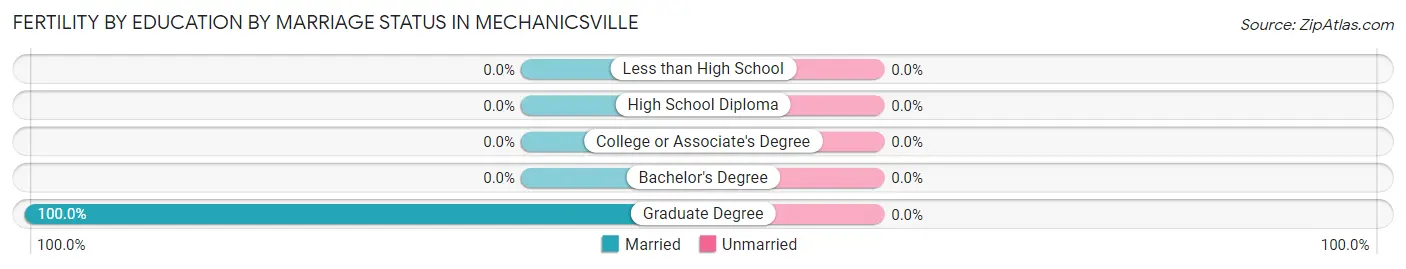
| Educational Attainment | Married | Unmarried |
| Less than High School | 0 (0.0%) | 0 (0.0%) |
| High School Diploma | 0 (0.0%) | 0 (0.0%) |
| College or Associate's Degree | 0 (0.0%) | 0 (0.0%) |
| Bachelor's Degree | 0 (0.0%) | 0 (0.0%) |
| Graduate Degree | 13 (100.0%) | 0 (0.0%) |
| Total | 13 (100.0%) | 0 (0.0%) |
Employment Characteristics in Mechanicsville
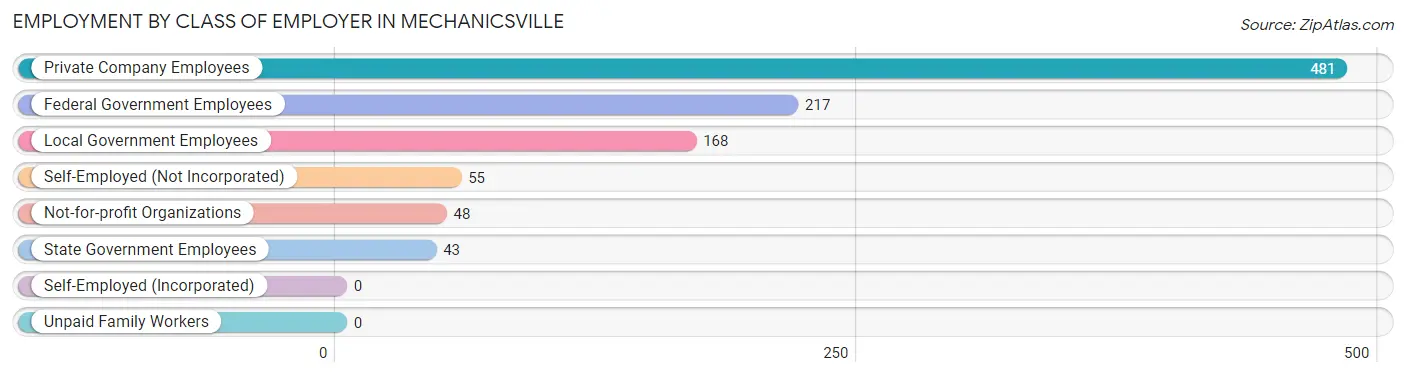
Employment by Class of Employer in Mechanicsville
Among the 1,012 employed individuals in Mechanicsville, private company employees (481 | 47.5%), federal government employees (217 | 21.4%), and local government employees (168 | 16.6%) make up the most common classes of employment.
| Employer Class | # Employees | % Employees |
| Private Company Employees | 481 | 47.5% |
| Self-Employed (Incorporated) | 0 | 0.0% |
| Self-Employed (Not Incorporated) | 55 | 5.4% |
| Not-for-profit Organizations | 48 | 4.7% |
| Local Government Employees | 168 | 16.6% |
| State Government Employees | 43 | 4.3% |
| Federal Government Employees | 217 | 21.4% |
| Unpaid Family Workers | 0 | 0.0% |
| Total | 1,012 | 100.0% |
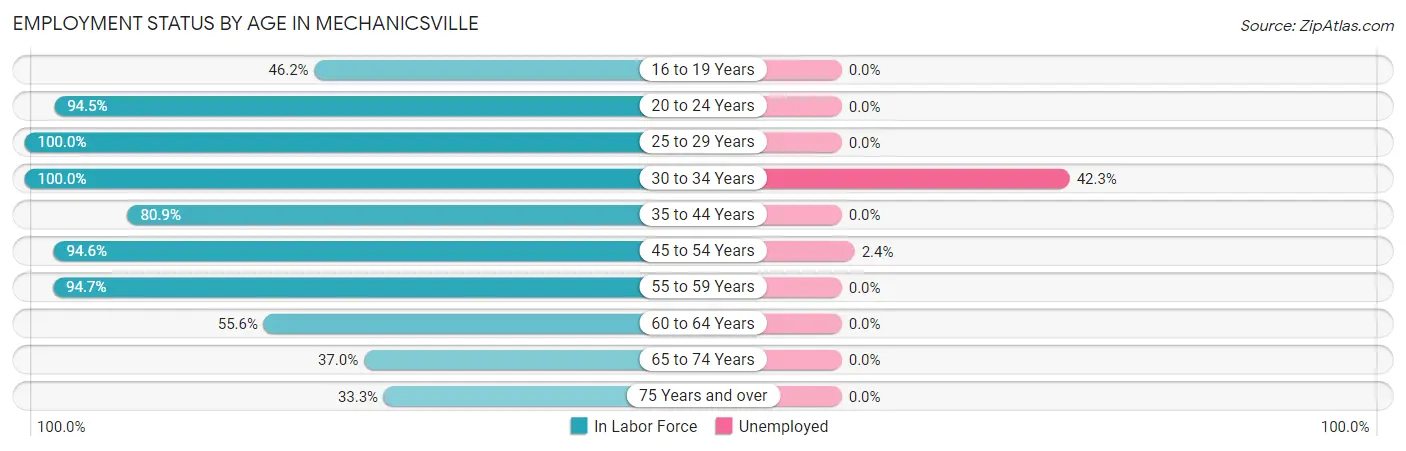
Employment Status by Age in Mechanicsville
According to the labor force statistics for Mechanicsville, out of the total population over 16 years of age (1,307), 80.3% or 1,050 individuals are in the labor force, with 3.9% or 41 of them unemployed. The age group with the highest labor force participation rate is 25 to 29 years, with 100.0% or 18 individuals in the labor force. Within the labor force, the 30 to 34 years age range has the highest percentage of unemployed individuals, with 42.3% or 30 of them being unemployed.
| Age Bracket | In Labor Force | Unemployed |
| 16 to 19 Years | 12 (46.2%) | 0 (0.0%) |
| 20 to 24 Years | 155 (94.5%) | 0 (0.0%) |
| 25 to 29 Years | 18 (100.0%) | 0 (0.0%) |
| 30 to 34 Years | 71 (100.0%) | 30 (42.3%) |
| 35 to 44 Years | 199 (80.9%) | 0 (0.0%) |
| 45 to 54 Years | 332 (94.6%) | 8 (2.4%) |
| 55 to 59 Years | 144 (94.7%) | 0 (0.0%) |
| 60 to 64 Years | 50 (55.6%) | 0 (0.0%) |
| 65 to 74 Years | 61 (37.0%) | 0 (0.0%) |
| 75 Years and over | 8 (33.3%) | 0 (0.0%) |
| Total | 1,050 (80.3%) | 41 (3.9%) |
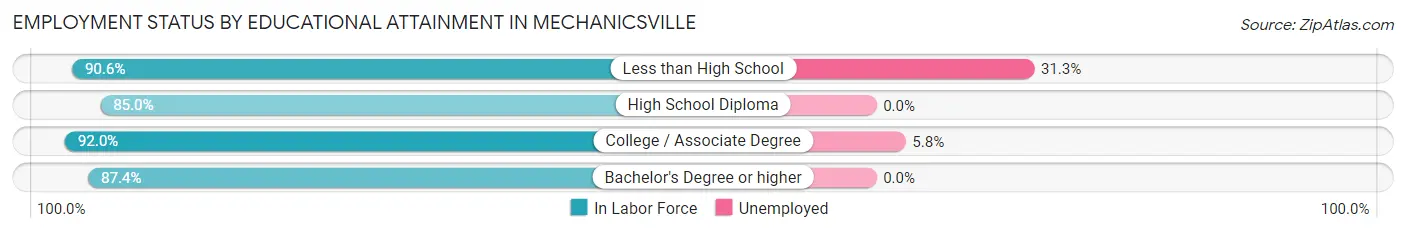
Employment Status by Educational Attainment in Mechanicsville
According to labor force statistics for Mechanicsville, 87.7% of individuals (814) out of the total population between 25 and 64 years of age (928) are in the labor force, with 5.1% or 42 of them being unemployed. The group with the highest labor force participation rate are those with the educational attainment of college / associate degree, with 92.0% or 138 individuals in the labor force. Within the labor force, individuals with less than high school education have the highest percentage of unemployment, with 31.3% or 30 of them being unemployed.
| Educational Attainment | In Labor Force | Unemployed |
| Less than High School | 96 (90.6%) | 33 (31.3%) |
| High School Diploma | 261 (85.0%) | 0 (0.0%) |
| College / Associate Degree | 138 (92.0%) | 9 (5.8%) |
| Bachelor's Degree or higher | 319 (87.4%) | 0 (0.0%) |
| Total | 814 (87.7%) | 47 (5.1%) |
Employment Occupations by Sex in Mechanicsville
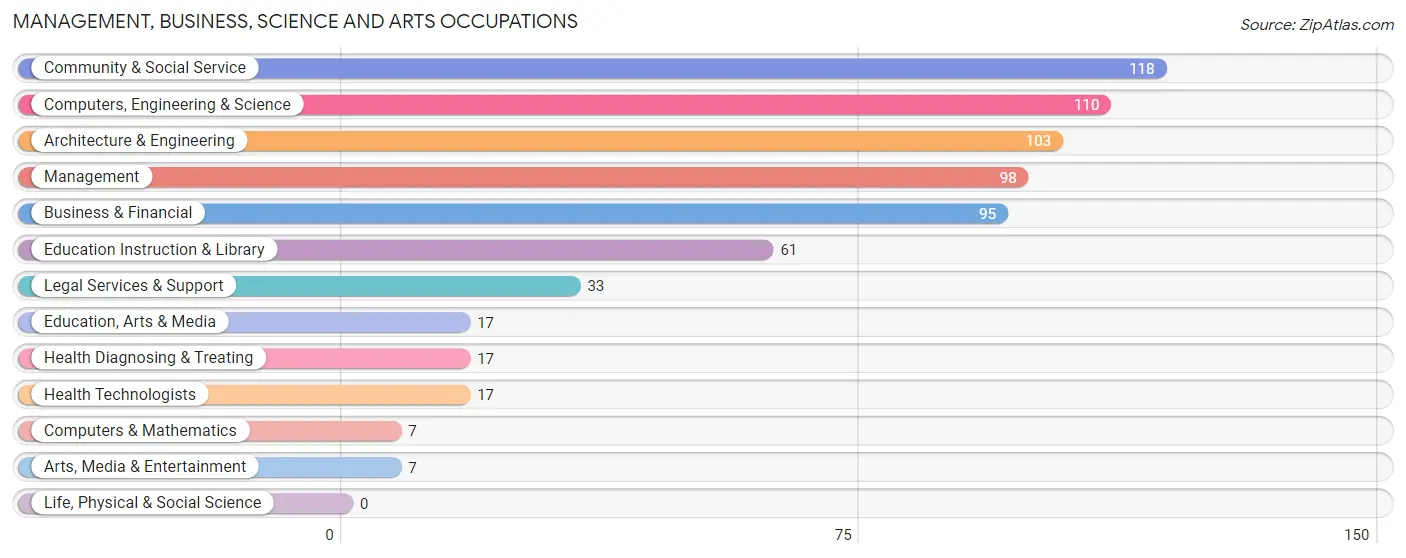
Management, Business, Science and Arts Occupations
The most common Management, Business, Science and Arts occupations in Mechanicsville are Community & Social Service (118 | 12.5%), Computers, Engineering & Science (110 | 11.6%), Architecture & Engineering (103 | 10.9%), Management (98 | 10.4%), and Business & Financial (95 | 10.0%).
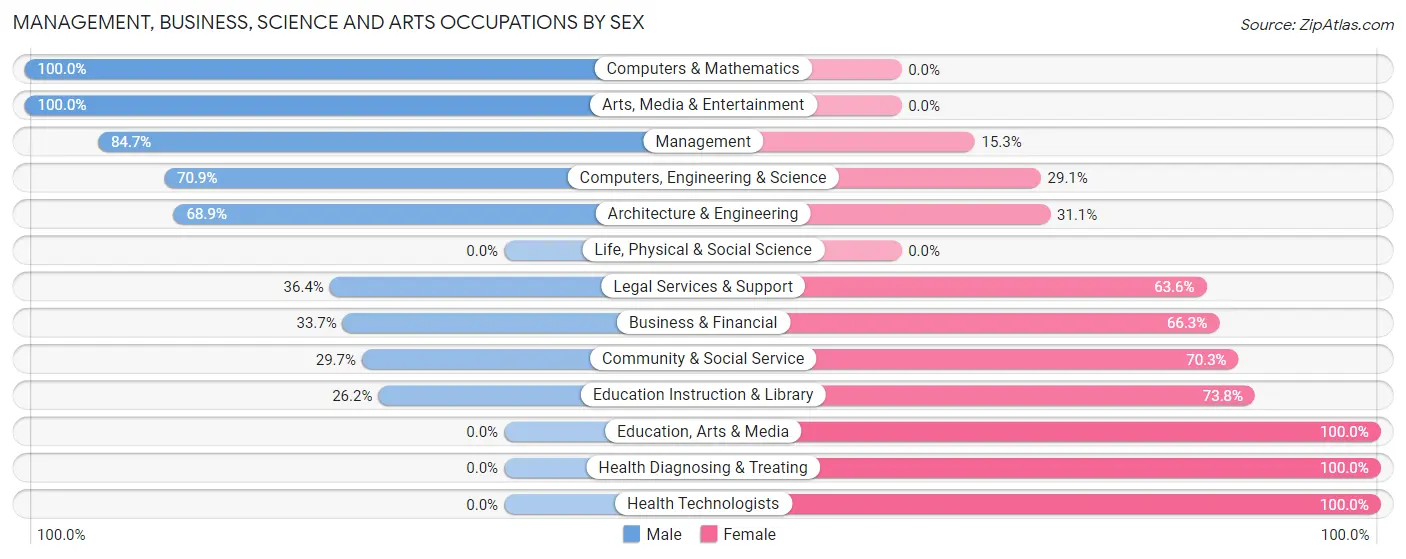
Management, Business, Science and Arts Occupations by Sex
Within the Management, Business, Science and Arts occupations in Mechanicsville, the most male-oriented occupations are Computers & Mathematics (100.0%), Arts, Media & Entertainment (100.0%), and Management (84.7%), while the most female-oriented occupations are Education, Arts & Media (100.0%), Health Diagnosing & Treating (100.0%), and Health Technologists (100.0%).
| Occupation | Male | Female |
| Management | 83 (84.7%) | 15 (15.3%) |
| Business & Financial | 32 (33.7%) | 63 (66.3%) |
| Computers, Engineering & Science | 78 (70.9%) | 32 (29.1%) |
| Computers & Mathematics | 7 (100.0%) | 0 (0.0%) |
| Architecture & Engineering | 71 (68.9%) | 32 (31.1%) |
| Life, Physical & Social Science | 0 (0.0%) | 0 (0.0%) |
| Community & Social Service | 35 (29.7%) | 83 (70.3%) |
| Education, Arts & Media | 0 (0.0%) | 17 (100.0%) |
| Legal Services & Support | 12 (36.4%) | 21 (63.6%) |
| Education Instruction & Library | 16 (26.2%) | 45 (73.8%) |
| Arts, Media & Entertainment | 7 (100.0%) | 0 (0.0%) |
| Health Diagnosing & Treating | 0 (0.0%) | 17 (100.0%) |
| Health Technologists | 0 (0.0%) | 17 (100.0%) |
| Total (Category) | 228 (52.0%) | 210 (47.9%) |
| Total (Overall) | 449 (47.5%) | 497 (52.5%) |
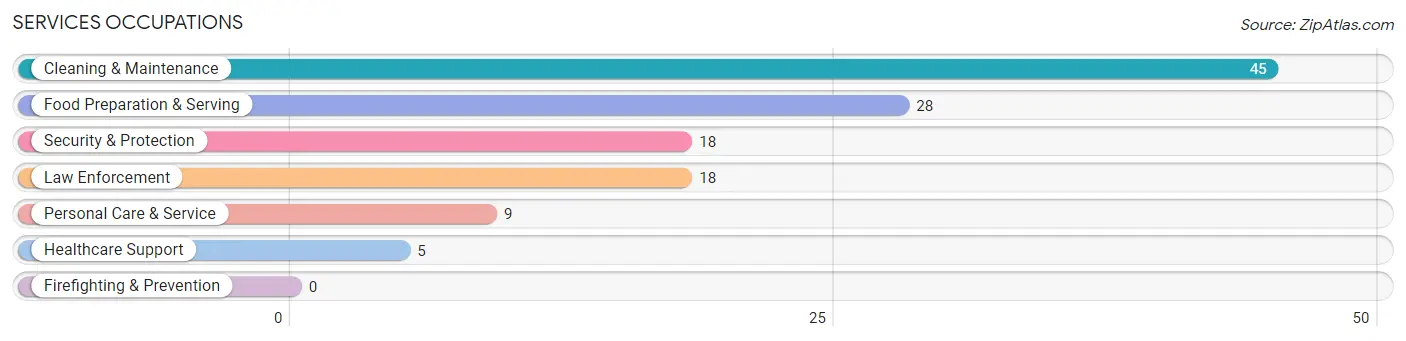
Services Occupations
The most common Services occupations in Mechanicsville are Cleaning & Maintenance (45 | 4.8%), Food Preparation & Serving (28 | 3.0%), Security & Protection (18 | 1.9%), Law Enforcement (18 | 1.9%), and Personal Care & Service (9 | 0.9%).
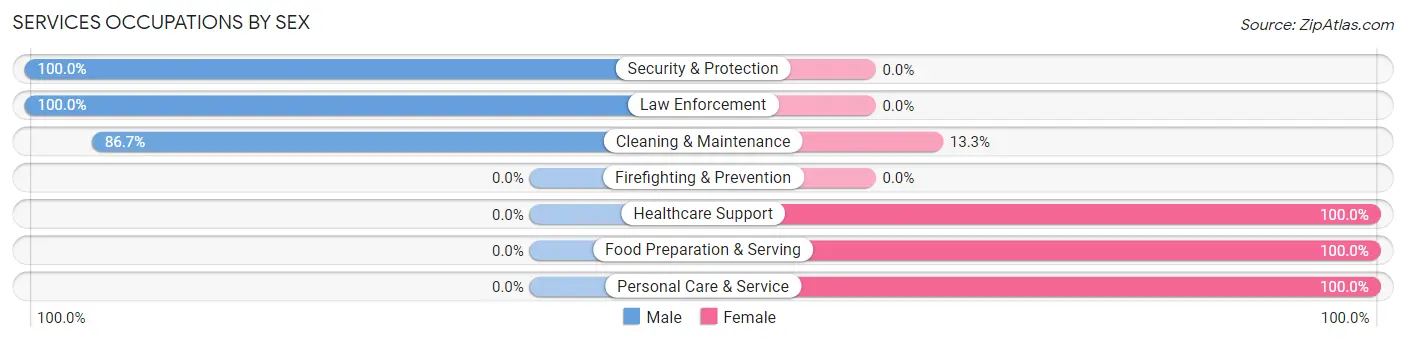
Services Occupations by Sex
Within the Services occupations in Mechanicsville, the most male-oriented occupations are Security & Protection (100.0%), Law Enforcement (100.0%), and Cleaning & Maintenance (86.7%), while the most female-oriented occupations are Healthcare Support (100.0%), Food Preparation & Serving (100.0%), and Personal Care & Service (100.0%).
| Occupation | Male | Female |
| Healthcare Support | 0 (0.0%) | 5 (100.0%) |
| Security & Protection | 18 (100.0%) | 0 (0.0%) |
| Firefighting & Prevention | 0 (0.0%) | 0 (0.0%) |
| Law Enforcement | 18 (100.0%) | 0 (0.0%) |
| Food Preparation & Serving | 0 (0.0%) | 28 (100.0%) |
| Cleaning & Maintenance | 39 (86.7%) | 6 (13.3%) |
| Personal Care & Service | 0 (0.0%) | 9 (100.0%) |
| Total (Category) | 57 (54.3%) | 48 (45.7%) |
| Total (Overall) | 449 (47.5%) | 497 (52.5%) |
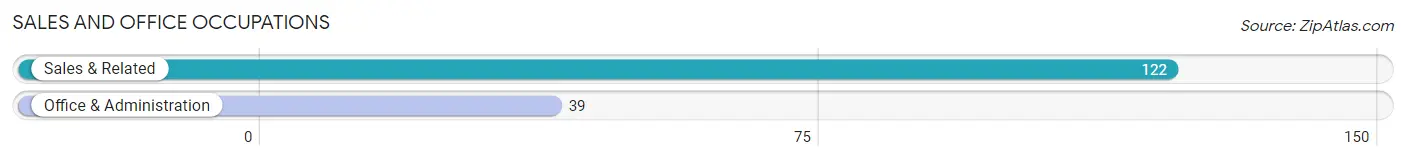
Sales and Office Occupations
The most common Sales and Office occupations in Mechanicsville are Sales & Related (122 | 12.9%), and Office & Administration (39 | 4.1%).
Sales and Office Occupations by Sex
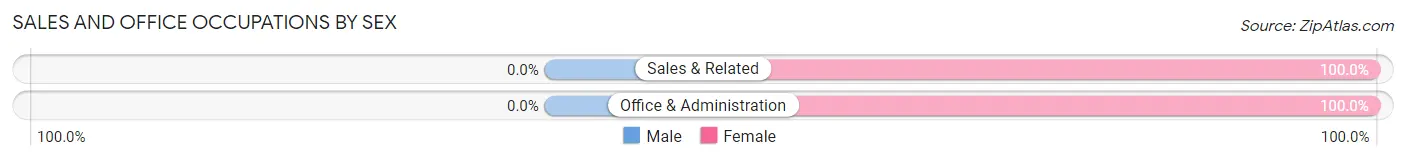
| Occupation | Male | Female |
| Sales & Related | 0 (0.0%) | 122 (100.0%) |
| Office & Administration | 0 (0.0%) | 39 (100.0%) |
| Total (Category) | 0 (0.0%) | 161 (100.0%) |
| Total (Overall) | 449 (47.5%) | 497 (52.5%) |
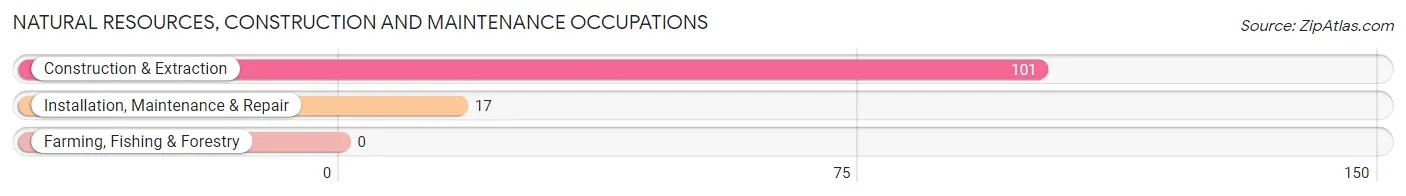
Natural Resources, Construction and Maintenance Occupations
The most common Natural Resources, Construction and Maintenance occupations in Mechanicsville are Construction & Extraction (101 | 10.7%), and Installation, Maintenance & Repair (17 | 1.8%).
Natural Resources, Construction and Maintenance Occupations by Sex
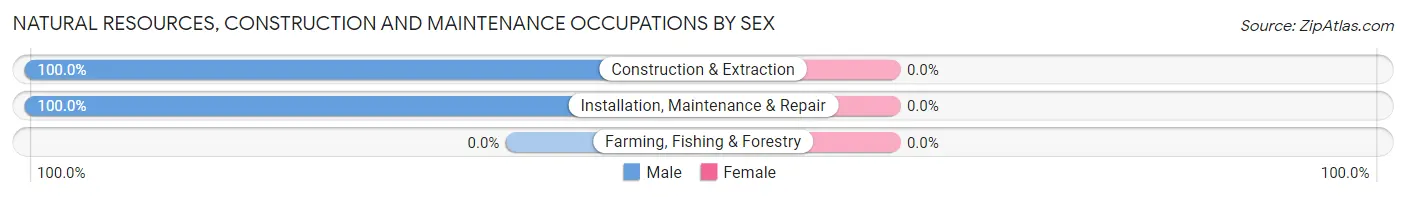
| Occupation | Male | Female |
| Farming, Fishing & Forestry | 0 (0.0%) | 0 (0.0%) |
| Construction & Extraction | 101 (100.0%) | 0 (0.0%) |
| Installation, Maintenance & Repair | 17 (100.0%) | 0 (0.0%) |
| Total (Category) | 118 (100.0%) | 0 (0.0%) |
| Total (Overall) | 449 (47.5%) | 497 (52.5%) |
Production, Transportation and Moving Occupations
The most common Production, Transportation and Moving occupations in Mechanicsville are Material Moving (69 | 7.3%), Transportation (48 | 5.1%), and Production (7 | 0.7%).
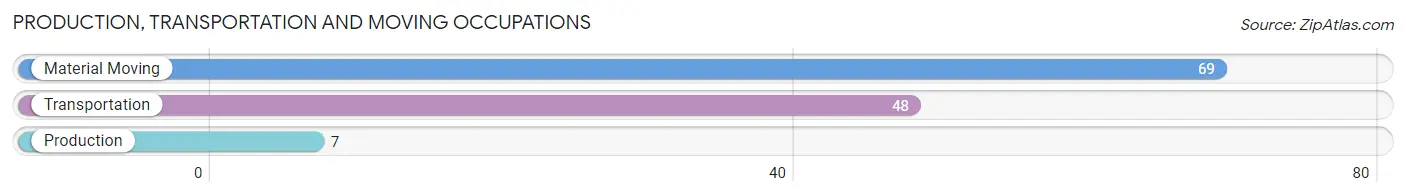
Production, Transportation and Moving Occupations by Sex
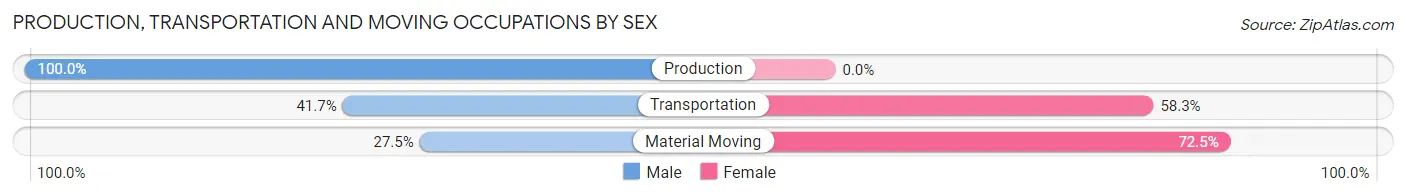
| Occupation | Male | Female |
| Production | 7 (100.0%) | 0 (0.0%) |
| Transportation | 20 (41.7%) | 28 (58.3%) |
| Material Moving | 19 (27.5%) | 50 (72.5%) |
| Total (Category) | 46 (37.1%) | 78 (62.9%) |
| Total (Overall) | 449 (47.5%) | 497 (52.5%) |
Employment Industries by Sex in Mechanicsville
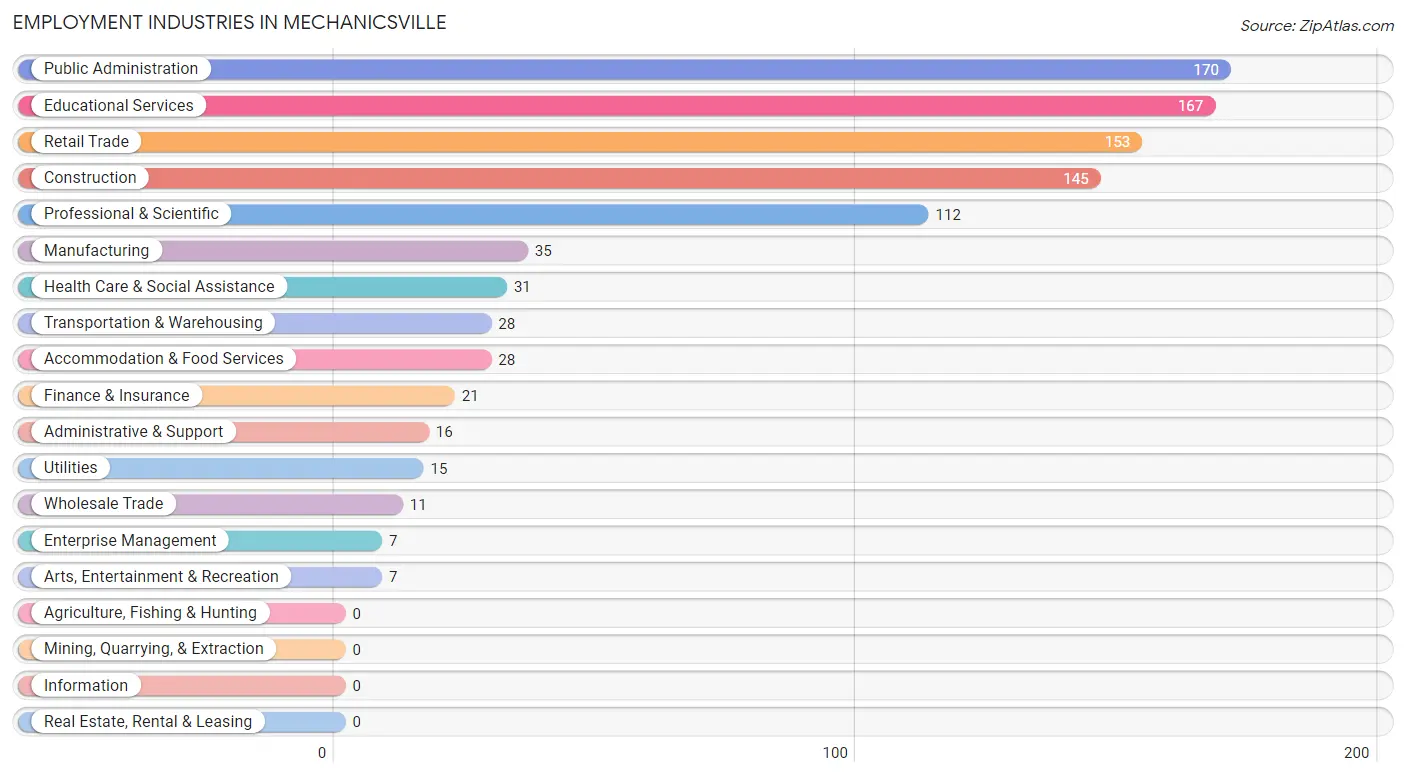
Employment Industries in Mechanicsville
The major employment industries in Mechanicsville include Public Administration (170 | 18.0%), Educational Services (167 | 17.6%), Retail Trade (153 | 16.2%), Construction (145 | 15.3%), and Professional & Scientific (112 | 11.8%).
Employment Industries by Sex in Mechanicsville
The Mechanicsville industries that see more men than women are Construction (100.0%), Manufacturing (100.0%), and Wholesale Trade (100.0%), whereas the industries that tend to have a higher number of women are Transportation & Warehousing (100.0%), Utilities (100.0%), and Finance & Insurance (100.0%).
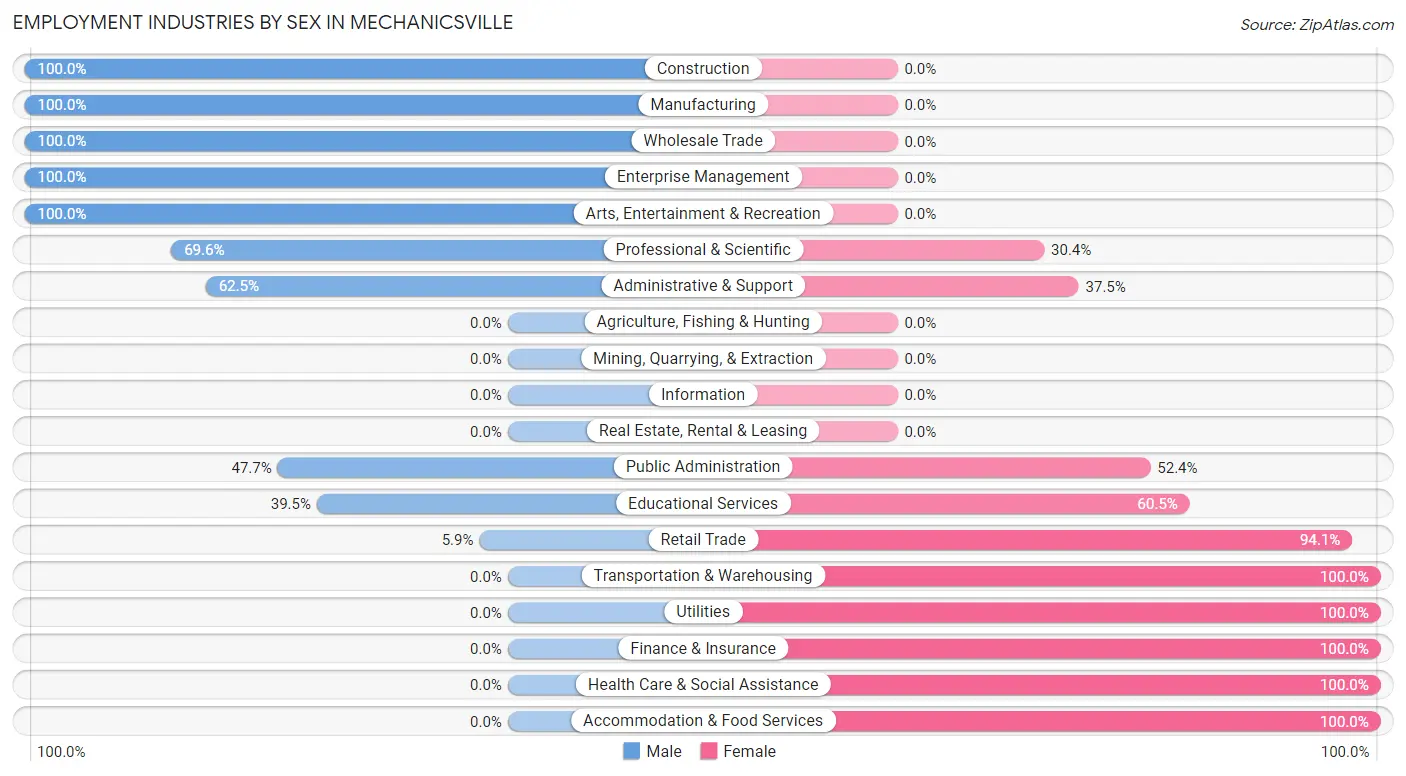
| Industry | Male | Female |
| Agriculture, Fishing & Hunting | 0 (0.0%) | 0 (0.0%) |
| Mining, Quarrying, & Extraction | 0 (0.0%) | 0 (0.0%) |
| Construction | 145 (100.0%) | 0 (0.0%) |
| Manufacturing | 35 (100.0%) | 0 (0.0%) |
| Wholesale Trade | 11 (100.0%) | 0 (0.0%) |
| Retail Trade | 9 (5.9%) | 144 (94.1%) |
| Transportation & Warehousing | 0 (0.0%) | 28 (100.0%) |
| Utilities | 0 (0.0%) | 15 (100.0%) |
| Information | 0 (0.0%) | 0 (0.0%) |
| Finance & Insurance | 0 (0.0%) | 21 (100.0%) |
| Real Estate, Rental & Leasing | 0 (0.0%) | 0 (0.0%) |
| Professional & Scientific | 78 (69.6%) | 34 (30.4%) |
| Enterprise Management | 7 (100.0%) | 0 (0.0%) |
| Administrative & Support | 10 (62.5%) | 6 (37.5%) |
| Educational Services | 66 (39.5%) | 101 (60.5%) |
| Health Care & Social Assistance | 0 (0.0%) | 31 (100.0%) |
| Arts, Entertainment & Recreation | 7 (100.0%) | 0 (0.0%) |
| Accommodation & Food Services | 0 (0.0%) | 28 (100.0%) |
| Public Administration | 81 (47.6%) | 89 (52.3%) |
| Total | 449 (47.5%) | 497 (52.5%) |
Education in Mechanicsville
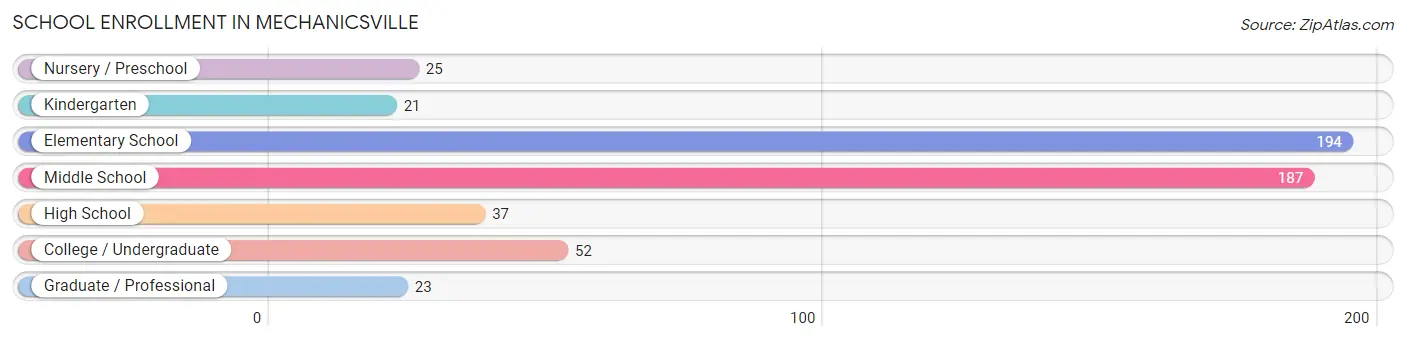
School Enrollment in Mechanicsville
The most common levels of schooling among the 539 students in Mechanicsville are elementary school (194 | 36.0%), middle school (187 | 34.7%), and college / undergraduate (52 | 9.7%).
| School Level | # Students | % Students |
| Nursery / Preschool | 25 | 4.6% |
| Kindergarten | 21 | 3.9% |
| Elementary School | 194 | 36.0% |
| Middle School | 187 | 34.7% |
| High School | 37 | 6.9% |
| College / Undergraduate | 52 | 9.7% |
| Graduate / Professional | 23 | 4.3% |
| Total | 539 | 100.0% |
School Enrollment by Age by Funding Source in Mechanicsville
Out of a total of 539 students who are enrolled in schools in Mechanicsville, 98 (18.2%) attend a private institution, while the remaining 441 (81.8%) are enrolled in public schools. The age group of 35 years and over has the highest likelihood of being enrolled in private schools, with 23 (100.0% in the age bracket) enrolled. Conversely, the age group of 3 to 4 year olds has the lowest likelihood of being enrolled in a private school, with 16 (100.0% in the age bracket) attending a public institution.
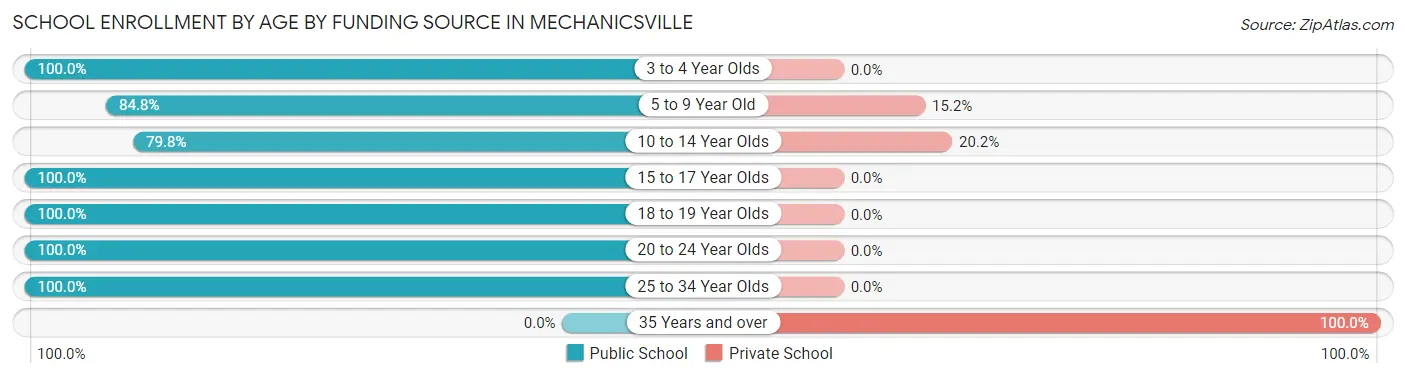
| Age Bracket | Public School | Private School |
| 3 to 4 Year Olds | 16 (100.0%) | 0 (0.0%) |
| 5 to 9 Year Old | 190 (84.8%) | 34 (15.2%) |
| 10 to 14 Year Olds | 162 (79.8%) | 41 (20.2%) |
| 15 to 17 Year Olds | 28 (100.0%) | 0 (0.0%) |
| 18 to 19 Year Olds | 5 (100.0%) | 0 (0.0%) |
| 20 to 24 Year Olds | 31 (100.0%) | 0 (0.0%) |
| 25 to 34 Year Olds | 9 (100.0%) | 0 (0.0%) |
| 35 Years and over | 0 (0.0%) | 23 (100.0%) |
| Total | 441 (81.8%) | 98 (18.2%) |
Educational Attainment by Field of Study in Mechanicsville
Arts & humanities (127 | 30.7%), engineering (108 | 26.1%), business (91 | 22.0%), education (34 | 8.2%), and social sciences (20 | 4.8%) are the most common fields of study among 414 individuals in Mechanicsville who have obtained a bachelor's degree or higher.
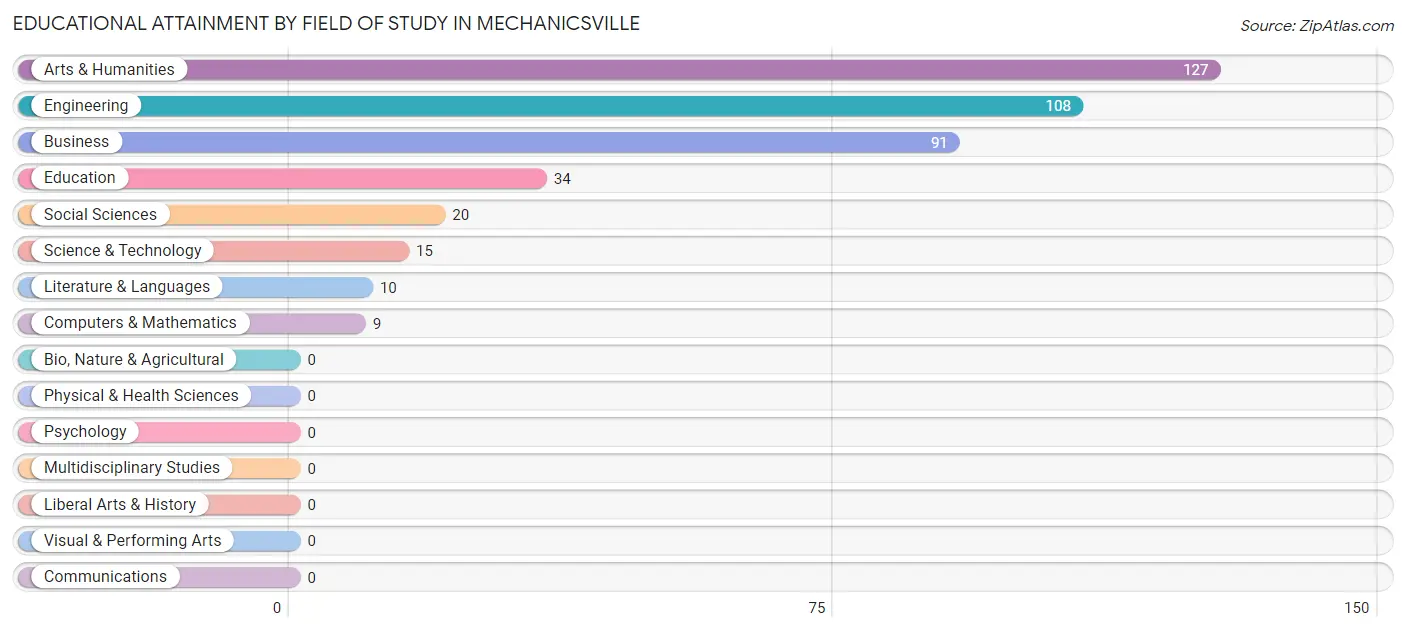
| Field of Study | # Graduates | % Graduates |
| Computers & Mathematics | 9 | 2.2% |
| Bio, Nature & Agricultural | 0 | 0.0% |
| Physical & Health Sciences | 0 | 0.0% |
| Psychology | 0 | 0.0% |
| Social Sciences | 20 | 4.8% |
| Engineering | 108 | 26.1% |
| Multidisciplinary Studies | 0 | 0.0% |
| Science & Technology | 15 | 3.6% |
| Business | 91 | 22.0% |
| Education | 34 | 8.2% |
| Literature & Languages | 10 | 2.4% |
| Liberal Arts & History | 0 | 0.0% |
| Visual & Performing Arts | 0 | 0.0% |
| Communications | 0 | 0.0% |
| Arts & Humanities | 127 | 30.7% |
| Total | 414 | 100.0% |
Transportation & Commute in Mechanicsville
Vehicle Availability by Sex in Mechanicsville
The most prevalent vehicle ownership categories in Mechanicsville are males with 2 vehicles (225, accounting for 43.7%) and females with 2 vehicles (140, making up 45.3%).
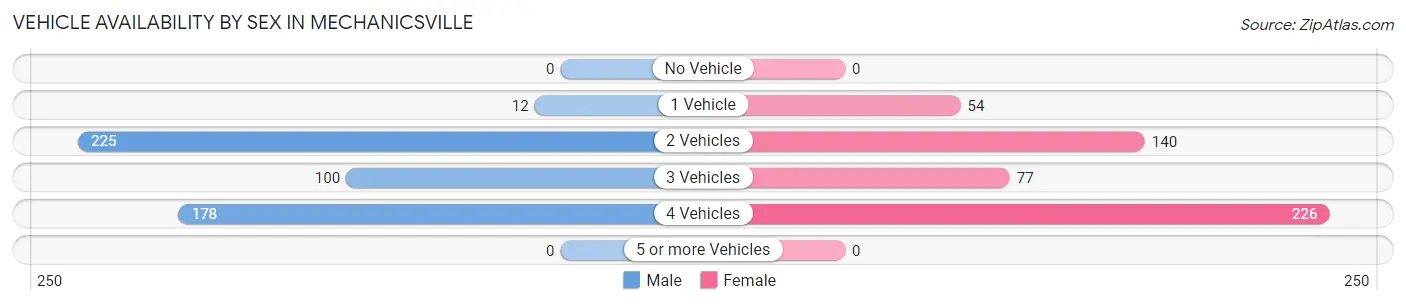
| Vehicles Available | Male | Female |
| No Vehicle | 0 (0.0%) | 0 (0.0%) |
| 1 Vehicle | 12 (2.3%) | 54 (10.9%) |
| 2 Vehicles | 225 (43.7%) | 140 (28.2%) |
| 3 Vehicles | 100 (19.4%) | 77 (15.5%) |
| 4 Vehicles | 178 (34.6%) | 226 (45.5%) |
| 5 or more Vehicles | 0 (0.0%) | 0 (0.0%) |
| Total | 515 (100.0%) | 497 (100.0%) |
Commute Time in Mechanicsville
The most frequently occuring commute durations in Mechanicsville are 30 to 34 minutes (288 commuters, 29.9%), 60 to 89 minutes (158 commuters, 16.4%), and 15 to 19 minutes (137 commuters, 14.2%).
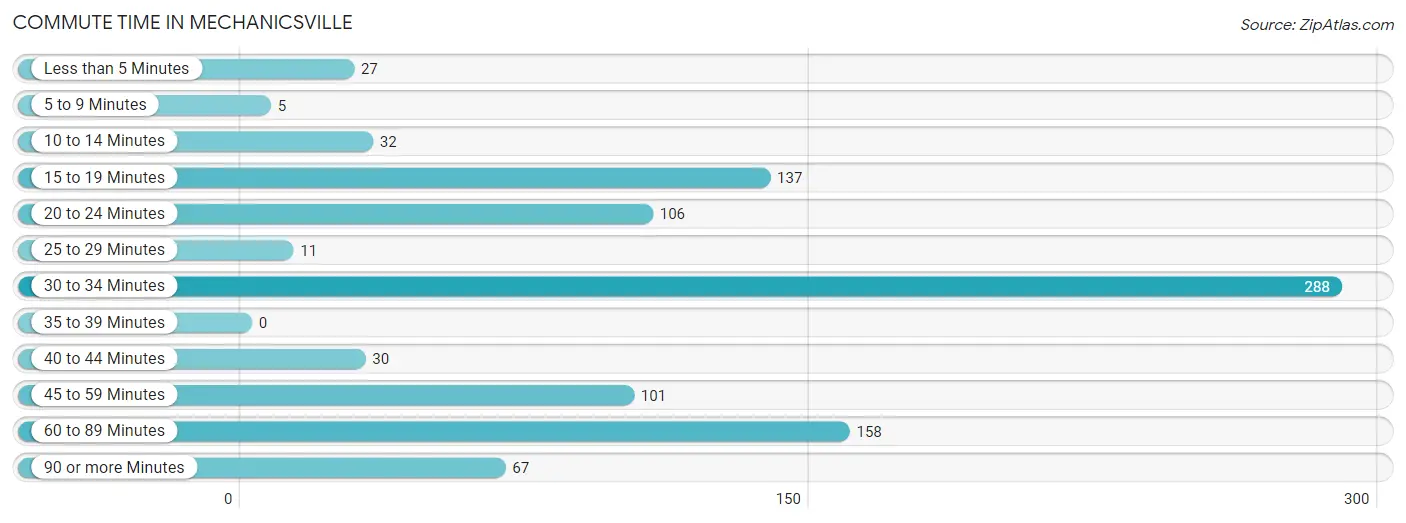
| Commute Time | # Commuters | % Commuters |
| Less than 5 Minutes | 27 | 2.8% |
| 5 to 9 Minutes | 5 | 0.5% |
| 10 to 14 Minutes | 32 | 3.3% |
| 15 to 19 Minutes | 137 | 14.2% |
| 20 to 24 Minutes | 106 | 11.0% |
| 25 to 29 Minutes | 11 | 1.1% |
| 30 to 34 Minutes | 288 | 29.9% |
| 35 to 39 Minutes | 0 | 0.0% |
| 40 to 44 Minutes | 30 | 3.1% |
| 45 to 59 Minutes | 101 | 10.5% |
| 60 to 89 Minutes | 158 | 16.4% |
| 90 or more Minutes | 67 | 7.0% |
Commute Time by Sex in Mechanicsville
The most common commute times in Mechanicsville are 30 to 34 minutes (155 commuters, 31.2%) for males and 30 to 34 minutes (133 commuters, 28.5%) for females.
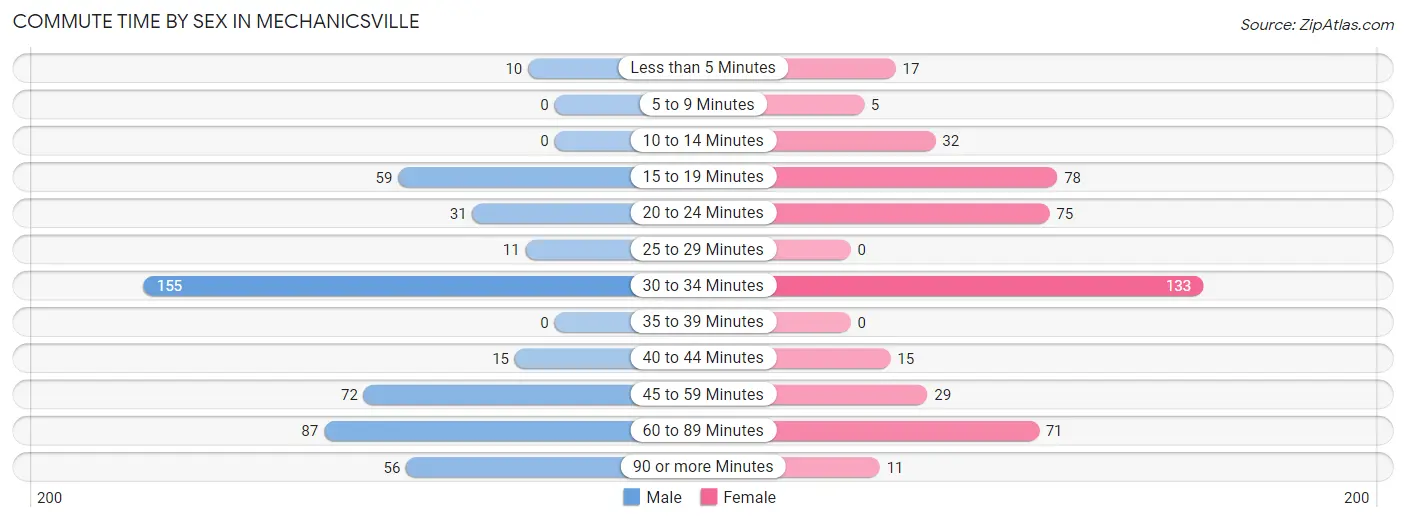
| Commute Time | Male | Female |
| Less than 5 Minutes | 10 (2.0%) | 17 (3.6%) |
| 5 to 9 Minutes | 0 (0.0%) | 5 (1.1%) |
| 10 to 14 Minutes | 0 (0.0%) | 32 (6.9%) |
| 15 to 19 Minutes | 59 (11.9%) | 78 (16.7%) |
| 20 to 24 Minutes | 31 (6.2%) | 75 (16.1%) |
| 25 to 29 Minutes | 11 (2.2%) | 0 (0.0%) |
| 30 to 34 Minutes | 155 (31.2%) | 133 (28.5%) |
| 35 to 39 Minutes | 0 (0.0%) | 0 (0.0%) |
| 40 to 44 Minutes | 15 (3.0%) | 15 (3.2%) |
| 45 to 59 Minutes | 72 (14.5%) | 29 (6.2%) |
| 60 to 89 Minutes | 87 (17.5%) | 71 (15.2%) |
| 90 or more Minutes | 56 (11.3%) | 11 (2.4%) |
Time of Departure to Work by Sex in Mechanicsville
The most frequent times of departure to work in Mechanicsville are 12:00 AM to 4:59 AM (100, 20.2%) for males and 6:30 AM to 6:59 AM (98, 21.0%) for females.
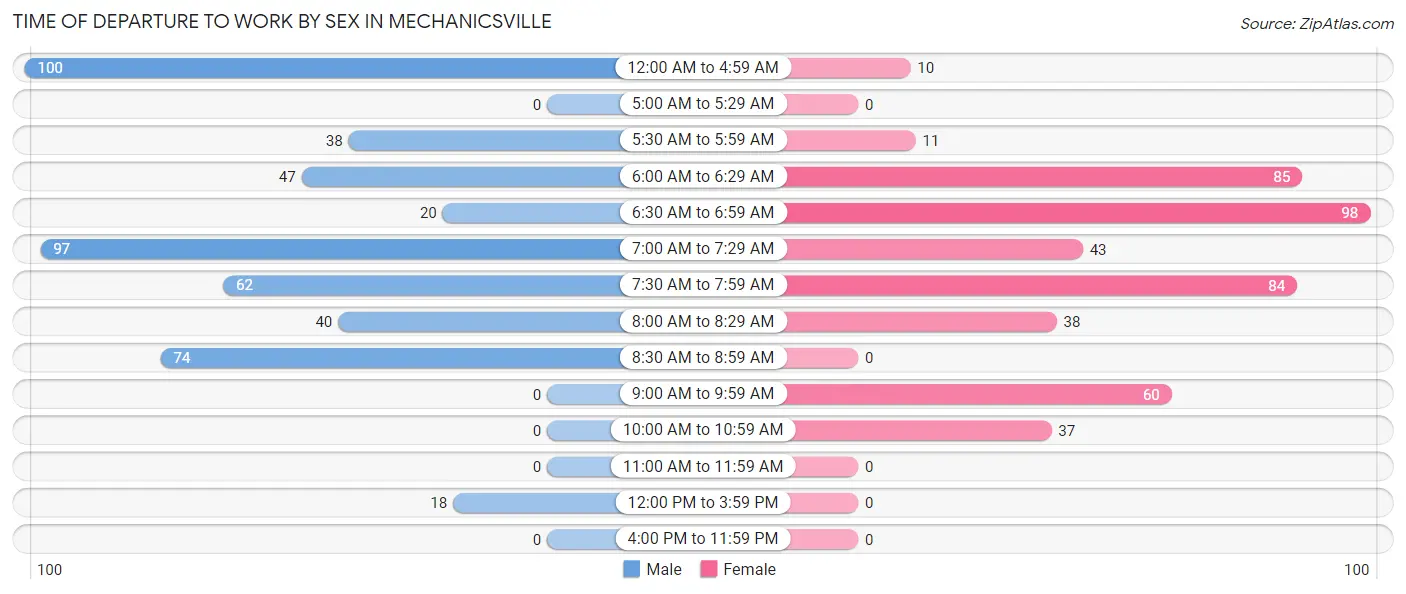
| Time of Departure | Male | Female |
| 12:00 AM to 4:59 AM | 100 (20.2%) | 10 (2.1%) |
| 5:00 AM to 5:29 AM | 0 (0.0%) | 0 (0.0%) |
| 5:30 AM to 5:59 AM | 38 (7.7%) | 11 (2.4%) |
| 6:00 AM to 6:29 AM | 47 (9.5%) | 85 (18.2%) |
| 6:30 AM to 6:59 AM | 20 (4.0%) | 98 (21.0%) |
| 7:00 AM to 7:29 AM | 97 (19.6%) | 43 (9.2%) |
| 7:30 AM to 7:59 AM | 62 (12.5%) | 84 (18.0%) |
| 8:00 AM to 8:29 AM | 40 (8.1%) | 38 (8.2%) |
| 8:30 AM to 8:59 AM | 74 (14.9%) | 0 (0.0%) |
| 9:00 AM to 9:59 AM | 0 (0.0%) | 60 (12.9%) |
| 10:00 AM to 10:59 AM | 0 (0.0%) | 37 (7.9%) |
| 11:00 AM to 11:59 AM | 0 (0.0%) | 0 (0.0%) |
| 12:00 PM to 3:59 PM | 18 (3.6%) | 0 (0.0%) |
| 4:00 PM to 11:59 PM | 0 (0.0%) | 0 (0.0%) |
| Total | 496 (100.0%) | 466 (100.0%) |
Housing Occupancy in Mechanicsville
Occupancy by Ownership in Mechanicsville
Of the total 614 dwellings in Mechanicsville, owner-occupied units account for 418 (68.1%), while renter-occupied units make up 196 (31.9%).
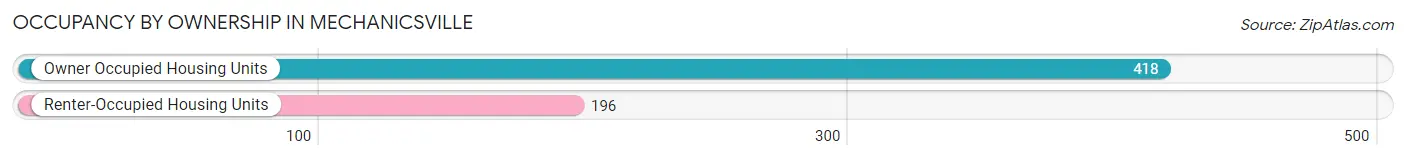
| Occupancy | # Housing Units | % Housing Units |
| Owner Occupied Housing Units | 418 | 68.1% |
| Renter-Occupied Housing Units | 196 | 31.9% |
| Total Occupied Housing Units | 614 | 100.0% |
Occupancy by Household Size in Mechanicsville
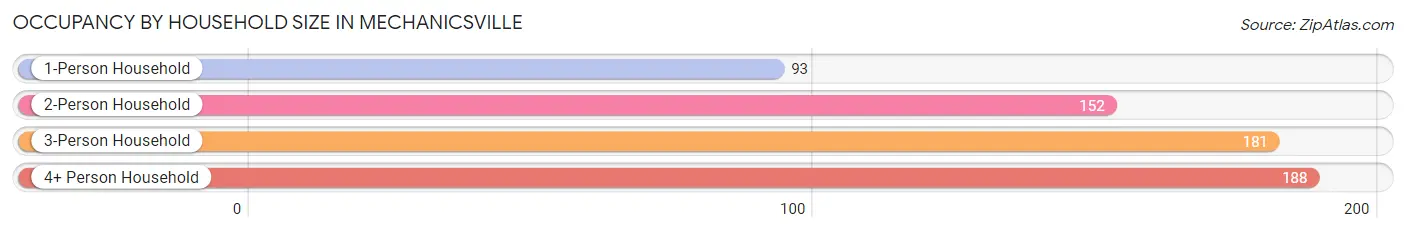
| Household Size | # Housing Units | % Housing Units |
| 1-Person Household | 93 | 15.1% |
| 2-Person Household | 152 | 24.8% |
| 3-Person Household | 181 | 29.5% |
| 4+ Person Household | 188 | 30.6% |
| Total Housing Units | 614 | 100.0% |
Occupancy by Ownership by Household Size in Mechanicsville
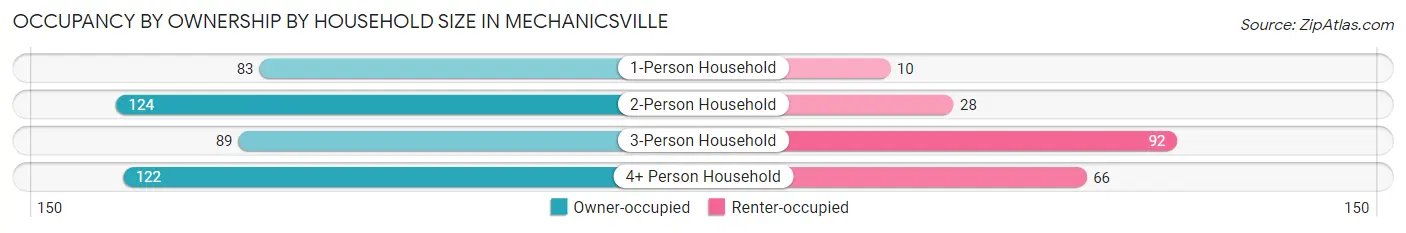
| Household Size | Owner-occupied | Renter-occupied |
| 1-Person Household | 83 (89.2%) | 10 (10.7%) |
| 2-Person Household | 124 (81.6%) | 28 (18.4%) |
| 3-Person Household | 89 (49.2%) | 92 (50.8%) |
| 4+ Person Household | 122 (64.9%) | 66 (35.1%) |
| Total Housing Units | 418 (68.1%) | 196 (31.9%) |
Occupancy by Educational Attainment in Mechanicsville
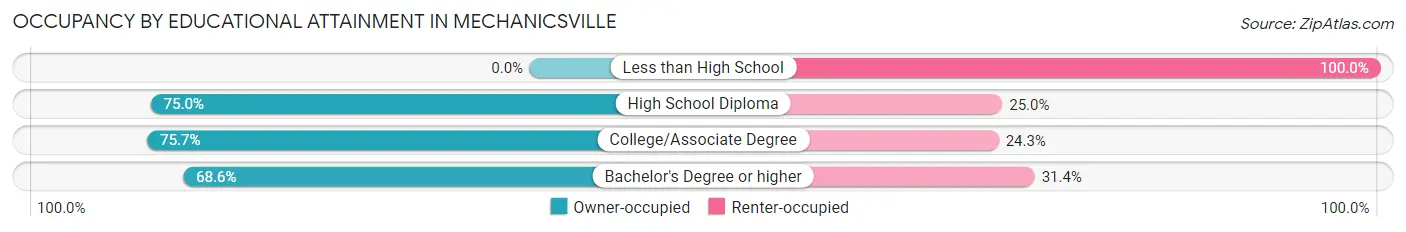
| Household Size | Owner-occupied | Renter-occupied |
| Less than High School | 0 (0.0%) | 40 (100.0%) |
| High School Diploma | 168 (75.0%) | 56 (25.0%) |
| College/Associate Degree | 106 (75.7%) | 34 (24.3%) |
| Bachelor's Degree or higher | 144 (68.6%) | 66 (31.4%) |
Occupancy by Age of Householder in Mechanicsville
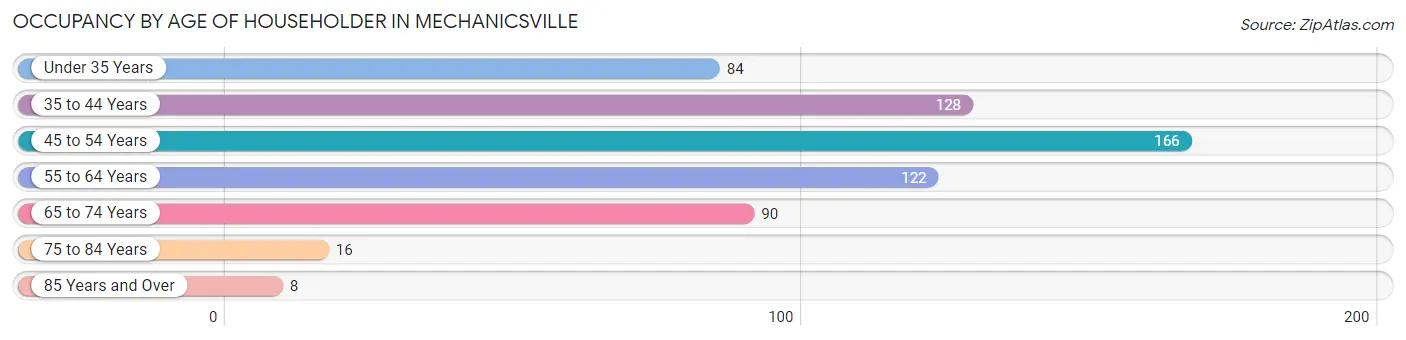
| Age Bracket | # Households | % Households |
| Under 35 Years | 84 | 13.7% |
| 35 to 44 Years | 128 | 20.8% |
| 45 to 54 Years | 166 | 27.0% |
| 55 to 64 Years | 122 | 19.9% |
| 65 to 74 Years | 90 | 14.7% |
| 75 to 84 Years | 16 | 2.6% |
| 85 Years and Over | 8 | 1.3% |
| Total | 614 | 100.0% |
Housing Finances in Mechanicsville
Median Income by Occupancy in Mechanicsville
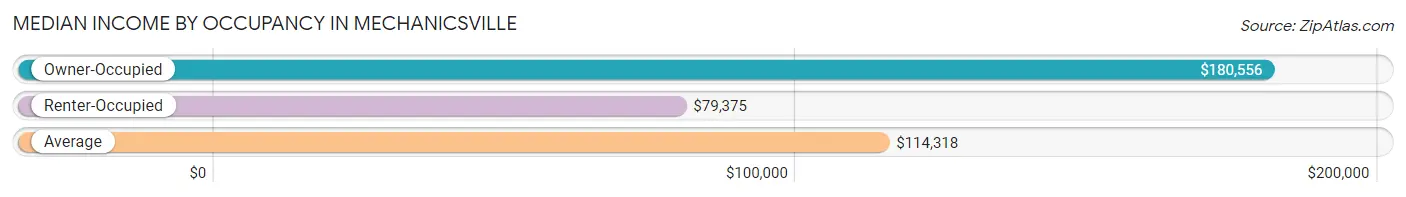
| Occupancy Type | # Households | Median Income |
| Owner-Occupied | 418 (68.1%) | $180,556 |
| Renter-Occupied | 196 (31.9%) | $79,375 |
| Average | 614 (100.0%) | $114,318 |
Occupancy by Householder Income Bracket in Mechanicsville
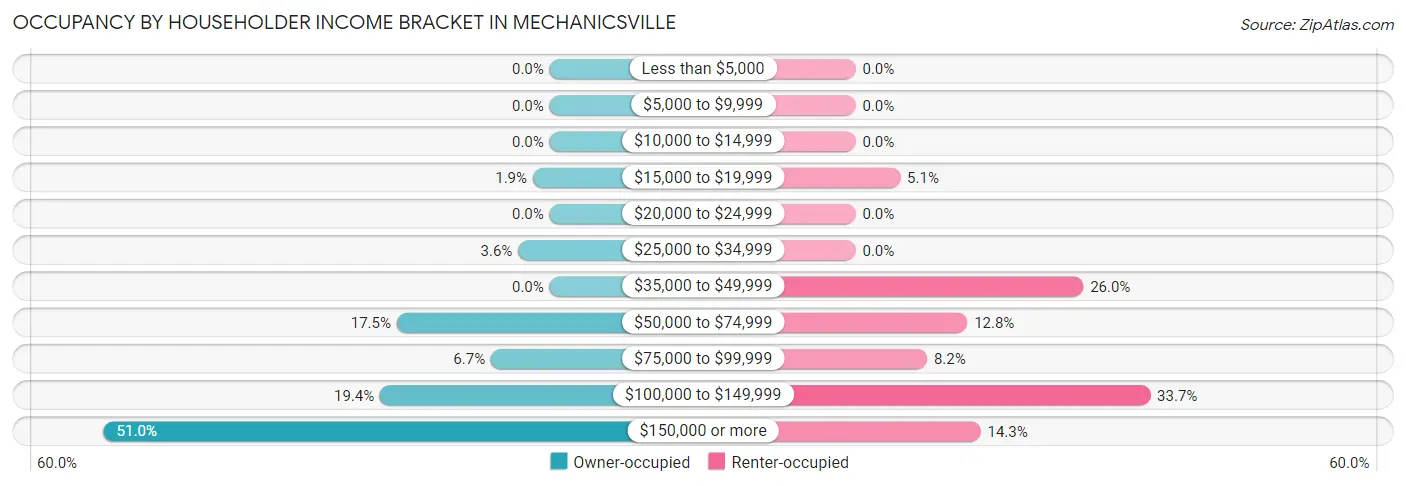
| Income Bracket | Owner-occupied | Renter-occupied |
| Less than $5,000 | 0 (0.0%) | 0 (0.0%) |
| $5,000 to $9,999 | 0 (0.0%) | 0 (0.0%) |
| $10,000 to $14,999 | 0 (0.0%) | 0 (0.0%) |
| $15,000 to $19,999 | 8 (1.9%) | 10 (5.1%) |
| $20,000 to $24,999 | 0 (0.0%) | 0 (0.0%) |
| $25,000 to $34,999 | 15 (3.6%) | 0 (0.0%) |
| $35,000 to $49,999 | 0 (0.0%) | 51 (26.0%) |
| $50,000 to $74,999 | 73 (17.5%) | 25 (12.8%) |
| $75,000 to $99,999 | 28 (6.7%) | 16 (8.2%) |
| $100,000 to $149,999 | 81 (19.4%) | 66 (33.7%) |
| $150,000 or more | 213 (51.0%) | 28 (14.3%) |
| Total | 418 (100.0%) | 196 (100.0%) |
Monthly Housing Cost Tiers in Mechanicsville
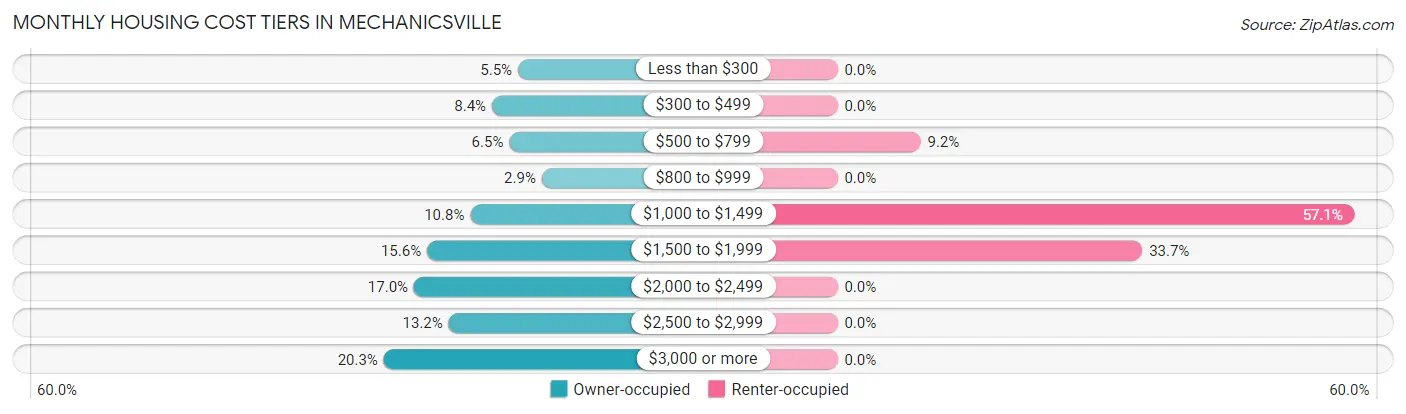
| Monthly Cost | Owner-occupied | Renter-occupied |
| Less than $300 | 23 (5.5%) | 0 (0.0%) |
| $300 to $499 | 35 (8.4%) | 0 (0.0%) |
| $500 to $799 | 27 (6.5%) | 18 (9.2%) |
| $800 to $999 | 12 (2.9%) | 0 (0.0%) |
| $1,000 to $1,499 | 45 (10.8%) | 112 (57.1%) |
| $1,500 to $1,999 | 65 (15.5%) | 66 (33.7%) |
| $2,000 to $2,499 | 71 (17.0%) | 0 (0.0%) |
| $2,500 to $2,999 | 55 (13.2%) | 0 (0.0%) |
| $3,000 or more | 85 (20.3%) | 0 (0.0%) |
| Total | 418 (100.0%) | 196 (100.0%) |
Physical Housing Characteristics in Mechanicsville
Housing Structures in Mechanicsville
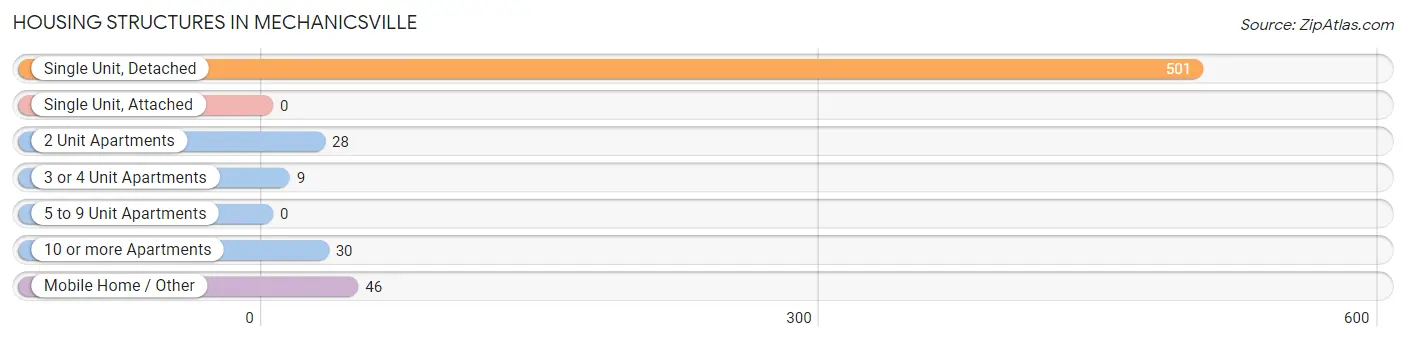
| Structure Type | # Housing Units | % Housing Units |
| Single Unit, Detached | 501 | 81.6% |
| Single Unit, Attached | 0 | 0.0% |
| 2 Unit Apartments | 28 | 4.6% |
| 3 or 4 Unit Apartments | 9 | 1.5% |
| 5 to 9 Unit Apartments | 0 | 0.0% |
| 10 or more Apartments | 30 | 4.9% |
| Mobile Home / Other | 46 | 7.5% |
| Total | 614 | 100.0% |
Housing Structures by Occupancy in Mechanicsville
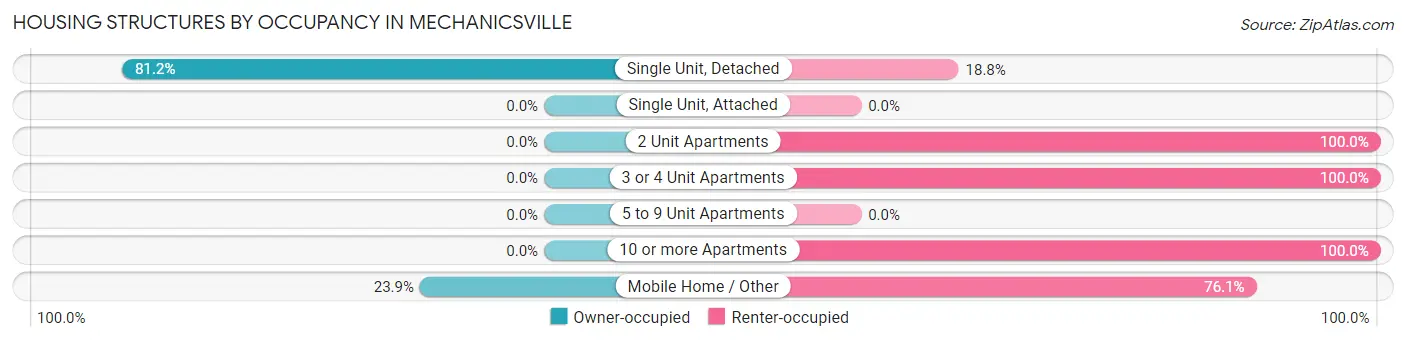
| Structure Type | Owner-occupied | Renter-occupied |
| Single Unit, Detached | 407 (81.2%) | 94 (18.8%) |
| Single Unit, Attached | 0 (0.0%) | 0 (0.0%) |
| 2 Unit Apartments | 0 (0.0%) | 28 (100.0%) |
| 3 or 4 Unit Apartments | 0 (0.0%) | 9 (100.0%) |
| 5 to 9 Unit Apartments | 0 (0.0%) | 0 (0.0%) |
| 10 or more Apartments | 0 (0.0%) | 30 (100.0%) |
| Mobile Home / Other | 11 (23.9%) | 35 (76.1%) |
| Total | 418 (68.1%) | 196 (31.9%) |
Housing Structures by Number of Rooms in Mechanicsville
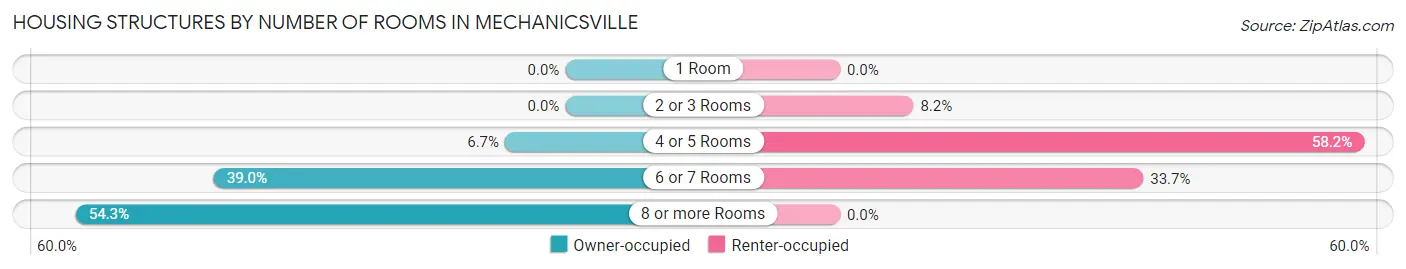
| Number of Rooms | Owner-occupied | Renter-occupied |
| 1 Room | 0 (0.0%) | 0 (0.0%) |
| 2 or 3 Rooms | 0 (0.0%) | 16 (8.2%) |
| 4 or 5 Rooms | 28 (6.7%) | 114 (58.2%) |
| 6 or 7 Rooms | 163 (39.0%) | 66 (33.7%) |
| 8 or more Rooms | 227 (54.3%) | 0 (0.0%) |
| Total | 418 (100.0%) | 196 (100.0%) |
Housing Structure by Heating Type in Mechanicsville
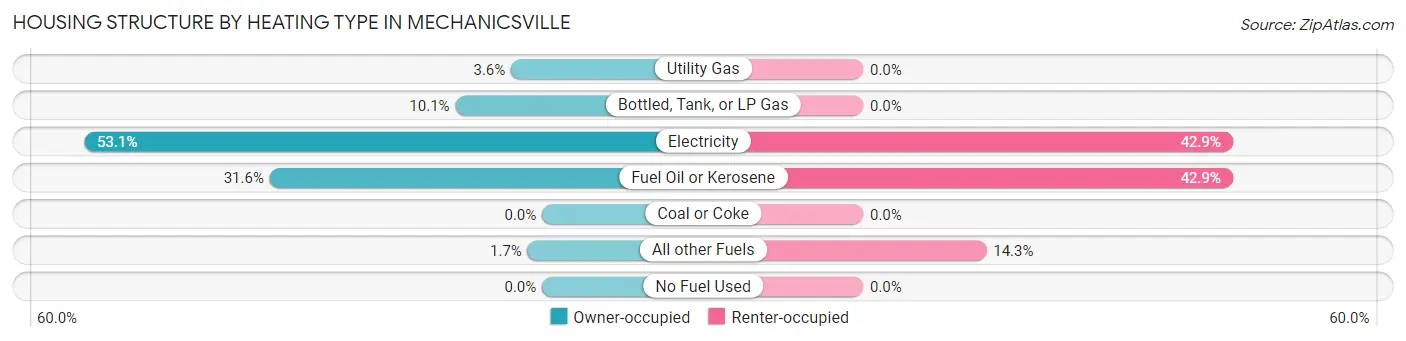
| Heating Type | Owner-occupied | Renter-occupied |
| Utility Gas | 15 (3.6%) | 0 (0.0%) |
| Bottled, Tank, or LP Gas | 42 (10.1%) | 0 (0.0%) |
| Electricity | 222 (53.1%) | 84 (42.9%) |
| Fuel Oil or Kerosene | 132 (31.6%) | 84 (42.9%) |
| Coal or Coke | 0 (0.0%) | 0 (0.0%) |
| All other Fuels | 7 (1.7%) | 28 (14.3%) |
| No Fuel Used | 0 (0.0%) | 0 (0.0%) |
| Total | 418 (100.0%) | 196 (100.0%) |
Household Vehicle Usage in Mechanicsville
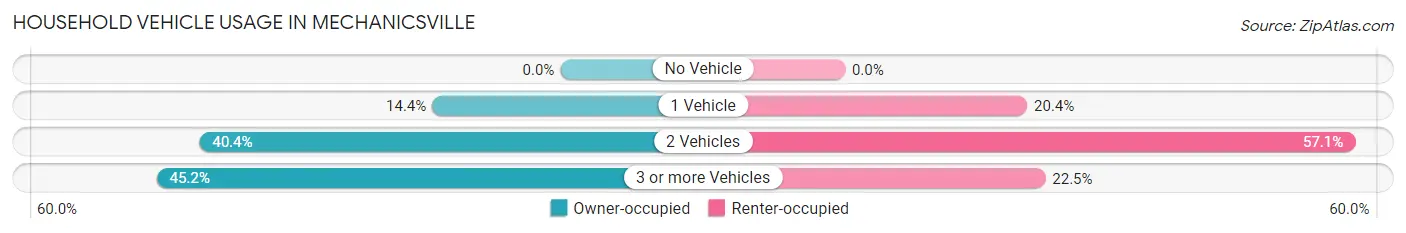
| Vehicles per Household | Owner-occupied | Renter-occupied |
| No Vehicle | 0 (0.0%) | 0 (0.0%) |
| 1 Vehicle | 60 (14.3%) | 40 (20.4%) |
| 2 Vehicles | 169 (40.4%) | 112 (57.1%) |
| 3 or more Vehicles | 189 (45.2%) | 44 (22.5%) |
| Total | 418 (100.0%) | 196 (100.0%) |
Real Estate & Mortgages in Mechanicsville
Real Estate and Mortgage Overview in Mechanicsville
| Characteristic | Without Mortgage | With Mortgage |
| Housing Units | 108 | 310 |
| Median Property Value | $360,300 | $428,600 |
| Median Household Income | $72,946 | $201 |
| Monthly Housing Costs | $486 | $74 |
| Real Estate Taxes | $3,085 | $0 |
Property Value by Mortgage Status in Mechanicsville
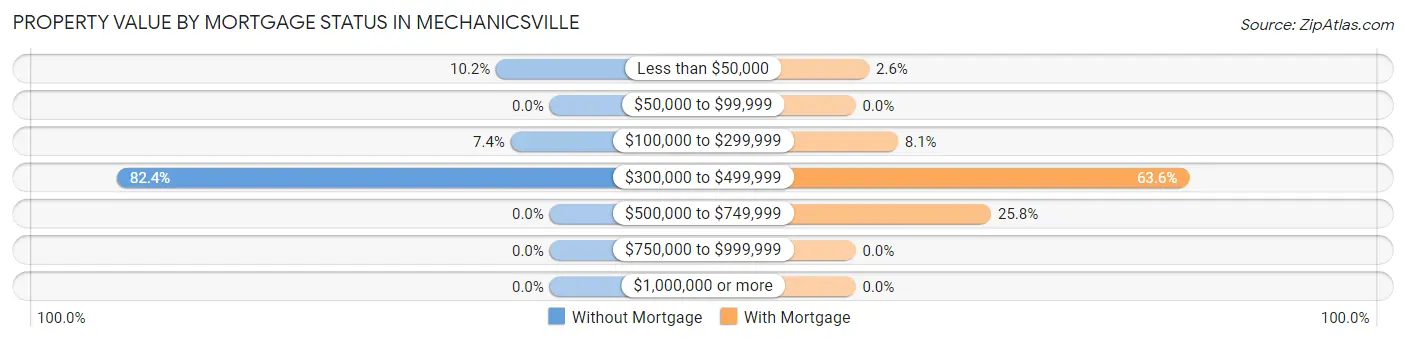
| Property Value | Without Mortgage | With Mortgage |
| Less than $50,000 | 11 (10.2%) | 8 (2.6%) |
| $50,000 to $99,999 | 0 (0.0%) | 0 (0.0%) |
| $100,000 to $299,999 | 8 (7.4%) | 25 (8.1%) |
| $300,000 to $499,999 | 89 (82.4%) | 197 (63.5%) |
| $500,000 to $749,999 | 0 (0.0%) | 80 (25.8%) |
| $750,000 to $999,999 | 0 (0.0%) | 0 (0.0%) |
| $1,000,000 or more | 0 (0.0%) | 0 (0.0%) |
| Total | 108 (100.0%) | 310 (100.0%) |
Household Income by Mortgage Status in Mechanicsville
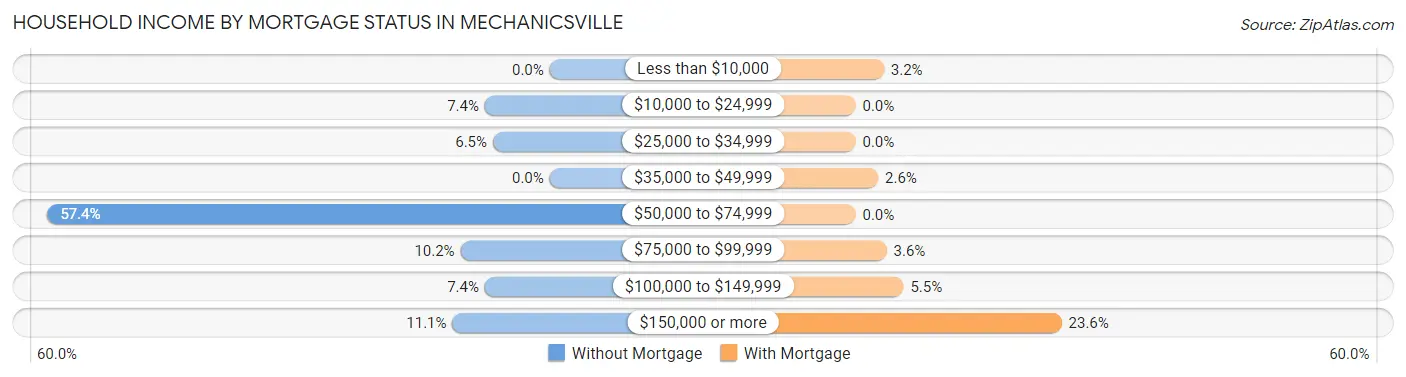
| Household Income | Without Mortgage | With Mortgage |
| Less than $10,000 | 0 (0.0%) | 10 (3.2%) |
| $10,000 to $24,999 | 8 (7.4%) | 0 (0.0%) |
| $25,000 to $34,999 | 7 (6.5%) | 0 (0.0%) |
| $35,000 to $49,999 | 0 (0.0%) | 8 (2.6%) |
| $50,000 to $74,999 | 62 (57.4%) | 0 (0.0%) |
| $75,000 to $99,999 | 11 (10.2%) | 11 (3.5%) |
| $100,000 to $149,999 | 8 (7.4%) | 17 (5.5%) |
| $150,000 or more | 12 (11.1%) | 73 (23.5%) |
| Total | 108 (100.0%) | 310 (100.0%) |
Property Value to Household Income Ratio in Mechanicsville
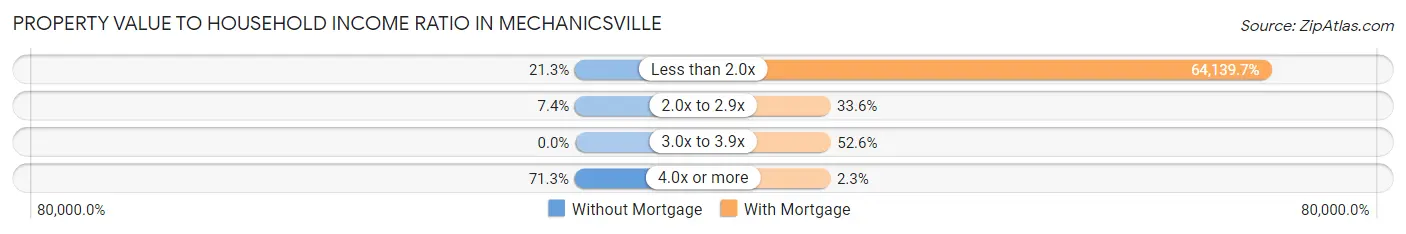
| Value-to-Income Ratio | Without Mortgage | With Mortgage |
| Less than 2.0x | 23 (21.3%) | 198,833 (64,139.7%) |
| 2.0x to 2.9x | 8 (7.4%) | 104 (33.6%) |
| 3.0x to 3.9x | 0 (0.0%) | 163 (52.6%) |
| 4.0x or more | 77 (71.3%) | 7 (2.3%) |
| Total | 108 (100.0%) | 310 (100.0%) |
Real Estate Taxes by Mortgage Status in Mechanicsville
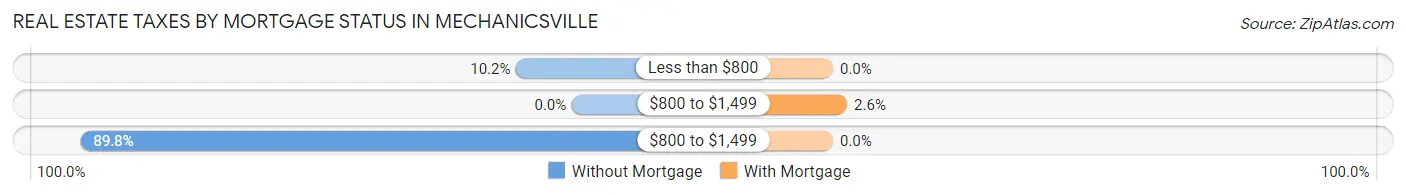
| Property Taxes | Without Mortgage | With Mortgage |
| Less than $800 | 11 (10.2%) | 0 (0.0%) |
| $800 to $1,499 | 0 (0.0%) | 8 (2.6%) |
| $800 to $1,499 | 97 (89.8%) | 0 (0.0%) |
| Total | 108 (100.0%) | 310 (100.0%) |
Health & Disability in Mechanicsville
Health Insurance Coverage by Age in Mechanicsville
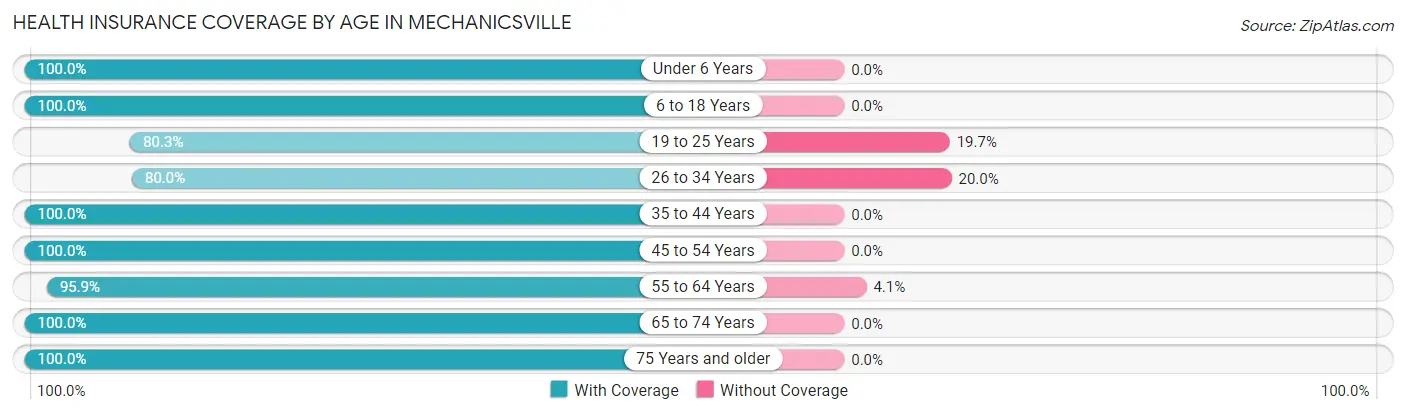
| Age Bracket | With Coverage | Without Coverage |
| Under 6 Years | 58 (100.0%) | 0 (0.0%) |
| 6 to 18 Years | 439 (100.0%) | 0 (0.0%) |
| 19 to 25 Years | 143 (80.3%) | 35 (19.7%) |
| 26 to 34 Years | 64 (80.0%) | 16 (20.0%) |
| 35 to 44 Years | 180 (100.0%) | 0 (0.0%) |
| 45 to 54 Years | 351 (100.0%) | 0 (0.0%) |
| 55 to 64 Years | 232 (95.9%) | 10 (4.1%) |
| 65 to 74 Years | 165 (100.0%) | 0 (0.0%) |
| 75 Years and older | 24 (100.0%) | 0 (0.0%) |
| Total | 1,656 (96.5%) | 61 (3.5%) |
Health Insurance Coverage by Citizenship Status in Mechanicsville
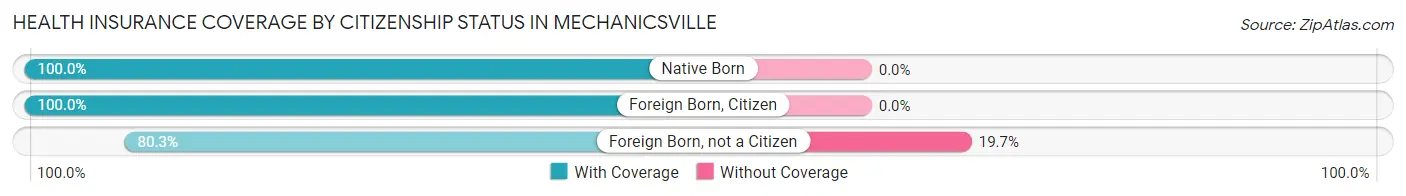
| Citizenship Status | With Coverage | Without Coverage |
| Native Born | 58 (100.0%) | 0 (0.0%) |
| Foreign Born, Citizen | 439 (100.0%) | 0 (0.0%) |
| Foreign Born, not a Citizen | 143 (80.3%) | 35 (19.7%) |
Health Insurance Coverage by Household Income in Mechanicsville
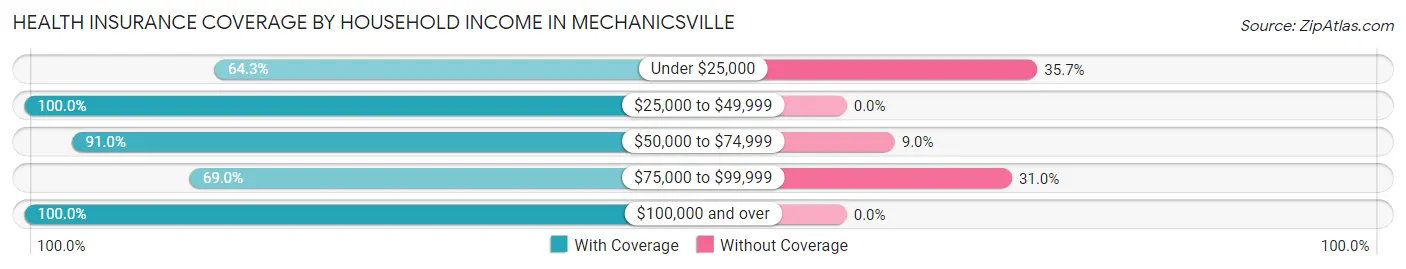
| Household Income | With Coverage | Without Coverage |
| Under $25,000 | 18 (64.3%) | 10 (35.7%) |
| $25,000 to $49,999 | 189 (100.0%) | 0 (0.0%) |
| $50,000 to $74,999 | 162 (91.0%) | 16 (9.0%) |
| $75,000 to $99,999 | 78 (69.0%) | 35 (31.0%) |
| $100,000 and over | 1,209 (100.0%) | 0 (0.0%) |
Public vs Private Health Insurance Coverage by Age in Mechanicsville
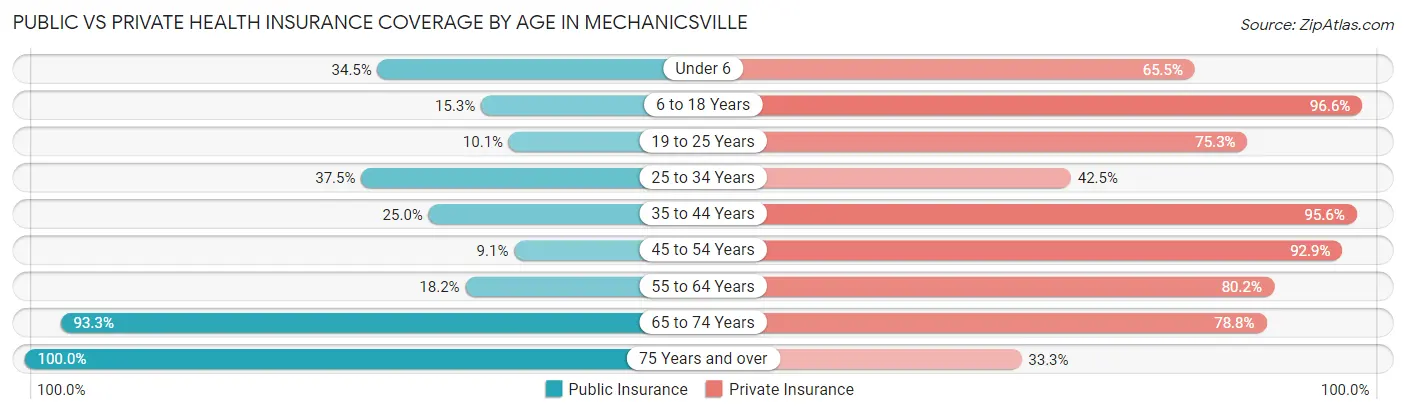
| Age Bracket | Public Insurance | Private Insurance |
| Under 6 | 20 (34.5%) | 38 (65.5%) |
| 6 to 18 Years | 67 (15.3%) | 424 (96.6%) |
| 19 to 25 Years | 18 (10.1%) | 134 (75.3%) |
| 25 to 34 Years | 30 (37.5%) | 34 (42.5%) |
| 35 to 44 Years | 45 (25.0%) | 172 (95.6%) |
| 45 to 54 Years | 32 (9.1%) | 326 (92.9%) |
| 55 to 64 Years | 44 (18.2%) | 194 (80.2%) |
| 65 to 74 Years | 154 (93.3%) | 130 (78.8%) |
| 75 Years and over | 24 (100.0%) | 8 (33.3%) |
| Total | 434 (25.3%) | 1,460 (85.0%) |
Disability Status by Sex by Age in Mechanicsville
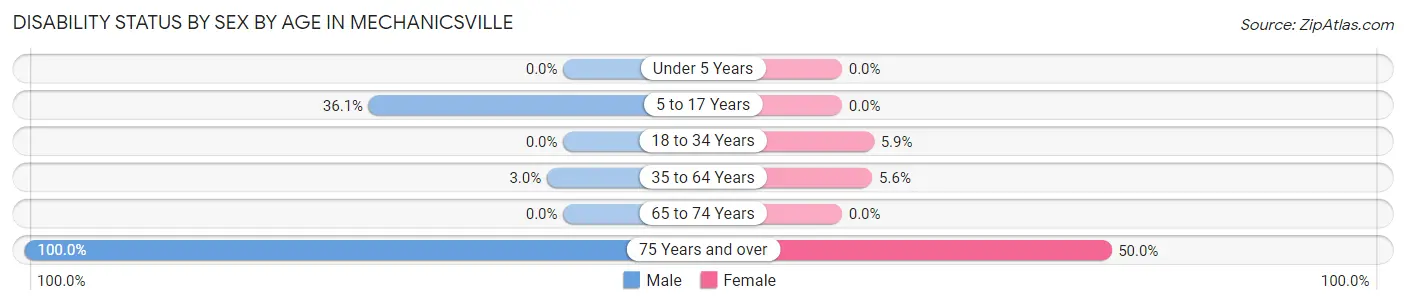
| Age Bracket | Male | Female |
| Under 5 Years | 0 (0.0%) | 0 (0.0%) |
| 5 to 17 Years | 96 (36.1%) | 0 (0.0%) |
| 18 to 34 Years | 0 (0.0%) | 9 (5.9%) |
| 35 to 64 Years | 10 (3.0%) | 25 (5.6%) |
| 65 to 74 Years | 0 (0.0%) | 0 (0.0%) |
| 75 Years and over | 8 (100.0%) | 8 (50.0%) |
Disability Class by Sex by Age in Mechanicsville
Disability Class: Hearing Difficulty
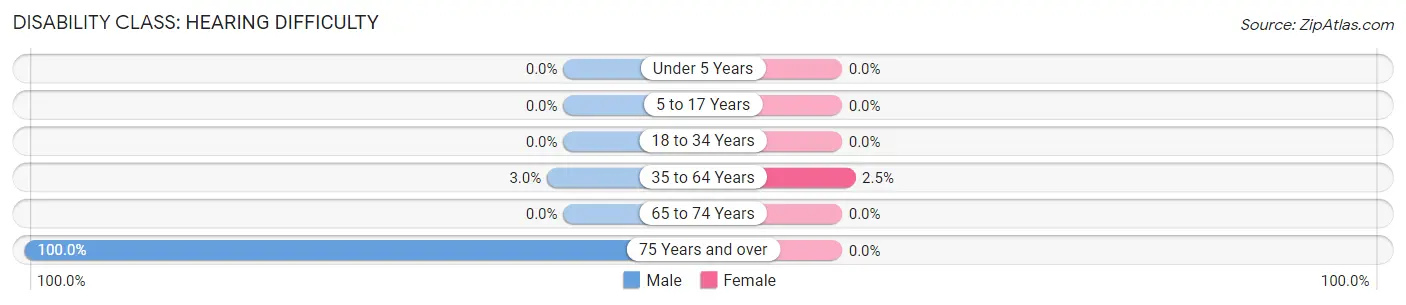
| Age Bracket | Male | Female |
| Under 5 Years | 0 (0.0%) | 0 (0.0%) |
| 5 to 17 Years | 0 (0.0%) | 0 (0.0%) |
| 18 to 34 Years | 0 (0.0%) | 0 (0.0%) |
| 35 to 64 Years | 10 (3.0%) | 11 (2.5%) |
| 65 to 74 Years | 0 (0.0%) | 0 (0.0%) |
| 75 Years and over | 8 (100.0%) | 0 (0.0%) |
Disability Class: Vision Difficulty
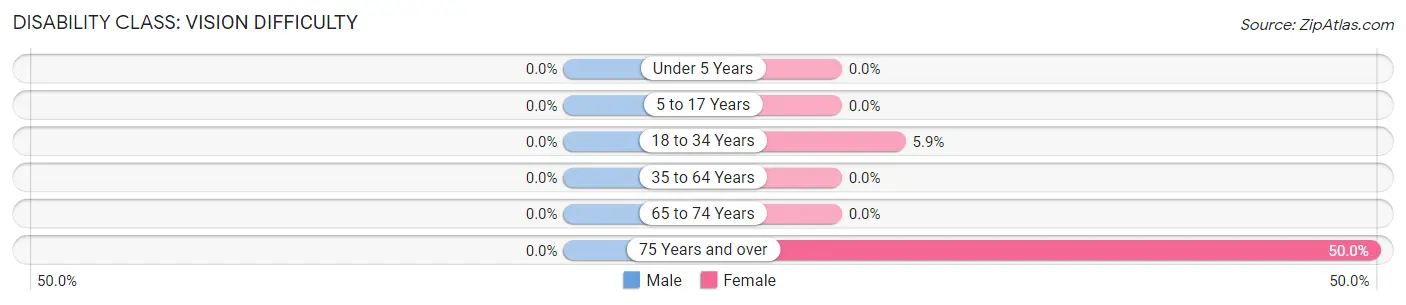
| Age Bracket | Male | Female |
| Under 5 Years | 0 (0.0%) | 0 (0.0%) |
| 5 to 17 Years | 0 (0.0%) | 0 (0.0%) |
| 18 to 34 Years | 0 (0.0%) | 9 (5.9%) |
| 35 to 64 Years | 0 (0.0%) | 0 (0.0%) |
| 65 to 74 Years | 0 (0.0%) | 0 (0.0%) |
| 75 Years and over | 0 (0.0%) | 8 (50.0%) |
Disability Class: Cognitive Difficulty
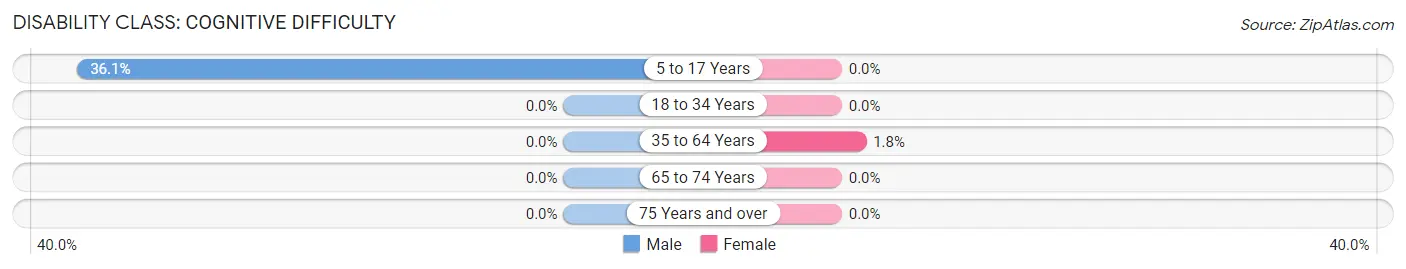
| Age Bracket | Male | Female |
| 5 to 17 Years | 96 (36.1%) | 0 (0.0%) |
| 18 to 34 Years | 0 (0.0%) | 0 (0.0%) |
| 35 to 64 Years | 0 (0.0%) | 8 (1.8%) |
| 65 to 74 Years | 0 (0.0%) | 0 (0.0%) |
| 75 Years and over | 0 (0.0%) | 0 (0.0%) |
Disability Class: Ambulatory Difficulty
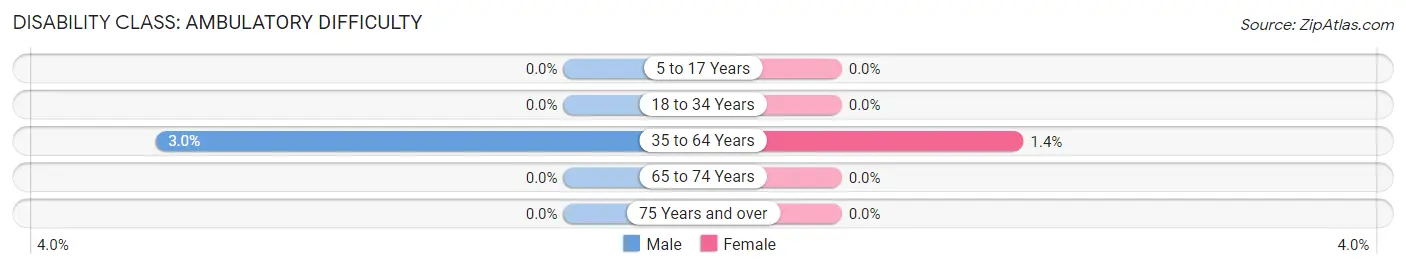
| Age Bracket | Male | Female |
| 5 to 17 Years | 0 (0.0%) | 0 (0.0%) |
| 18 to 34 Years | 0 (0.0%) | 0 (0.0%) |
| 35 to 64 Years | 10 (3.0%) | 6 (1.3%) |
| 65 to 74 Years | 0 (0.0%) | 0 (0.0%) |
| 75 Years and over | 0 (0.0%) | 0 (0.0%) |
Disability Class: Self-Care Difficulty
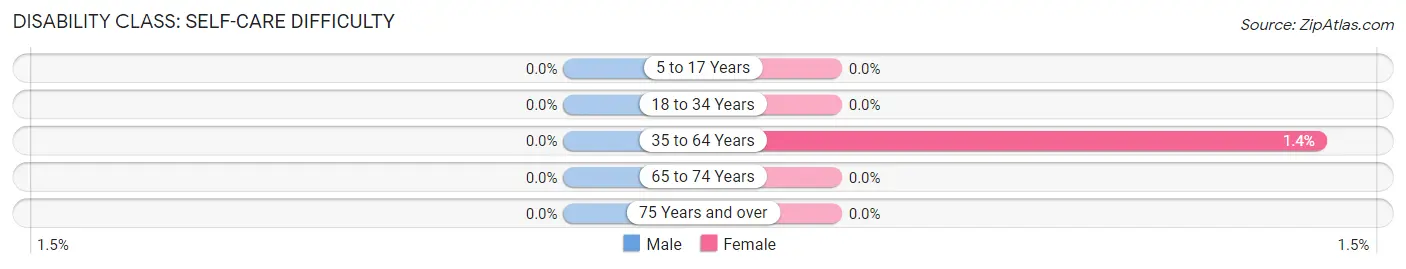
| Age Bracket | Male | Female |
| 5 to 17 Years | 0 (0.0%) | 0 (0.0%) |
| 18 to 34 Years | 0 (0.0%) | 0 (0.0%) |
| 35 to 64 Years | 0 (0.0%) | 6 (1.3%) |
| 65 to 74 Years | 0 (0.0%) | 0 (0.0%) |
| 75 Years and over | 0 (0.0%) | 0 (0.0%) |
Technology Access in Mechanicsville
Computing Device Access in Mechanicsville
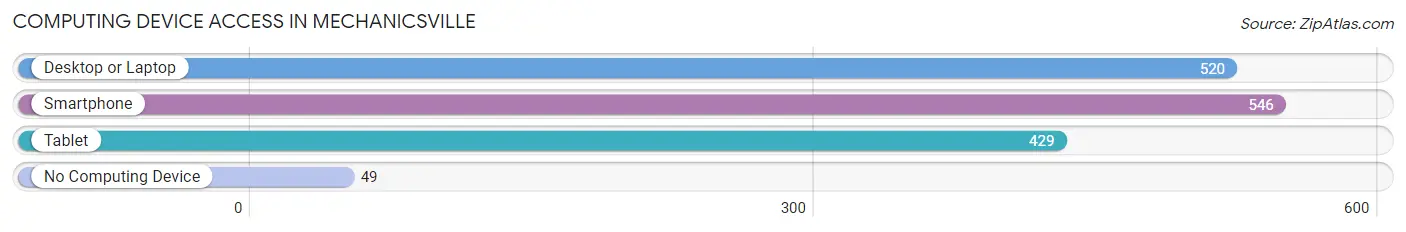
| Device Type | # Households | % Households |
| Desktop or Laptop | 520 | 84.7% |
| Smartphone | 546 | 88.9% |
| Tablet | 429 | 69.9% |
| No Computing Device | 49 | 8.0% |
| Total | 614 | 100.0% |
Internet Access in Mechanicsville
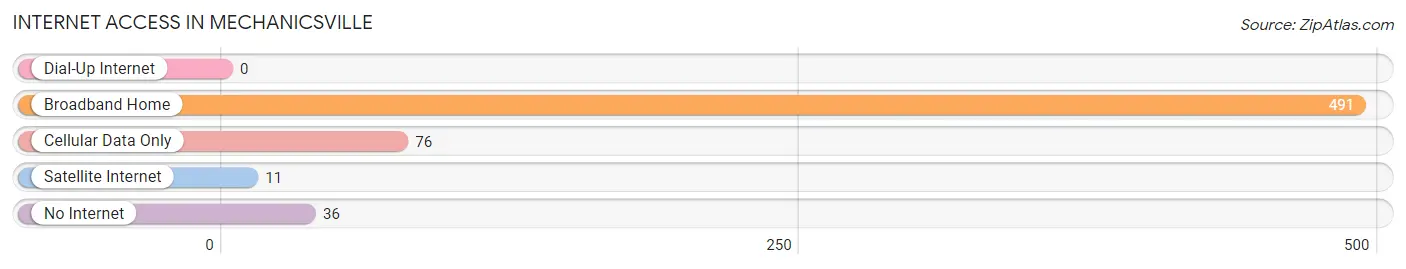
| Internet Type | # Households | % Households |
| Dial-Up Internet | 0 | 0.0% |
| Broadband Home | 491 | 80.0% |
| Cellular Data Only | 76 | 12.4% |
| Satellite Internet | 11 | 1.8% |
| No Internet | 36 | 5.9% |
| Total | 614 | 100.0% |
Mechanicsville Summary
Mechanicsville is a small unincorporated community located in St. Mary’s County, Maryland. It is situated on the western shore of the Chesapeake Bay, approximately 25 miles south of Washington, D.C. The community is home to a population of approximately 1,500 people, and is known for its rural charm and close-knit community.
History
The area that is now Mechanicsville was first settled in the early 1700s by English colonists. The community was originally known as “Mechanicsville” due to the presence of a number of mechanics and artisans who lived and worked in the area. The community was officially established in 1812, and was incorporated as a town in 1820.
In the late 1800s, Mechanicsville experienced a period of growth and prosperity. The town was home to a number of businesses, including a sawmill, a gristmill, a blacksmith shop, and a general store. The town also had a post office, a school, and a church.
In the early 1900s, the town began to decline as the population shifted to larger cities. By the mid-1900s, the town had become a quiet, rural community.
Geography
Mechanicsville is located in St. Mary’s County, Maryland. It is situated on the western shore of the Chesapeake Bay, approximately 25 miles south of Washington, D.C. The town is bordered by the Patuxent River to the north, and the Wicomico River to the south.
The town is located in a rural area, and is surrounded by farmland and woodlands. The town is home to a number of parks and recreational areas, including the Mechanicsville Wildlife Management Area and the Mechanicsville State Park.
Economy
The economy of Mechanicsville is largely based on agriculture and tourism. The town is home to a number of farms, which produce a variety of crops, including corn, soybeans, and wheat. The town is also home to a number of tourist attractions, including the Mechanicsville State Park and the Patuxent River Naval Air Station.
Demographics
As of the 2010 census, the population of Mechanicsville was 1,500. The racial makeup of the town was 94.7% White, 2.7% African American, 0.7% Native American, 0.3% Asian, and 1.6% from other races. The median household income was $50,000, and the median home value was $170,000.
Conclusion
Mechanicsville is a small unincorporated community located in St. Mary’s County, Maryland. It is situated on the western shore of the Chesapeake Bay, approximately 25 miles south of Washington, D.C. The community is home to a population of approximately 1,500 people, and is known for its rural charm and close-knit community. The economy of Mechanicsville is largely based on agriculture and tourism, and the town is home to a number of farms and tourist attractions. The racial makeup of the town is predominantly White, with a small percentage of African American, Native American, and Asian residents.
Common Questions
What is Per Capita Income in Mechanicsville?
Per Capita income in Mechanicsville is $56,387.
What is the Median Family Income in Mechanicsville?
Median Family Income in Mechanicsville is $129,000.
What is the Median Household income in Mechanicsville?
Median Household Income in Mechanicsville is $114,318.
What is Income or Wage Gap in Mechanicsville?
Income or Wage Gap in Mechanicsville is 50.5%.
Women in Mechanicsville earn 49.5 cents for every dollar earned by a man.
What is Inequality or Gini Index in Mechanicsville?
Inequality or Gini Index in Mechanicsville is 0.42.
What is the Total Population of Mechanicsville?
Total Population of Mechanicsville is 1,783.
What is the Total Male Population of Mechanicsville?
Total Male Population of Mechanicsville is 878.
What is the Total Female Population of Mechanicsville?
Total Female Population of Mechanicsville is 905.
What is the Ratio of Males per 100 Females in Mechanicsville?
There are 97.02 Males per 100 Females in Mechanicsville.
What is the Ratio of Females per 100 Males in Mechanicsville?
There are 103.08 Females per 100 Males in Mechanicsville.
What is the Median Population Age in Mechanicsville?
Median Population Age in Mechanicsville is 41.4 Years.
What is the Average Family Size in Mechanicsville
Average Family Size in Mechanicsville is 3.2 People.
What is the Average Household Size in Mechanicsville
Average Household Size in Mechanicsville is 2.9 People.
How Large is the Labor Force in Mechanicsville?
There are 1,050 People in the Labor Forcein in Mechanicsville.
What is the Percentage of People in the Labor Force in Mechanicsville?
80.3% of People are in the Labor Force in Mechanicsville.
What is the Unemployment Rate in Mechanicsville?
Unemployment Rate in Mechanicsville is 3.9%.