Eden, MD Map & Demographics
Eden Map
Eden Overview
$16,555
PER CAPITA INCOME
$19,340
AVG FAMILY INCOME
$28,808
AVG HOUSEHOLD INCOME
0.44
INEQUALITY / GINI INDEX
1,008
TOTAL POPULATION
513
MALE POPULATION
495
FEMALE POPULATION
103.64
MALES / 100 FEMALES
96.49
FEMALES / 100 MALES
29.2
MEDIAN AGE
3.2
AVG FAMILY SIZE
2.6
AVG HOUSEHOLD SIZE
368
LABOR FORCE [ PEOPLE ]
60.3%
PERCENT IN LABOR FORCE
10.3%
UNEMPLOYMENT RATE
Eden Zip Codes
Income in Eden
Income Overview in Eden
Per Capita Income in Eden is $16,555, while median incomes of families and households are $19,340 and $28,808 respectively.
| Characteristic | Number | Measure |
| Per Capita Income | 1,008 | $16,555 |
| Median Family Income | 243 | $19,340 |
| Mean Family Income | 243 | $39,863 |
| Median Household Income | 389 | $28,808 |
| Mean Household Income | 389 | $40,567 |
| Income Deficit | 243 | $0 |
| Wage / Income Gap (%) | 1,008 | 0.00% |
| Wage / Income Gap ($) | 1,008 | 100.00¢ per $1 |
| Gini / Inequality Index | 1,008 | 0.44 |
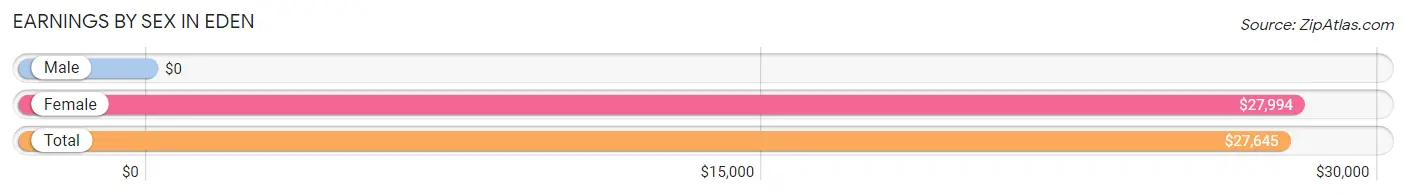
Earnings by Sex in Eden
| Sex | Number | Average Earnings |
| Male | 202 (54.7%) | $0 |
| Female | 167 (45.3%) | $27,994 |
| Total | 369 (100.0%) | $27,645 |
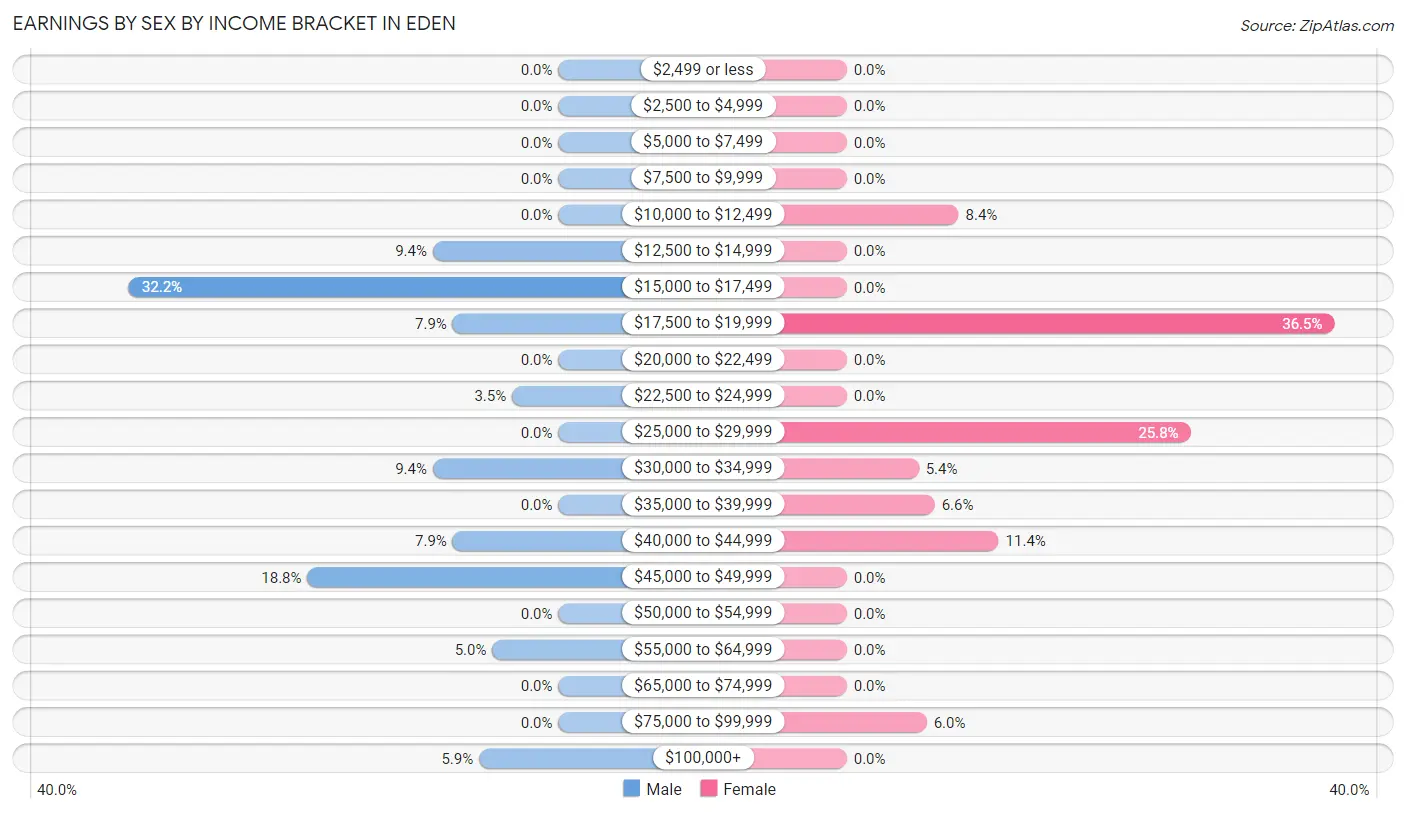
Earnings by Sex by Income Bracket in Eden
The most common earnings brackets in Eden are $15,000 to $17,499 for men (65 | 32.2%) and $17,500 to $19,999 for women (61 | 36.5%).
| Income | Male | Female |
| $2,499 or less | 0 (0.0%) | 0 (0.0%) |
| $2,500 to $4,999 | 0 (0.0%) | 0 (0.0%) |
| $5,000 to $7,499 | 0 (0.0%) | 0 (0.0%) |
| $7,500 to $9,999 | 0 (0.0%) | 0 (0.0%) |
| $10,000 to $12,499 | 0 (0.0%) | 14 (8.4%) |
| $12,500 to $14,999 | 19 (9.4%) | 0 (0.0%) |
| $15,000 to $17,499 | 65 (32.2%) | 0 (0.0%) |
| $17,500 to $19,999 | 16 (7.9%) | 61 (36.5%) |
| $20,000 to $22,499 | 0 (0.0%) | 0 (0.0%) |
| $22,500 to $24,999 | 7 (3.5%) | 0 (0.0%) |
| $25,000 to $29,999 | 0 (0.0%) | 43 (25.8%) |
| $30,000 to $34,999 | 19 (9.4%) | 9 (5.4%) |
| $35,000 to $39,999 | 0 (0.0%) | 11 (6.6%) |
| $40,000 to $44,999 | 16 (7.9%) | 19 (11.4%) |
| $45,000 to $49,999 | 38 (18.8%) | 0 (0.0%) |
| $50,000 to $54,999 | 0 (0.0%) | 0 (0.0%) |
| $55,000 to $64,999 | 10 (5.0%) | 0 (0.0%) |
| $65,000 to $74,999 | 0 (0.0%) | 0 (0.0%) |
| $75,000 to $99,999 | 0 (0.0%) | 10 (6.0%) |
| $100,000+ | 12 (5.9%) | 0 (0.0%) |
| Total | 202 (100.0%) | 167 (100.0%) |
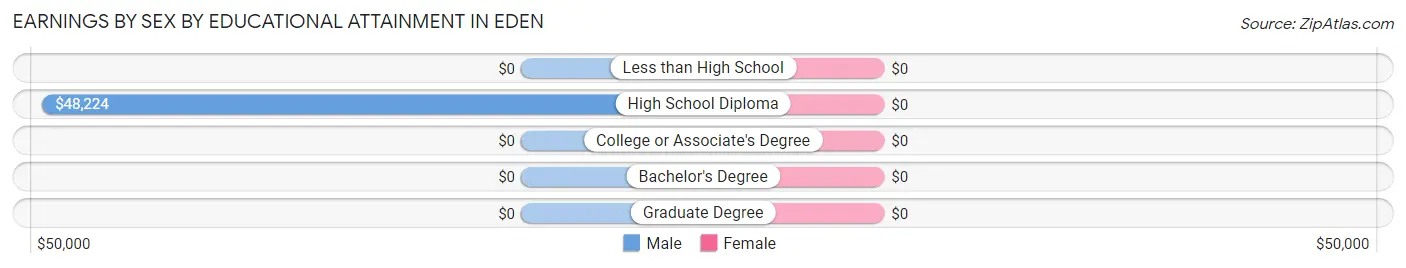
Earnings by Sex by Educational Attainment in Eden
| Educational Attainment | Male Income | Female Income |
| Less than High School | - | - |
| High School Diploma | $48,224 | $0 |
| College or Associate's Degree | - | - |
| Bachelor's Degree | - | - |
| Graduate Degree | - | - |
| Total | - | - |
Family Income in Eden
Family Income Brackets in Eden
According to the Eden family income data, there are 101 families falling into the $15,000 to $24,999 income range, which is the most common income bracket and makes up 41.6% of all families.
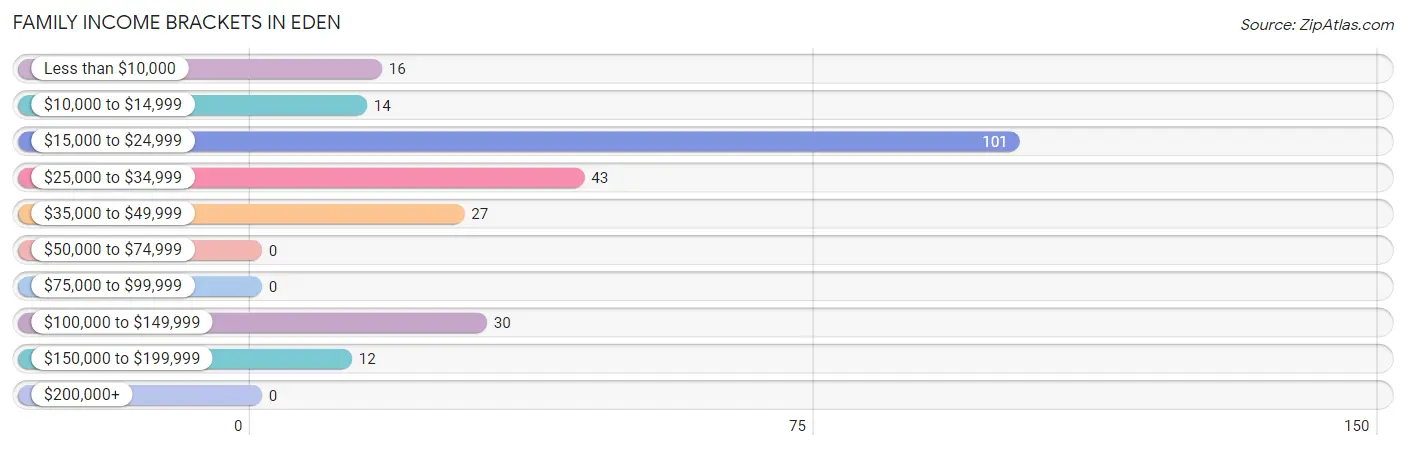
| Income Bracket | # Families | % Families |
| Less than $10,000 | 16 | 6.6% |
| $10,000 to $14,999 | 14 | 5.8% |
| $15,000 to $24,999 | 101 | 41.6% |
| $25,000 to $34,999 | 43 | 17.7% |
| $35,000 to $49,999 | 27 | 11.1% |
| $50,000 to $74,999 | 0 | 0.0% |
| $75,000 to $99,999 | 0 | 0.0% |
| $100,000 to $149,999 | 30 | 12.3% |
| $150,000 to $199,999 | 12 | 4.9% |
| $200,000+ | 0 | 0.0% |
Family Income by Famaliy Size in Eden
3-person families (75 | 30.9%) account for the highest median family income in Eden with $28,750 per family, while 3-person families (75 | 30.9%) have the highest median income of $9,583 per family member.
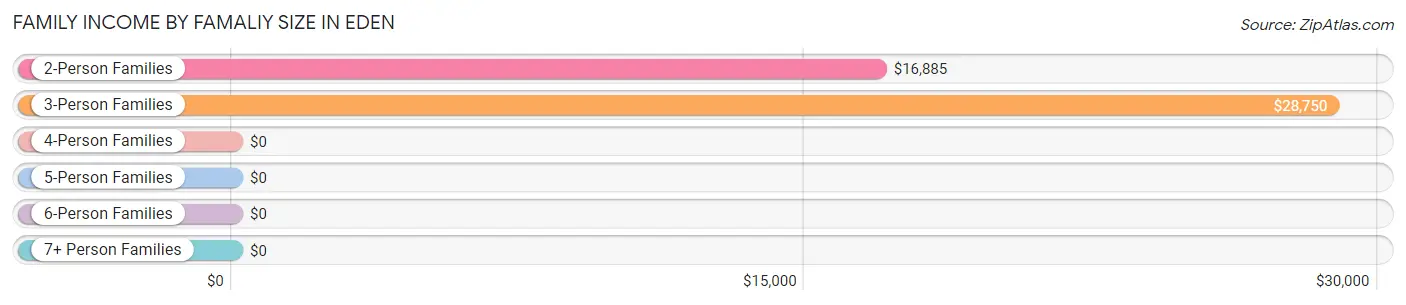
| Income Bracket | # Families | Median Income |
| 2-Person Families | 126 (51.8%) | $16,885 |
| 3-Person Families | 75 (30.9%) | $28,750 |
| 4-Person Families | 23 (9.5%) | $0 |
| 5-Person Families | 19 (7.8%) | $0 |
| 6-Person Families | 0 (0.0%) | $0 |
| 7+ Person Families | 0 (0.0%) | $0 |
| Total | 243 (100.0%) | $19,340 |
Family Income by Number of Earners in Eden
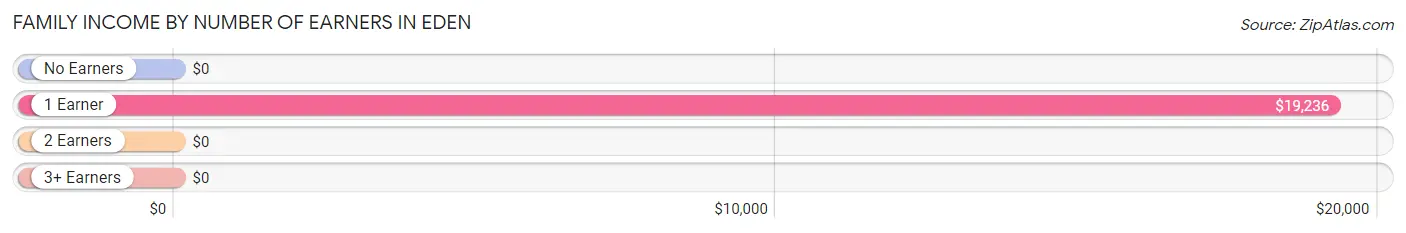
| Number of Earners | # Families | Median Income |
| No Earners | 16 (6.6%) | $0 |
| 1 Earner | 208 (85.6%) | $19,236 |
| 2 Earners | 19 (7.8%) | $0 |
| 3+ Earners | 0 (0.0%) | $0 |
| Total | 243 (100.0%) | $19,340 |
Household Income in Eden
Household Income Brackets in Eden
With 115 households falling in the category, the $15,000 to $24,999 income range is the most frequent in Eden, accounting for 29.6% of all households.
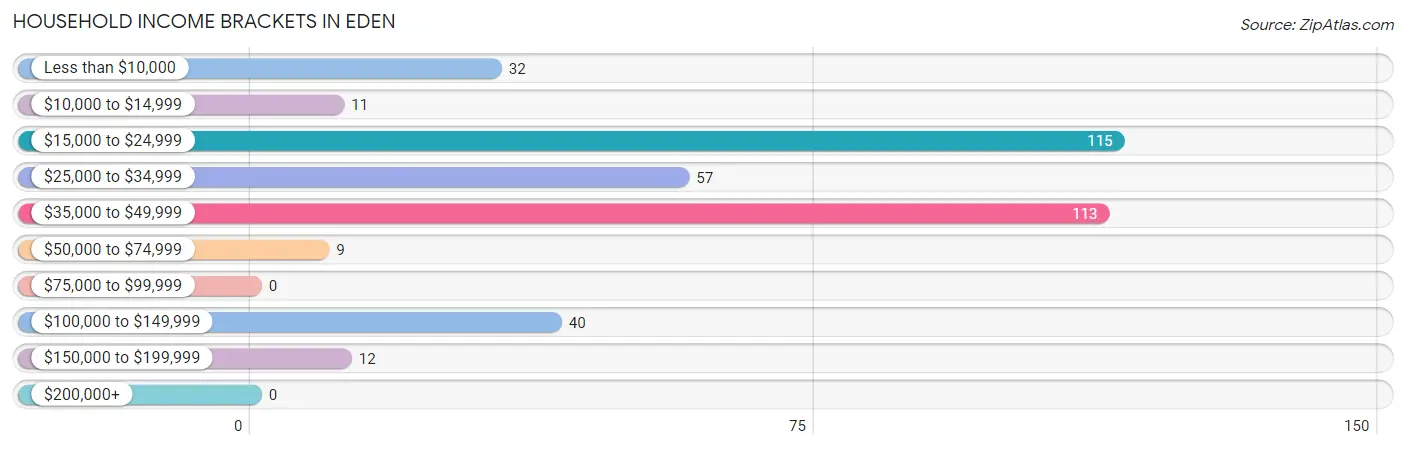
| Income Bracket | # Households | % Households |
| Less than $10,000 | 32 | 8.2% |
| $10,000 to $14,999 | 11 | 2.8% |
| $15,000 to $24,999 | 115 | 29.6% |
| $25,000 to $34,999 | 57 | 14.7% |
| $35,000 to $49,999 | 113 | 29.0% |
| $50,000 to $74,999 | 9 | 2.3% |
| $75,000 to $99,999 | 0 | 0.0% |
| $100,000 to $149,999 | 40 | 10.3% |
| $150,000 to $199,999 | 12 | 3.1% |
| $200,000+ | 0 | 0.0% |
Household Income by Householder Age in Eden
The median household income in Eden is $28,808, with the highest median household income of $47,576 found in the 65+ years age bracket for the primary householder. A total of 104 households (26.7%) fall into this category. Meanwhile, the 15 to 24 years age bracket for the primary householder has the lowest median household income of $0, with 14 households (3.6%) in this group.
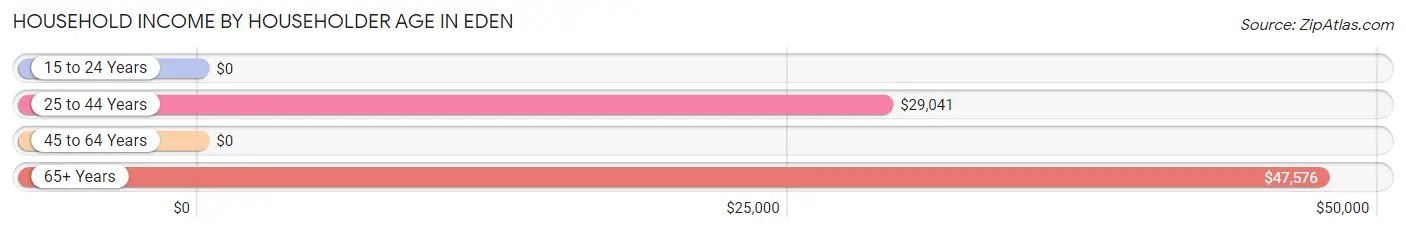
| Income Bracket | # Households | Median Income |
| 15 to 24 Years | 14 (3.6%) | $0 |
| 25 to 44 Years | 197 (50.6%) | $29,041 |
| 45 to 64 Years | 74 (19.0%) | $0 |
| 65+ Years | 104 (26.7%) | $47,576 |
| Total | 389 (100.0%) | $28,808 |
Poverty in Eden
Income Below Poverty by Sex and Age in Eden
With 32.4% poverty level for males and 34.9% for females among the residents of Eden, 12 to 14 year old males and 6 to 11 year old females are the most vulnerable to poverty, with 26 males (100.0%) and 61 females (61.6%) in their respective age groups living below the poverty level.
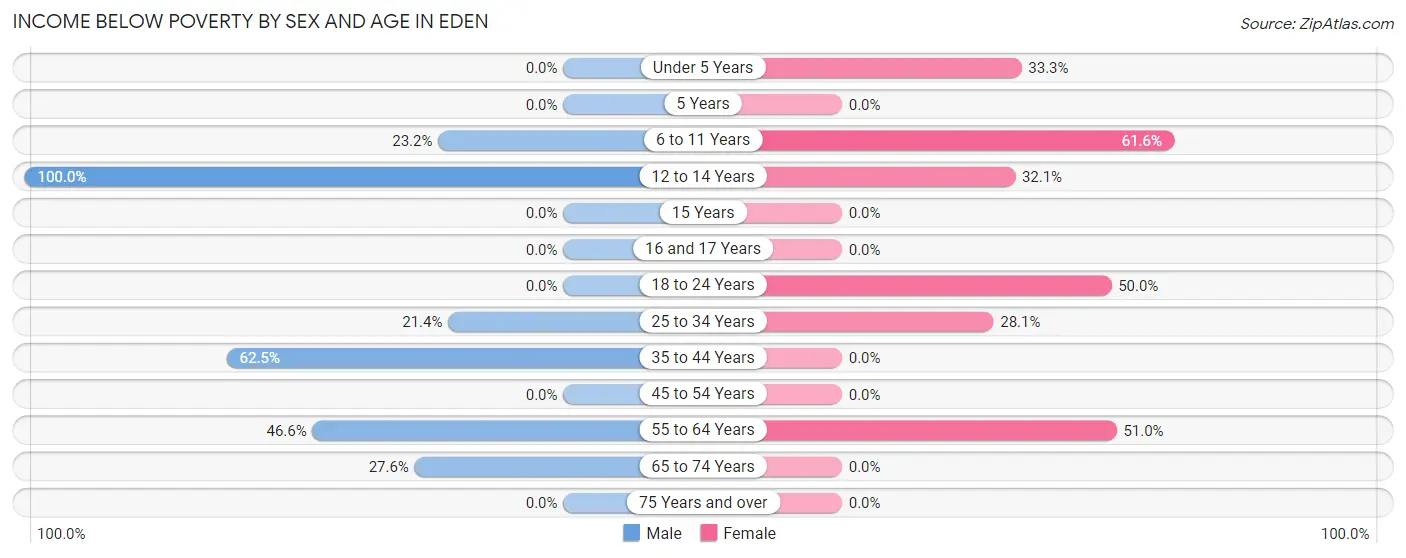
| Age Bracket | Male | Female |
| Under 5 Years | 0 (0.0%) | 18 (33.3%) |
| 5 Years | 0 (0.0%) | 0 (0.0%) |
| 6 to 11 Years | 13 (23.2%) | 61 (61.6%) |
| 12 to 14 Years | 26 (100.0%) | 18 (32.1%) |
| 15 Years | 0 (0.0%) | 0 (0.0%) |
| 16 and 17 Years | 0 (0.0%) | 0 (0.0%) |
| 18 to 24 Years | 0 (0.0%) | 14 (50.0%) |
| 25 to 34 Years | 19 (21.3%) | 36 (28.1%) |
| 35 to 44 Years | 65 (62.5%) | 0 (0.0%) |
| 45 to 54 Years | 0 (0.0%) | 0 (0.0%) |
| 55 to 64 Years | 27 (46.6%) | 26 (51.0%) |
| 65 to 74 Years | 16 (27.6%) | 0 (0.0%) |
| 75 Years and over | 0 (0.0%) | 0 (0.0%) |
| Total | 166 (32.4%) | 173 (34.9%) |
Income Above Poverty by Sex and Age in Eden
According to the poverty statistics in Eden, males aged under 5 years and females aged 35 to 44 years are the age groups that are most secure financially, with 100.0% of males and 100.0% of females in these age groups living above the poverty line.
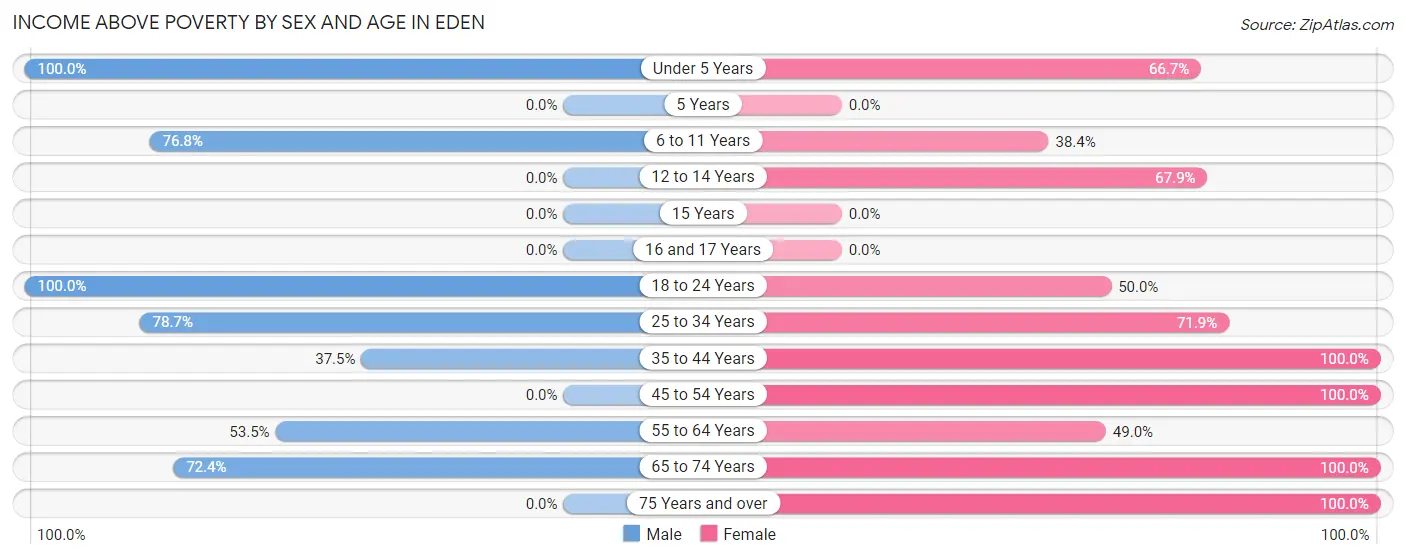
| Age Bracket | Male | Female |
| Under 5 Years | 107 (100.0%) | 36 (66.7%) |
| 5 Years | 0 (0.0%) | 0 (0.0%) |
| 6 to 11 Years | 43 (76.8%) | 38 (38.4%) |
| 12 to 14 Years | 0 (0.0%) | 38 (67.9%) |
| 15 Years | 0 (0.0%) | 0 (0.0%) |
| 16 and 17 Years | 0 (0.0%) | 0 (0.0%) |
| 18 to 24 Years | 15 (100.0%) | 14 (50.0%) |
| 25 to 34 Years | 70 (78.6%) | 92 (71.9%) |
| 35 to 44 Years | 39 (37.5%) | 11 (100.0%) |
| 45 to 54 Years | 0 (0.0%) | 22 (100.0%) |
| 55 to 64 Years | 31 (53.4%) | 25 (49.0%) |
| 65 to 74 Years | 42 (72.4%) | 8 (100.0%) |
| 75 Years and over | 0 (0.0%) | 38 (100.0%) |
| Total | 347 (67.6%) | 322 (65.0%) |
Income Below Poverty Among Married-Couple Families in Eden
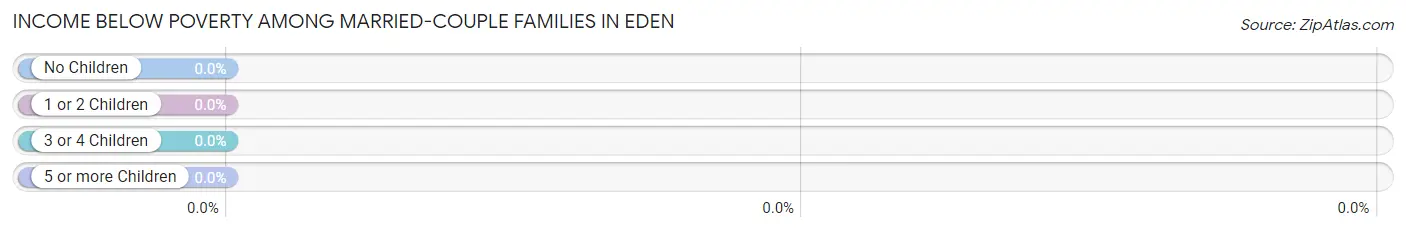
| Children | Above Poverty | Below Poverty |
| No Children | 12 (100.0%) | 0 (0.0%) |
| 1 or 2 Children | 27 (100.0%) | 0 (0.0%) |
| 3 or 4 Children | 19 (100.0%) | 0 (0.0%) |
| 5 or more Children | 0 (0.0%) | 0 (0.0%) |
| Total | 58 (100.0%) | 0 (0.0%) |
Income Below Poverty Among Single-Parent Households in Eden
According to the poverty data in Eden, 100.0% or 81 single-father households and 48.1% or 50 single-mother households are living below the poverty line. Among single-father households, those with 1 or 2 children have the highest poverty rate, with 81 households (100.0%) experiencing poverty. Likewise, among single-mother households, those with 1 or 2 children have the highest poverty rate, with 50 households (53.8%) falling below the poverty line.
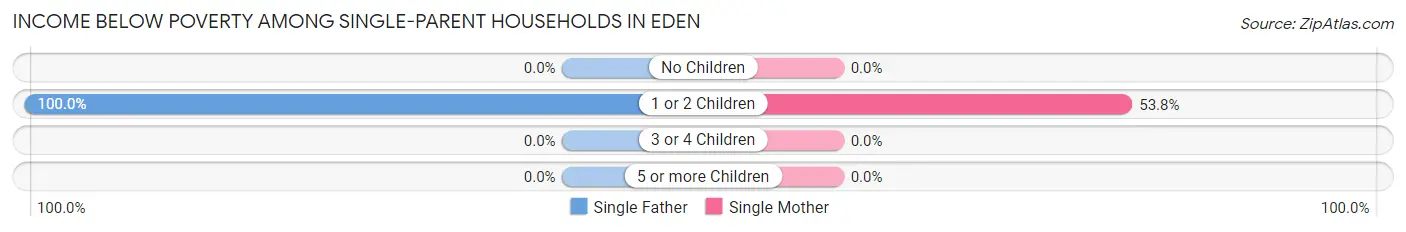
| Children | Single Father | Single Mother |
| No Children | 0 (0.0%) | 0 (0.0%) |
| 1 or 2 Children | 81 (100.0%) | 50 (53.8%) |
| 3 or 4 Children | 0 (0.0%) | 0 (0.0%) |
| 5 or more Children | 0 (0.0%) | 0 (0.0%) |
| Total | 81 (100.0%) | 50 (48.1%) |
Income Below Poverty Among Married-Couple vs Single-Parent Households in Eden
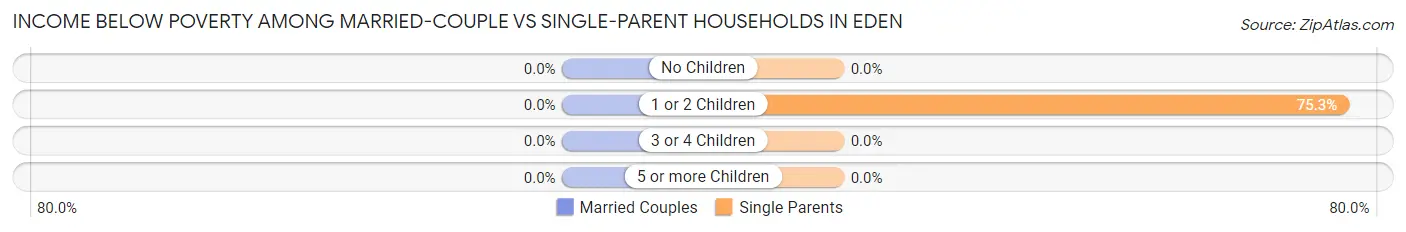
| Children | Married-Couple Families | Single-Parent Households |
| No Children | 0 (0.0%) | 0 (0.0%) |
| 1 or 2 Children | 0 (0.0%) | 131 (75.3%) |
| 3 or 4 Children | 0 (0.0%) | 0 (0.0%) |
| 5 or more Children | 0 (0.0%) | 0 (0.0%) |
| Total | 0 (0.0%) | 131 (70.8%) |
Race in Eden
The most populous races in Eden are White / Caucasian (586 | 58.1%), Black / African American (379 | 37.6%), and Two or more Races (43 | 4.3%).
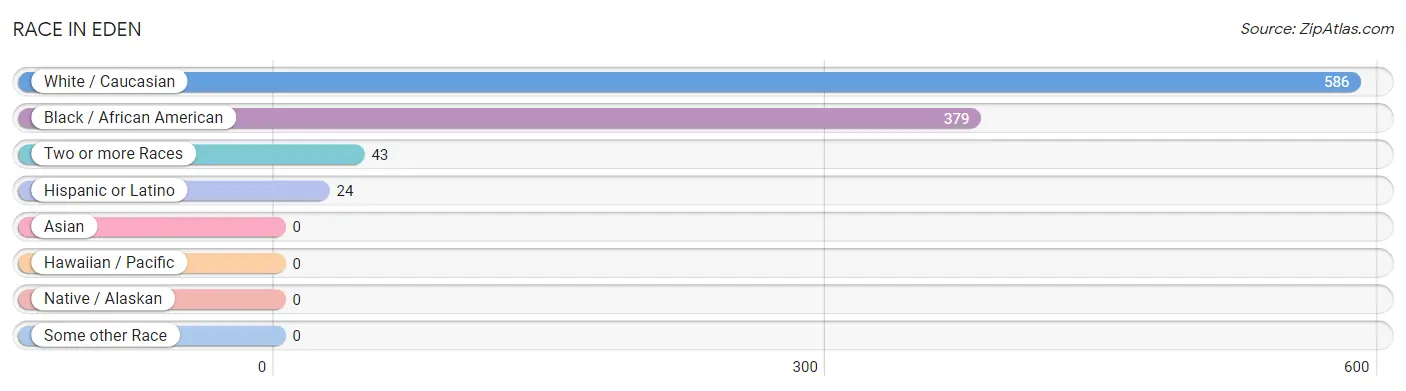
| Race | # Population | % Population |
| Asian | 0 | 0.0% |
| Black / African American | 379 | 37.6% |
| Hawaiian / Pacific | 0 | 0.0% |
| Hispanic or Latino | 24 | 2.4% |
| Native / Alaskan | 0 | 0.0% |
| White / Caucasian | 586 | 58.1% |
| Two or more Races | 43 | 4.3% |
| Some other Race | 0 | 0.0% |
| Total | 1,008 | 100.0% |
Ancestry in Eden
The most populous ancestries reported in Eden are American (290 | 28.8%), English (117 | 11.6%), German (109 | 10.8%), Italian (57 | 5.7%), and Irish (53 | 5.3%), together accounting for 62.1% of all Eden residents.
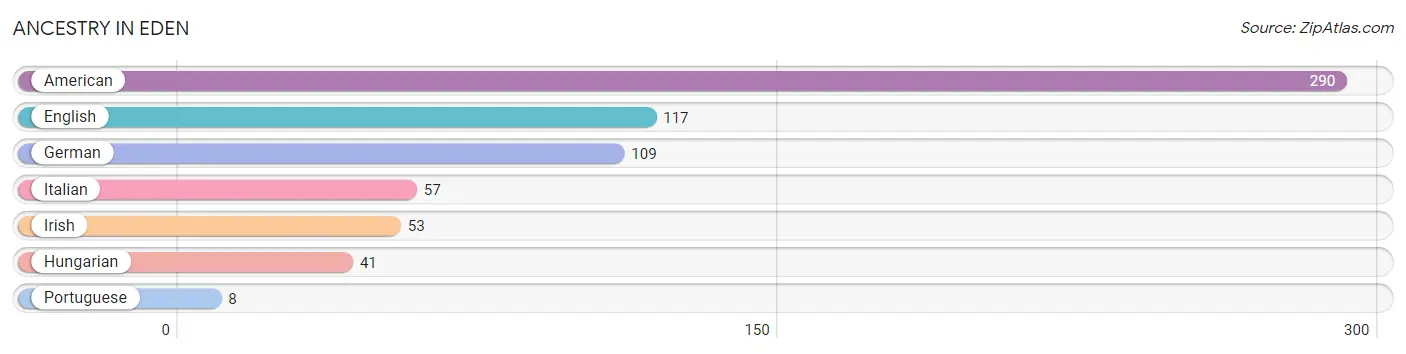
| Ancestry | # Population | % Population |
| American | 290 | 28.8% |
| English | 117 | 11.6% |
| German | 109 | 10.8% |
| Hungarian | 41 | 4.1% |
| Irish | 53 | 5.3% |
| Italian | 57 | 5.7% |
| Portuguese | 8 | 0.8% | View All 7 Rows |
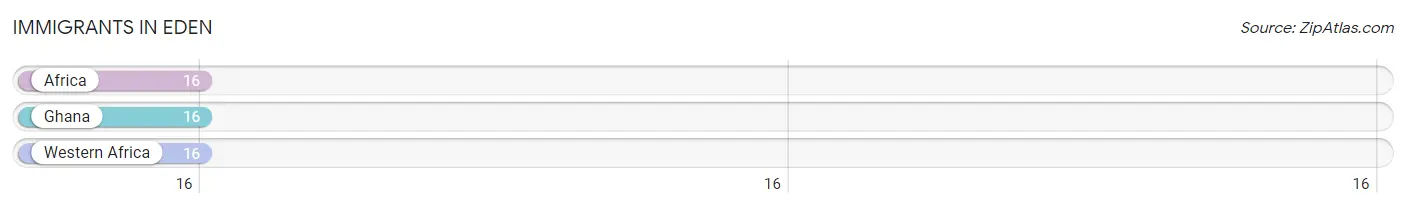
Immigrants in Eden
The most numerous immigrant groups reported in Eden came from Africa (16 | 1.6%), Ghana (16 | 1.6%), and Western Africa (16 | 1.6%), together accounting for 4.8% of all Eden residents.
| Immigration Origin | # Population | % Population |
| Africa | 16 | 1.6% |
| Ghana | 16 | 1.6% |
| Western Africa | 16 | 1.6% | View All 3 Rows |
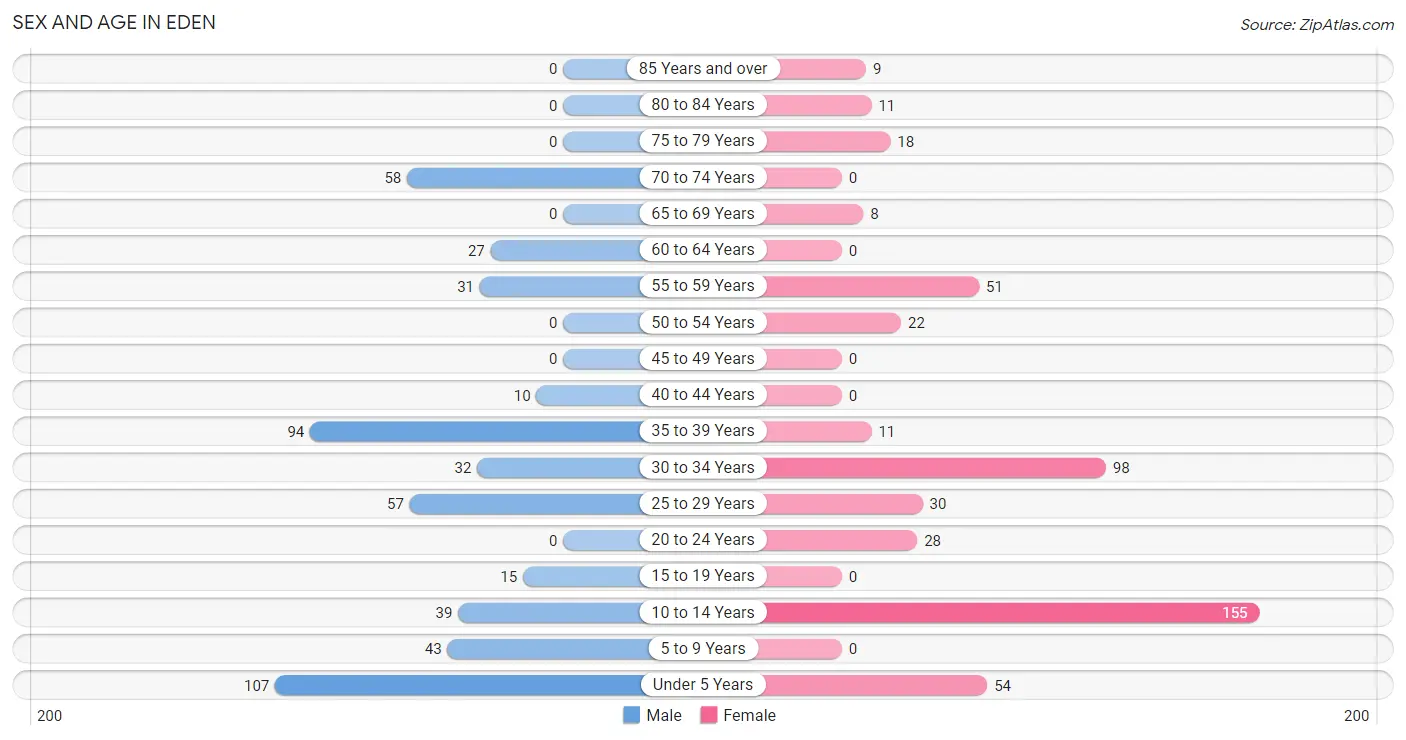
Sex and Age in Eden
Sex and Age in Eden
The most populous age groups in Eden are Under 5 Years (107 | 20.9%) for men and 10 to 14 Years (155 | 31.3%) for women.
| Age Bracket | Male | Female |
| Under 5 Years | 107 (20.9%) | 54 (10.9%) |
| 5 to 9 Years | 43 (8.4%) | 0 (0.0%) |
| 10 to 14 Years | 39 (7.6%) | 155 (31.3%) |
| 15 to 19 Years | 15 (2.9%) | 0 (0.0%) |
| 20 to 24 Years | 0 (0.0%) | 28 (5.7%) |
| 25 to 29 Years | 57 (11.1%) | 30 (6.1%) |
| 30 to 34 Years | 32 (6.2%) | 98 (19.8%) |
| 35 to 39 Years | 94 (18.3%) | 11 (2.2%) |
| 40 to 44 Years | 10 (1.9%) | 0 (0.0%) |
| 45 to 49 Years | 0 (0.0%) | 0 (0.0%) |
| 50 to 54 Years | 0 (0.0%) | 22 (4.4%) |
| 55 to 59 Years | 31 (6.0%) | 51 (10.3%) |
| 60 to 64 Years | 27 (5.3%) | 0 (0.0%) |
| 65 to 69 Years | 0 (0.0%) | 8 (1.6%) |
| 70 to 74 Years | 58 (11.3%) | 0 (0.0%) |
| 75 to 79 Years | 0 (0.0%) | 18 (3.6%) |
| 80 to 84 Years | 0 (0.0%) | 11 (2.2%) |
| 85 Years and over | 0 (0.0%) | 9 (1.8%) |
| Total | 513 (100.0%) | 495 (100.0%) |
Families and Households in Eden
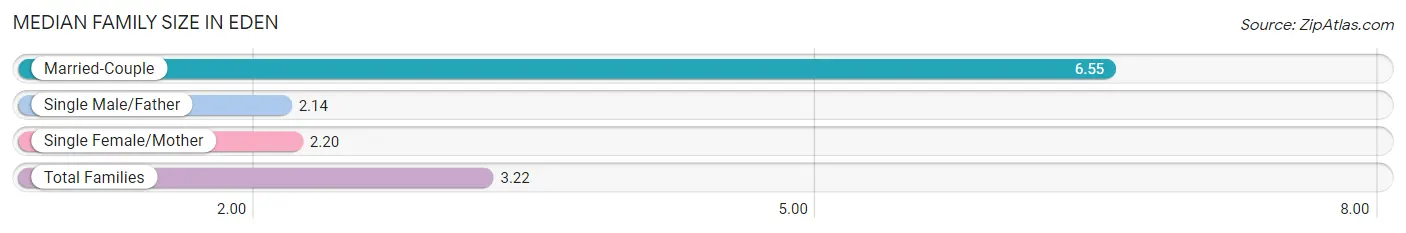
Median Family Size in Eden
The median family size in Eden is 3.22 persons per family, with married-couple families (58 | 23.9%) accounting for the largest median family size of 6.55 persons per family. On the other hand, single male/father families (81 | 33.3%) represent the smallest median family size with 2.14 persons per family.
| Family Type | # Families | Family Size |
| Married-Couple | 58 (23.9%) | 6.55 |
| Single Male/Father | 81 (33.3%) | 2.14 |
| Single Female/Mother | 104 (42.8%) | 2.20 |
| Total Families | 243 (100.0%) | 3.22 |
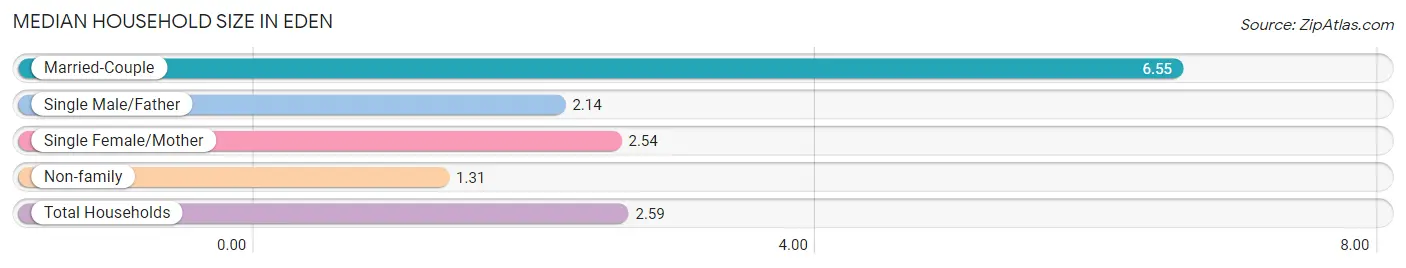
Median Household Size in Eden
The median household size in Eden is 2.59 persons per household, with married-couple households (58 | 14.9%) accounting for the largest median household size of 6.55 persons per household. non-family households (146 | 37.5%) represent the smallest median household size with 1.31 persons per household.
| Household Type | # Households | Household Size |
| Married-Couple | 58 (14.9%) | 6.55 |
| Single Male/Father | 81 (20.8%) | 2.14 |
| Single Female/Mother | 104 (26.7%) | 2.54 |
| Non-family | 146 (37.5%) | 1.31 |
| Total Households | 389 (100.0%) | 2.59 |
Household Size by Marriage Status in Eden
Out of a total of 389 households in Eden, 243 (62.5%) are family households, while 146 (37.5%) are nonfamily households. The most numerous type of family households are 3-person households, comprising 125, and the most common type of nonfamily households are 1-person households, comprising 117.
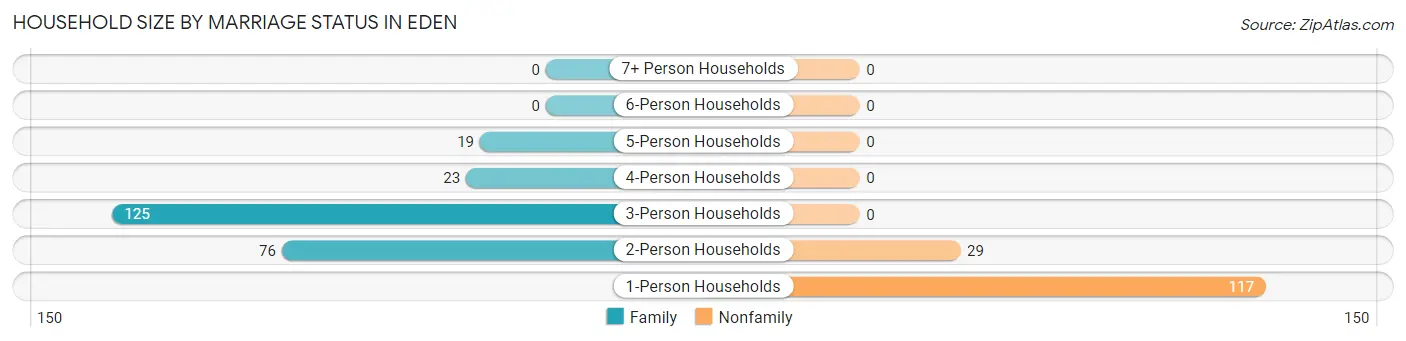
| Household Size | Family Households | Nonfamily Households |
| 1-Person Households | - | 117 (30.1%) |
| 2-Person Households | 76 (19.5%) | 29 (7.5%) |
| 3-Person Households | 125 (32.1%) | 0 (0.0%) |
| 4-Person Households | 23 (5.9%) | 0 (0.0%) |
| 5-Person Households | 19 (4.9%) | 0 (0.0%) |
| 6-Person Households | 0 (0.0%) | 0 (0.0%) |
| 7+ Person Households | 0 (0.0%) | 0 (0.0%) |
| Total | 243 (62.5%) | 146 (37.5%) |
Female Fertility in Eden
Fertility by Age in Eden
Average fertility rate in Eden is 180.0 births per 1,000 women. Women in the age bracket of 20 to 34 years have the highest fertility rate with 192.0 births per 1,000 women. Women in the age bracket of 20 to 34 years acount for 100.0% of all women with births.
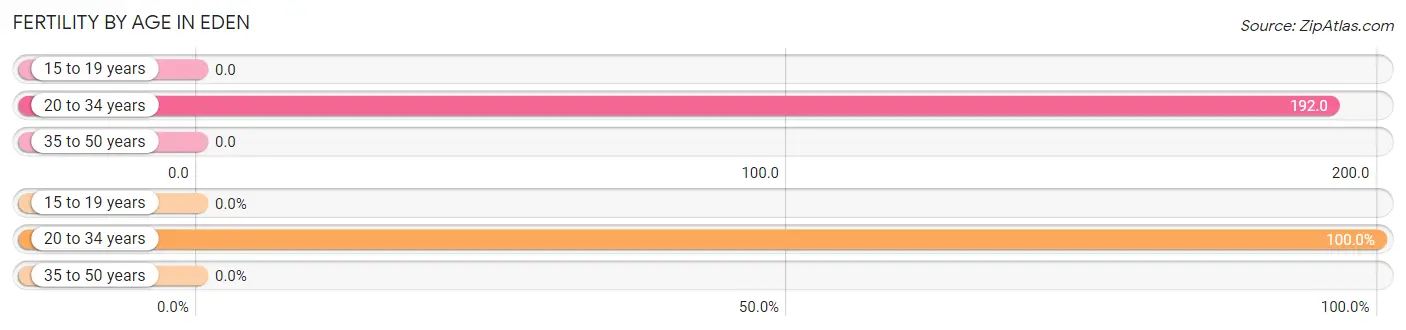
| Age Bracket | Women with Births | Births / 1,000 Women |
| 15 to 19 years | 0 (0.0%) | 0.0 |
| 20 to 34 years | 30 (100.0%) | 192.0 |
| 35 to 50 years | 0 (0.0%) | 0.0 |
| Total | 30 (100.0%) | 180.0 |
Fertility by Age by Marriage Status in Eden
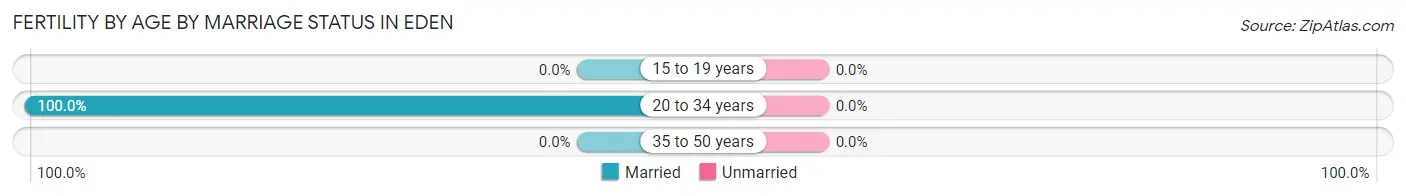
| Age Bracket | Married | Unmarried |
| 15 to 19 years | 0 (0.0%) | 0 (0.0%) |
| 20 to 34 years | 30 (100.0%) | 0 (0.0%) |
| 35 to 50 years | 0 (0.0%) | 0 (0.0%) |
| Total | 30 (100.0%) | 0 (0.0%) |
Fertility by Education in Eden
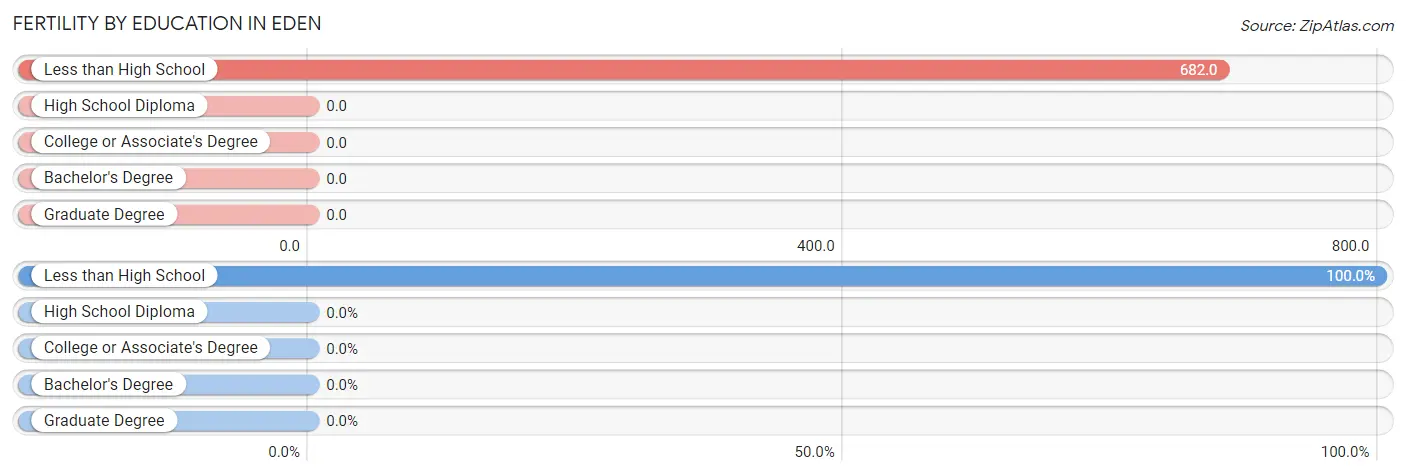
| Educational Attainment | Women with Births | Births / 1,000 Women |
| Less than High School | 30 (100.0%) | 682.0 |
| High School Diploma | 0 (0.0%) | 0.0 |
| College or Associate's Degree | 0 (0.0%) | 0.0 |
| Bachelor's Degree | 0 (0.0%) | 0.0 |
| Graduate Degree | 0 (0.0%) | 0.0 |
| Total | 30 (100.0%) | 180.0 |
Fertility by Education by Marriage Status in Eden
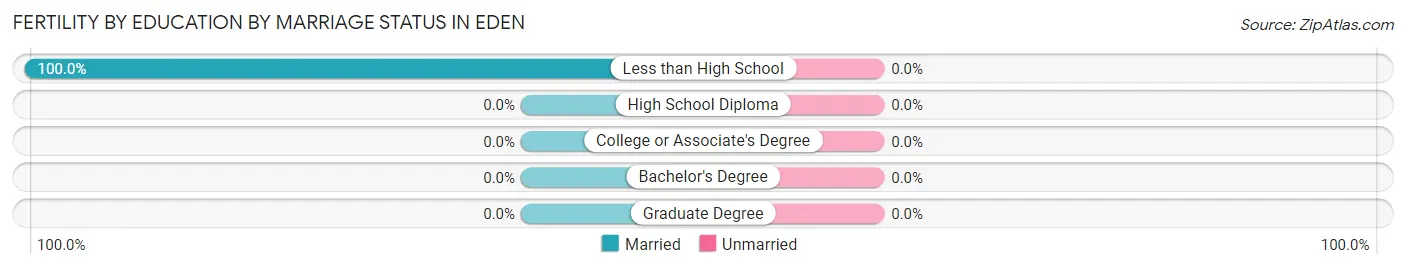
| Educational Attainment | Married | Unmarried |
| Less than High School | 30 (100.0%) | 0 (0.0%) |
| High School Diploma | 0 (0.0%) | 0 (0.0%) |
| College or Associate's Degree | 0 (0.0%) | 0 (0.0%) |
| Bachelor's Degree | 0 (0.0%) | 0 (0.0%) |
| Graduate Degree | 0 (0.0%) | 0 (0.0%) |
| Total | 30 (100.0%) | 0 (0.0%) |
Employment Characteristics in Eden
Employment by Class of Employer in Eden
Among the 330 employed individuals in Eden, private company employees (169 | 51.2%), self-employed (not incorporated) (81 | 24.5%), and state government employees (36 | 10.9%) make up the most common classes of employment.
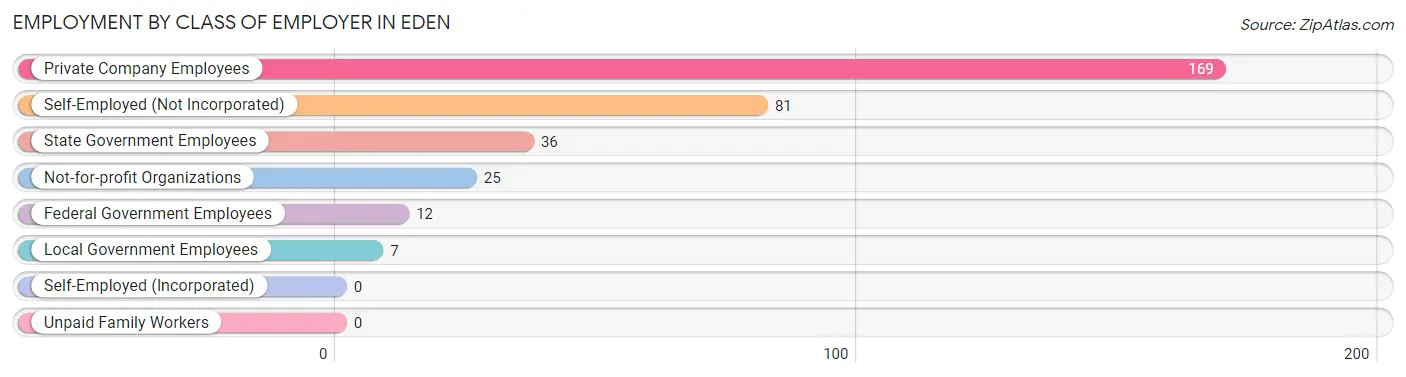
| Employer Class | # Employees | % Employees |
| Private Company Employees | 169 | 51.2% |
| Self-Employed (Incorporated) | 0 | 0.0% |
| Self-Employed (Not Incorporated) | 81 | 24.5% |
| Not-for-profit Organizations | 25 | 7.6% |
| Local Government Employees | 7 | 2.1% |
| State Government Employees | 36 | 10.9% |
| Federal Government Employees | 12 | 3.6% |
| Unpaid Family Workers | 0 | 0.0% |
| Total | 330 | 100.0% |
Employment Status by Age in Eden
According to the labor force statistics for Eden, out of the total population over 16 years of age (610), 60.3% or 368 individuals are in the labor force, with 10.3% or 38 of them unemployed. The age group with the highest labor force participation rate is 30 to 34 years, with 100.0% or 130 individuals in the labor force. Within the labor force, the 35 to 44 years age range has the highest percentage of unemployed individuals, with 19.1% or 22 of them being unemployed.
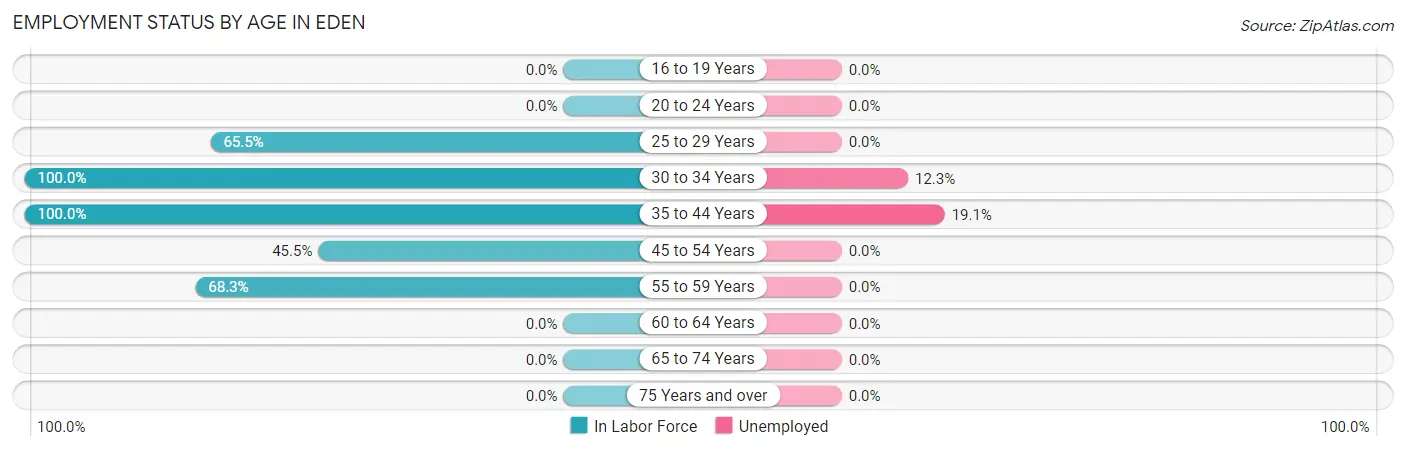
| Age Bracket | In Labor Force | Unemployed |
| 16 to 19 Years | 0 (0.0%) | 0 (0.0%) |
| 20 to 24 Years | 0 (0.0%) | 0 (0.0%) |
| 25 to 29 Years | 57 (65.5%) | 0 (0.0%) |
| 30 to 34 Years | 130 (100.0%) | 16 (12.3%) |
| 35 to 44 Years | 115 (100.0%) | 22 (19.1%) |
| 45 to 54 Years | 10 (45.5%) | 0 (0.0%) |
| 55 to 59 Years | 56 (68.3%) | 0 (0.0%) |
| 60 to 64 Years | 0 (0.0%) | 0 (0.0%) |
| 65 to 74 Years | 0 (0.0%) | 0 (0.0%) |
| 75 Years and over | 0 (0.0%) | 0 (0.0%) |
| Total | 368 (60.3%) | 38 (10.3%) |
Employment Status by Educational Attainment in Eden
According to labor force statistics for Eden, 79.5% of individuals (368) out of the total population between 25 and 64 years of age (463) are in the labor force, with 10.3% or 38 of them being unemployed. The group with the highest labor force participation rate are those with the educational attainment of bachelor's degree or higher, with 100.0% or 38 individuals in the labor force. Within the labor force, individuals with bachelor's degree or higher education have the highest percentage of unemployment, with 42.1% or 16 of them being unemployed.
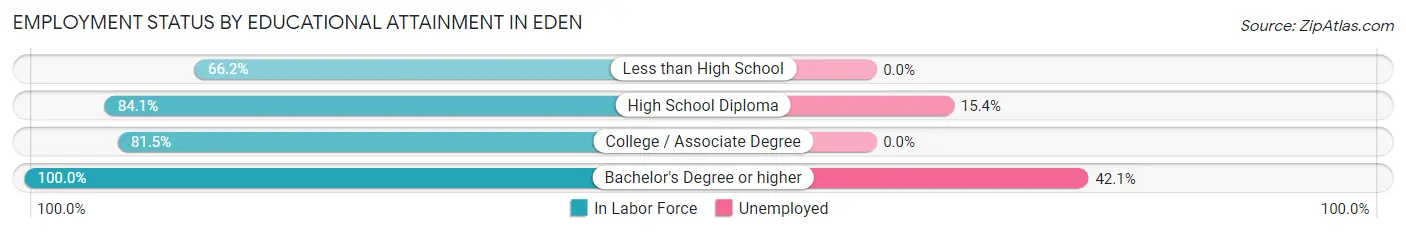
| Educational Attainment | In Labor Force | Unemployed |
| Less than High School | 90 (66.2%) | 0 (0.0%) |
| High School Diploma | 143 (84.1%) | 26 (15.4%) |
| College / Associate Degree | 97 (81.5%) | 0 (0.0%) |
| Bachelor's Degree or higher | 38 (100.0%) | 16 (42.1%) |
| Total | 368 (79.5%) | 48 (10.3%) |
Employment Occupations by Sex in Eden
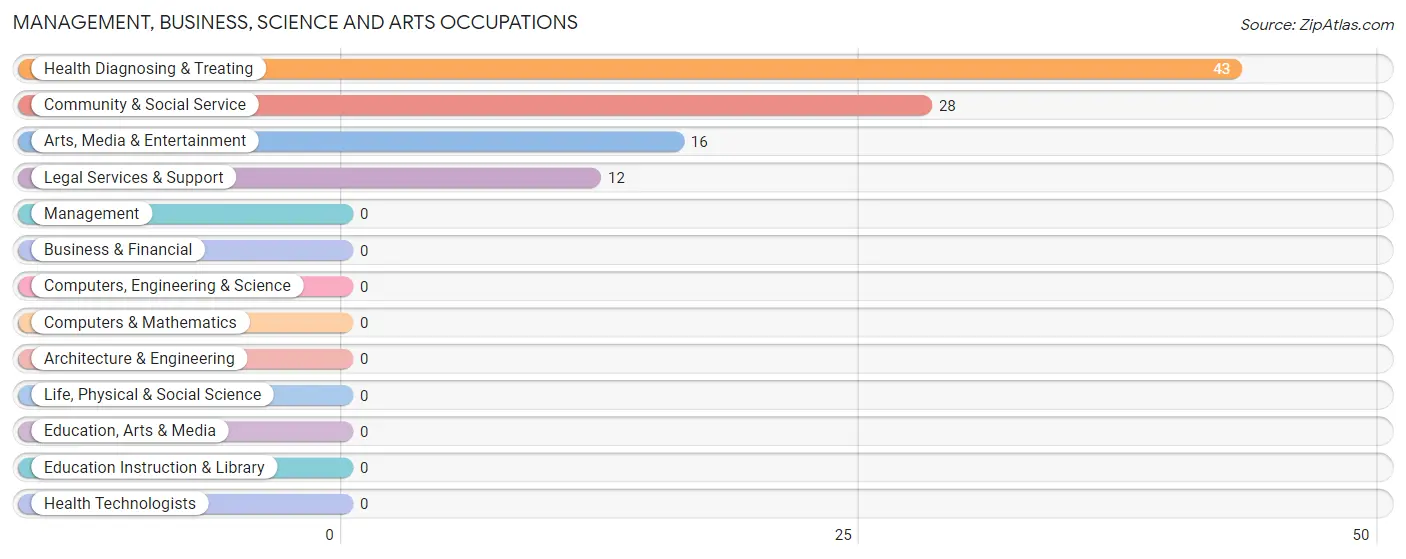
Management, Business, Science and Arts Occupations
The most common Management, Business, Science and Arts occupations in Eden are Health Diagnosing & Treating (43 | 13.0%), Community & Social Service (28 | 8.5%), Arts, Media & Entertainment (16 | 4.9%), and Legal Services & Support (12 | 3.6%).
Management, Business, Science and Arts Occupations by Sex
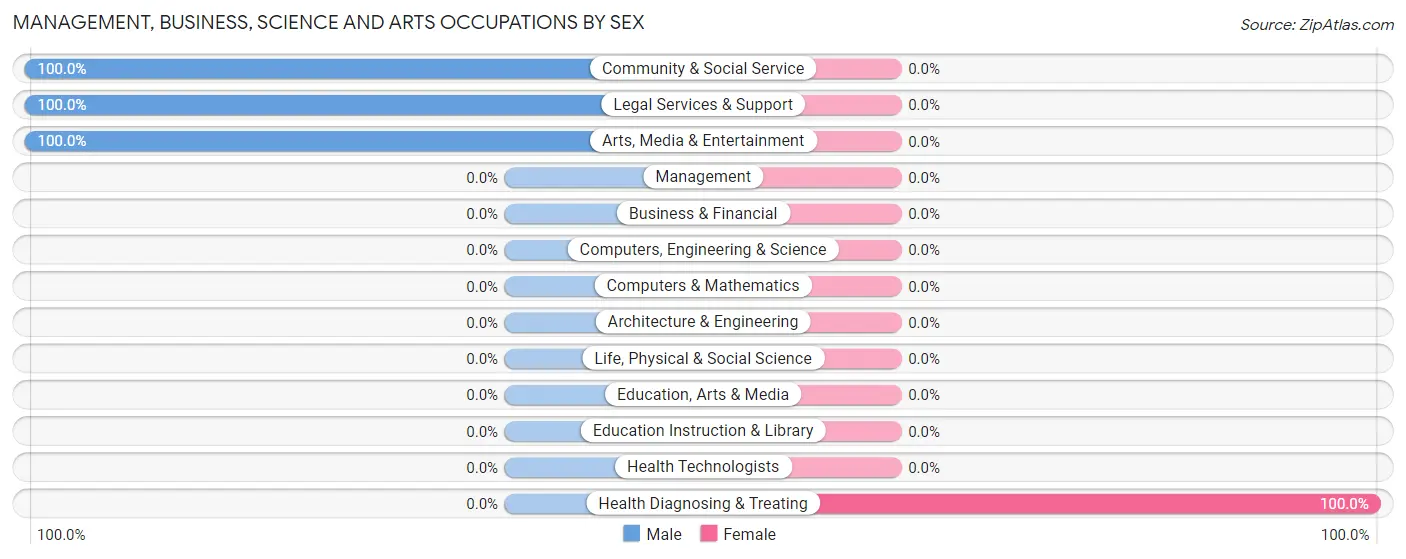
| Occupation | Male | Female |
| Management | 0 (0.0%) | 0 (0.0%) |
| Business & Financial | 0 (0.0%) | 0 (0.0%) |
| Computers, Engineering & Science | 0 (0.0%) | 0 (0.0%) |
| Computers & Mathematics | 0 (0.0%) | 0 (0.0%) |
| Architecture & Engineering | 0 (0.0%) | 0 (0.0%) |
| Life, Physical & Social Science | 0 (0.0%) | 0 (0.0%) |
| Community & Social Service | 28 (100.0%) | 0 (0.0%) |
| Education, Arts & Media | 0 (0.0%) | 0 (0.0%) |
| Legal Services & Support | 12 (100.0%) | 0 (0.0%) |
| Education Instruction & Library | 0 (0.0%) | 0 (0.0%) |
| Arts, Media & Entertainment | 16 (100.0%) | 0 (0.0%) |
| Health Diagnosing & Treating | 0 (0.0%) | 43 (100.0%) |
| Health Technologists | 0 (0.0%) | 0 (0.0%) |
| Total (Category) | 28 (39.4%) | 43 (60.6%) |
| Total (Overall) | 186 (56.4%) | 144 (43.6%) |
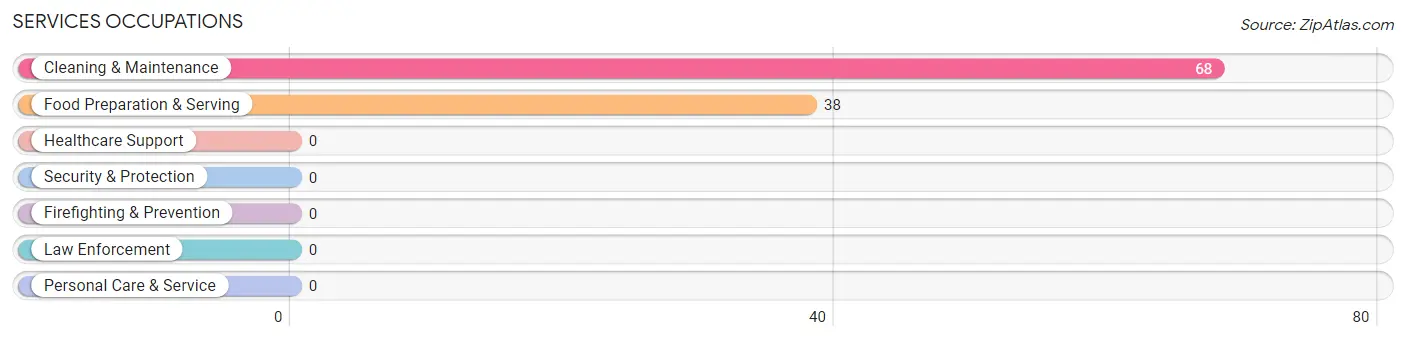
Services Occupations
The most common Services occupations in Eden are Cleaning & Maintenance (68 | 20.6%), and Food Preparation & Serving (38 | 11.5%).
Services Occupations by Sex
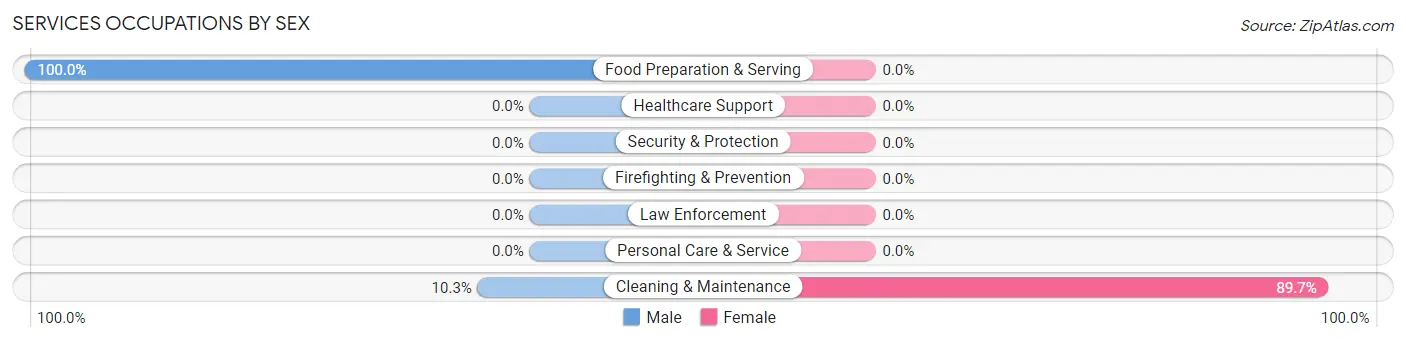
| Occupation | Male | Female |
| Healthcare Support | 0 (0.0%) | 0 (0.0%) |
| Security & Protection | 0 (0.0%) | 0 (0.0%) |
| Firefighting & Prevention | 0 (0.0%) | 0 (0.0%) |
| Law Enforcement | 0 (0.0%) | 0 (0.0%) |
| Food Preparation & Serving | 38 (100.0%) | 0 (0.0%) |
| Cleaning & Maintenance | 7 (10.3%) | 61 (89.7%) |
| Personal Care & Service | 0 (0.0%) | 0 (0.0%) |
| Total (Category) | 45 (42.4%) | 61 (57.6%) |
| Total (Overall) | 186 (56.4%) | 144 (43.6%) |
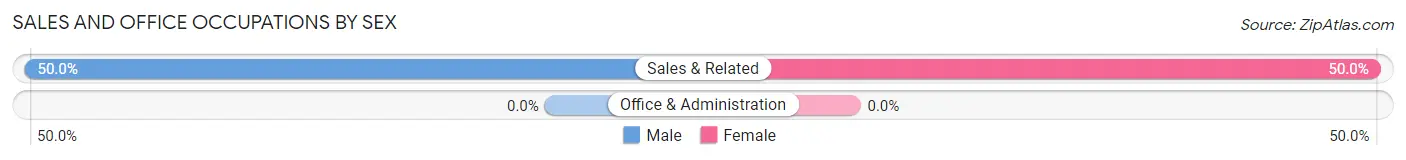
Sales and Office Occupations
The most common Sales and Office occupations in Eden are , and Sales & Related (38 | 11.5%).
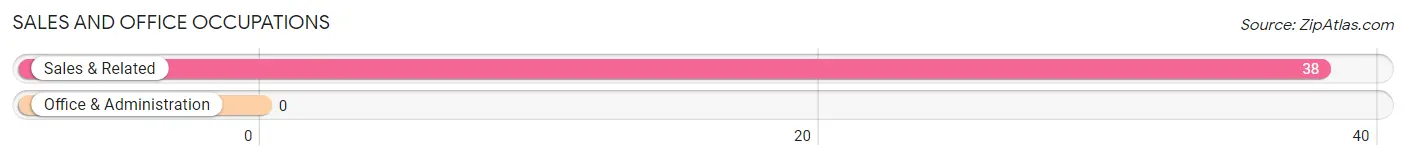
Sales and Office Occupations by Sex
| Occupation | Male | Female |
| Sales & Related | 19 (50.0%) | 19 (50.0%) |
| Office & Administration | 0 (0.0%) | 0 (0.0%) |
| Total (Category) | 19 (50.0%) | 19 (50.0%) |
| Total (Overall) | 186 (56.4%) | 144 (43.6%) |
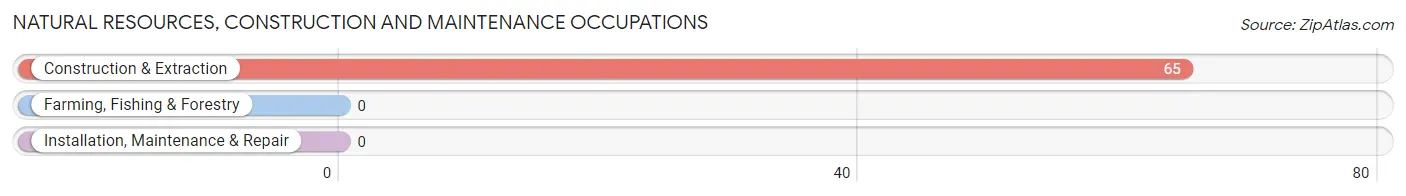
Natural Resources, Construction and Maintenance Occupations
The most common Natural Resources, Construction and Maintenance occupations in Eden are , and Construction & Extraction (65 | 19.7%).
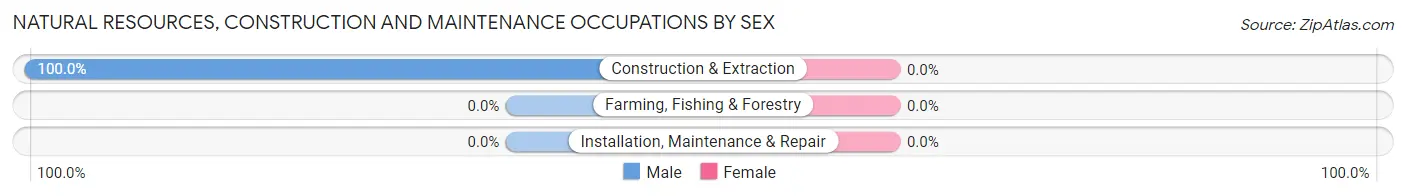
Natural Resources, Construction and Maintenance Occupations by Sex
| Occupation | Male | Female |
| Farming, Fishing & Forestry | 0 (0.0%) | 0 (0.0%) |
| Construction & Extraction | 65 (100.0%) | 0 (0.0%) |
| Installation, Maintenance & Repair | 0 (0.0%) | 0 (0.0%) |
| Total (Category) | 65 (100.0%) | 0 (0.0%) |
| Total (Overall) | 186 (56.4%) | 144 (43.6%) |
Production, Transportation and Moving Occupations
The most common Production, Transportation and Moving occupations in Eden are Transportation (40 | 12.1%), and Material Moving (10 | 3.0%).
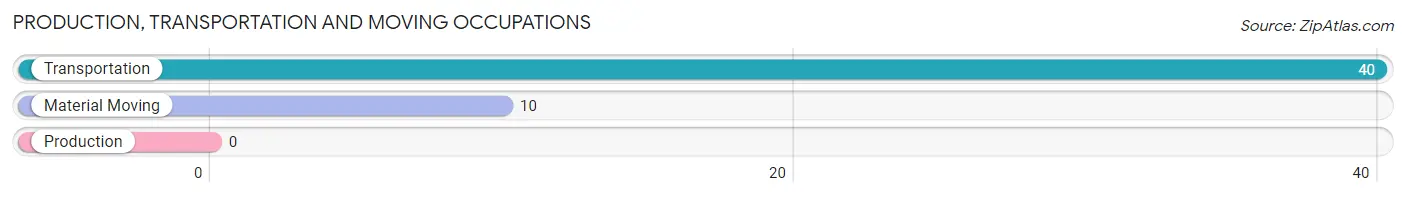
Production, Transportation and Moving Occupations by Sex
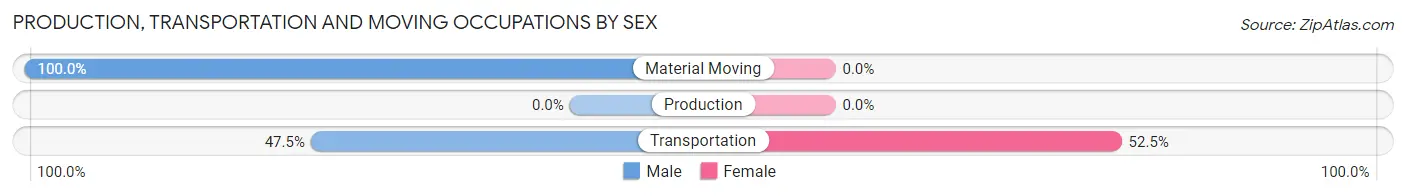
| Occupation | Male | Female |
| Production | 0 (0.0%) | 0 (0.0%) |
| Transportation | 19 (47.5%) | 21 (52.5%) |
| Material Moving | 10 (100.0%) | 0 (0.0%) |
| Total (Category) | 29 (58.0%) | 21 (42.0%) |
| Total (Overall) | 186 (56.4%) | 144 (43.6%) |
Employment Industries by Sex in Eden
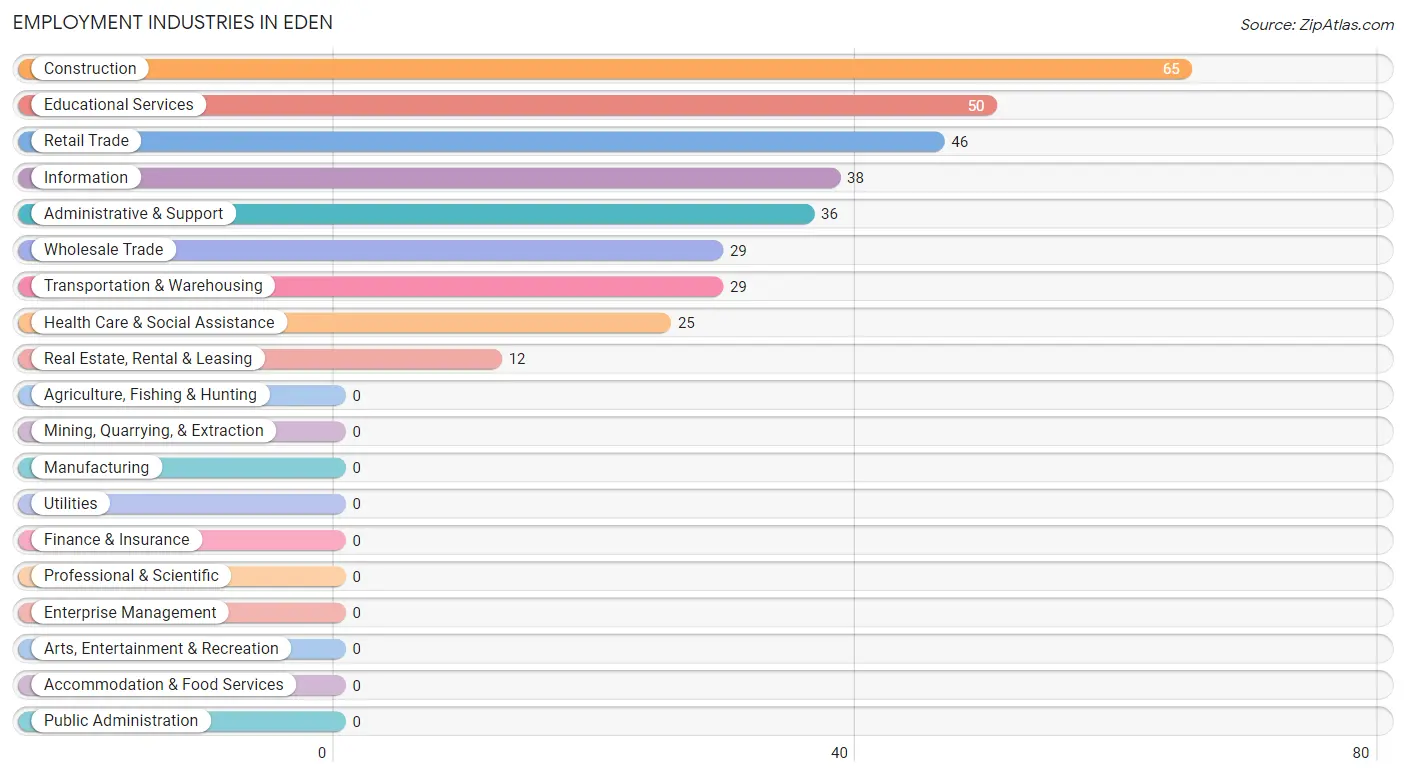
Employment Industries in Eden
The major employment industries in Eden include Construction (65 | 19.7%), Educational Services (50 | 15.1%), Retail Trade (46 | 13.9%), Information (38 | 11.5%), and Administrative & Support (36 | 10.9%).
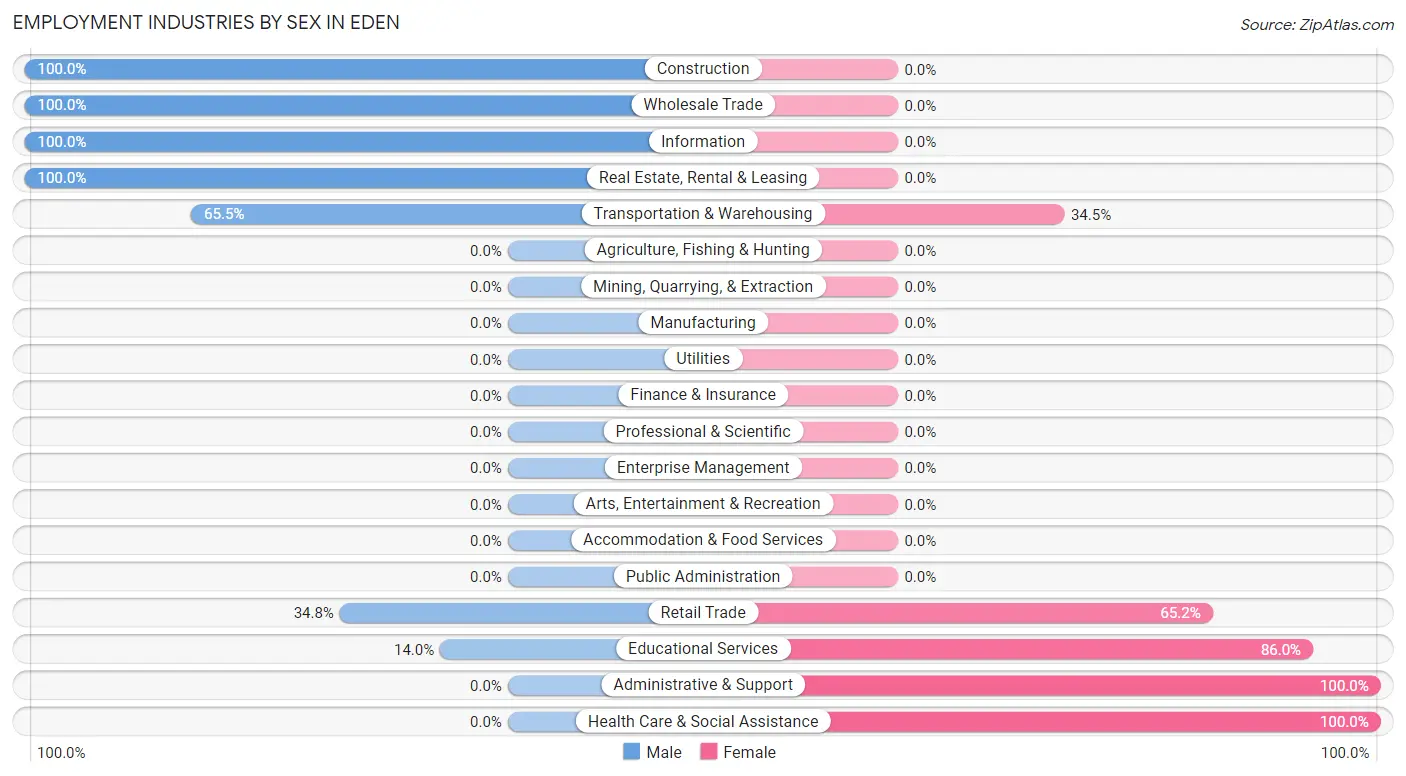
Employment Industries by Sex in Eden
The Eden industries that see more men than women are Construction (100.0%), Wholesale Trade (100.0%), and Information (100.0%), whereas the industries that tend to have a higher number of women are Administrative & Support (100.0%), Health Care & Social Assistance (100.0%), and Educational Services (86.0%).
| Industry | Male | Female |
| Agriculture, Fishing & Hunting | 0 (0.0%) | 0 (0.0%) |
| Mining, Quarrying, & Extraction | 0 (0.0%) | 0 (0.0%) |
| Construction | 65 (100.0%) | 0 (0.0%) |
| Manufacturing | 0 (0.0%) | 0 (0.0%) |
| Wholesale Trade | 29 (100.0%) | 0 (0.0%) |
| Retail Trade | 16 (34.8%) | 30 (65.2%) |
| Transportation & Warehousing | 19 (65.5%) | 10 (34.5%) |
| Utilities | 0 (0.0%) | 0 (0.0%) |
| Information | 38 (100.0%) | 0 (0.0%) |
| Finance & Insurance | 0 (0.0%) | 0 (0.0%) |
| Real Estate, Rental & Leasing | 12 (100.0%) | 0 (0.0%) |
| Professional & Scientific | 0 (0.0%) | 0 (0.0%) |
| Enterprise Management | 0 (0.0%) | 0 (0.0%) |
| Administrative & Support | 0 (0.0%) | 36 (100.0%) |
| Educational Services | 7 (14.0%) | 43 (86.0%) |
| Health Care & Social Assistance | 0 (0.0%) | 25 (100.0%) |
| Arts, Entertainment & Recreation | 0 (0.0%) | 0 (0.0%) |
| Accommodation & Food Services | 0 (0.0%) | 0 (0.0%) |
| Public Administration | 0 (0.0%) | 0 (0.0%) |
| Total | 186 (56.4%) | 144 (43.6%) |
Education in Eden
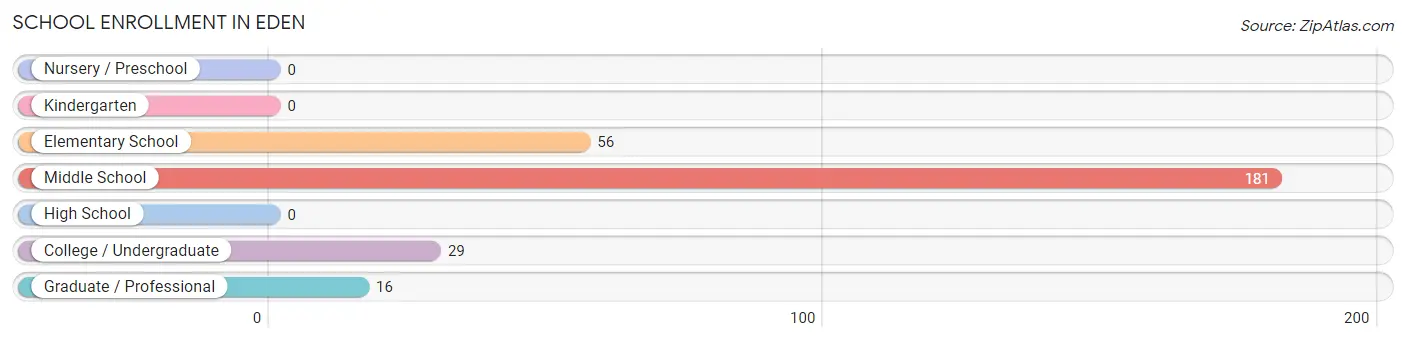
School Enrollment in Eden
The most common levels of schooling among the 282 students in Eden are middle school (181 | 64.2%), elementary school (56 | 19.9%), and college / undergraduate (29 | 10.3%).
| School Level | # Students | % Students |
| Nursery / Preschool | 0 | 0.0% |
| Kindergarten | 0 | 0.0% |
| Elementary School | 56 | 19.9% |
| Middle School | 181 | 64.2% |
| High School | 0 | 0.0% |
| College / Undergraduate | 29 | 10.3% |
| Graduate / Professional | 16 | 5.7% |
| Total | 282 | 100.0% |
School Enrollment by Age by Funding Source in Eden
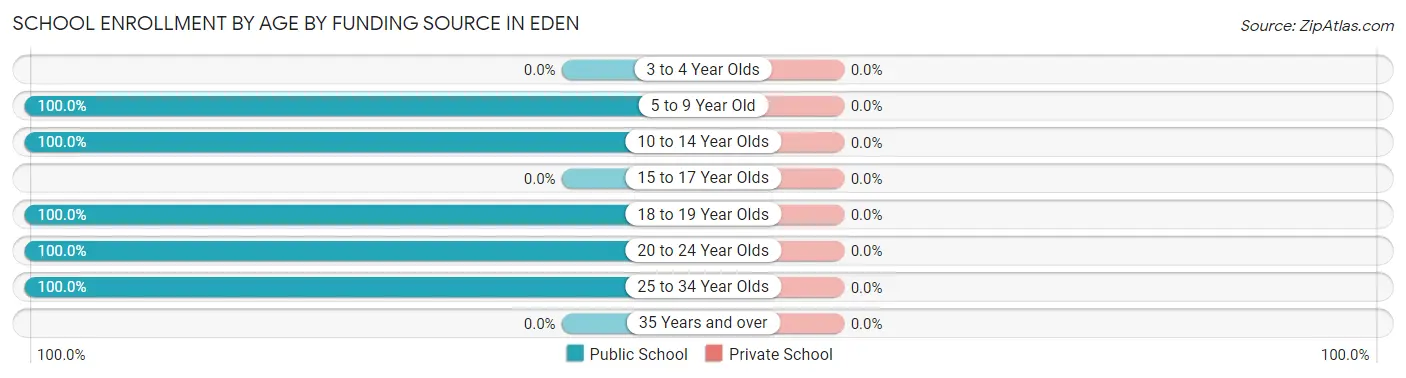
| Age Bracket | Public School | Private School |
| 3 to 4 Year Olds | 0 (0.0%) | 0 (0.0%) |
| 5 to 9 Year Old | 43 (100.0%) | 0 (0.0%) |
| 10 to 14 Year Olds | 194 (100.0%) | 0 (0.0%) |
| 15 to 17 Year Olds | 0 (0.0%) | 0 (0.0%) |
| 18 to 19 Year Olds | 15 (100.0%) | 0 (0.0%) |
| 20 to 24 Year Olds | 14 (100.0%) | 0 (0.0%) |
| 25 to 34 Year Olds | 16 (100.0%) | 0 (0.0%) |
| 35 Years and over | 0 (0.0%) | 0 (0.0%) |
| Total | 282 (100.0%) | 0 (0.0%) |
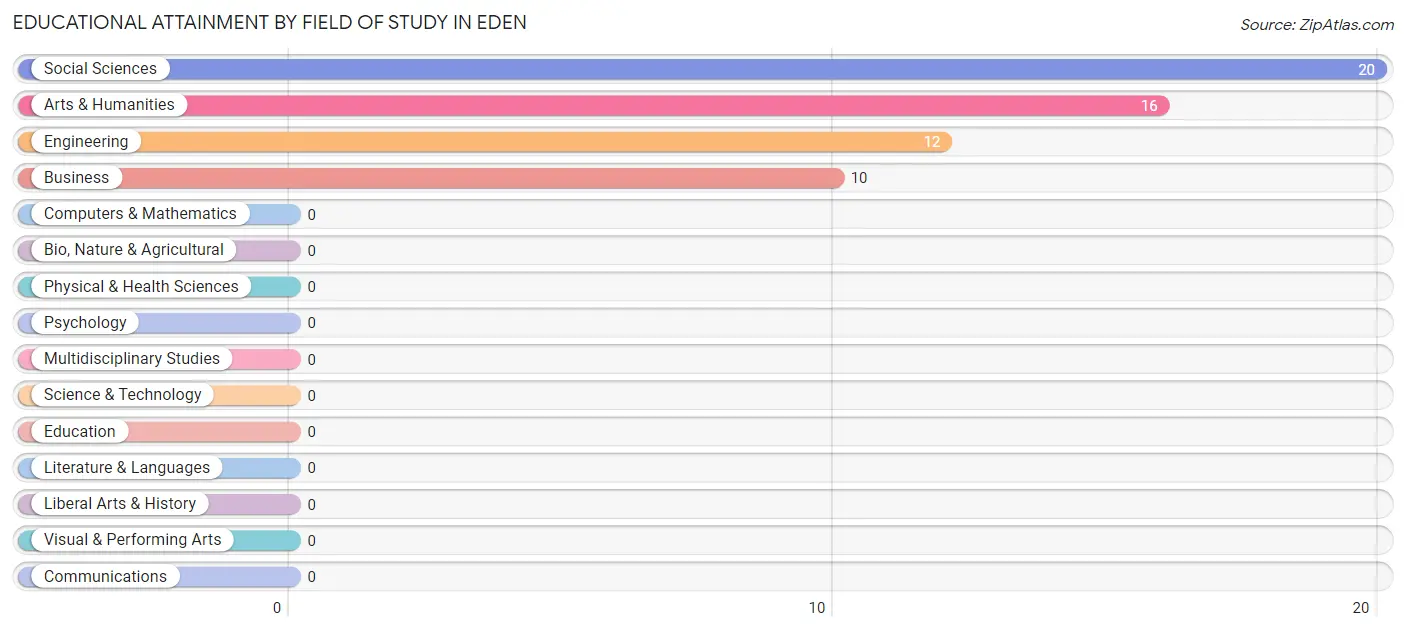
Educational Attainment by Field of Study in Eden
Social sciences (20 | 34.5%), arts & humanities (16 | 27.6%), engineering (12 | 20.7%), and business (10 | 17.2%) are the most common fields of study among 58 individuals in Eden who have obtained a bachelor's degree or higher.
| Field of Study | # Graduates | % Graduates |
| Computers & Mathematics | 0 | 0.0% |
| Bio, Nature & Agricultural | 0 | 0.0% |
| Physical & Health Sciences | 0 | 0.0% |
| Psychology | 0 | 0.0% |
| Social Sciences | 20 | 34.5% |
| Engineering | 12 | 20.7% |
| Multidisciplinary Studies | 0 | 0.0% |
| Science & Technology | 0 | 0.0% |
| Business | 10 | 17.2% |
| Education | 0 | 0.0% |
| Literature & Languages | 0 | 0.0% |
| Liberal Arts & History | 0 | 0.0% |
| Visual & Performing Arts | 0 | 0.0% |
| Communications | 0 | 0.0% |
| Arts & Humanities | 16 | 27.6% |
| Total | 58 | 100.0% |
Transportation & Commute in Eden
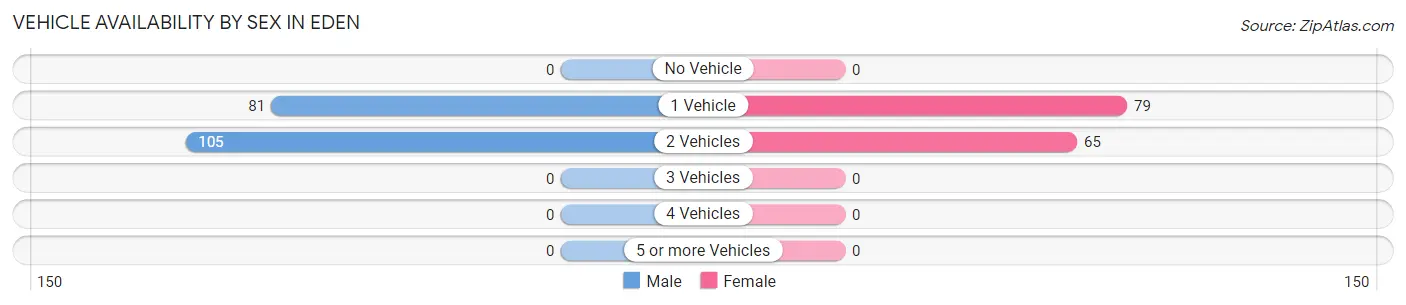
Vehicle Availability by Sex in Eden
The most prevalent vehicle ownership categories in Eden are males with 2 vehicles (105, accounting for 56.5%) and females with 2 vehicles (65, making up 72.9%).
| Vehicles Available | Male | Female |
| No Vehicle | 0 (0.0%) | 0 (0.0%) |
| 1 Vehicle | 81 (43.5%) | 79 (54.9%) |
| 2 Vehicles | 105 (56.5%) | 65 (45.1%) |
| 3 Vehicles | 0 (0.0%) | 0 (0.0%) |
| 4 Vehicles | 0 (0.0%) | 0 (0.0%) |
| 5 or more Vehicles | 0 (0.0%) | 0 (0.0%) |
| Total | 186 (100.0%) | 144 (100.0%) |
Commute Time in Eden
The most frequently occuring commute durations in Eden are 15 to 19 minutes (91 commuters, 28.6%), 45 to 59 minutes (84 commuters, 26.4%), and 20 to 24 minutes (53 commuters, 16.7%).
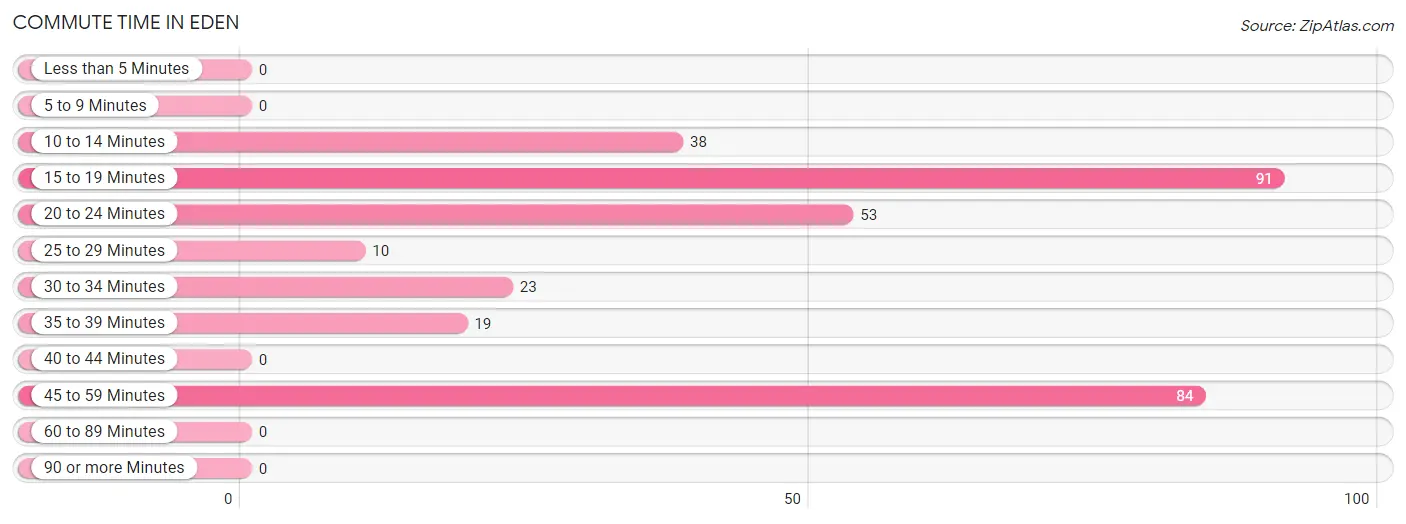
| Commute Time | # Commuters | % Commuters |
| Less than 5 Minutes | 0 | 0.0% |
| 5 to 9 Minutes | 0 | 0.0% |
| 10 to 14 Minutes | 38 | 11.9% |
| 15 to 19 Minutes | 91 | 28.6% |
| 20 to 24 Minutes | 53 | 16.7% |
| 25 to 29 Minutes | 10 | 3.1% |
| 30 to 34 Minutes | 23 | 7.2% |
| 35 to 39 Minutes | 19 | 6.0% |
| 40 to 44 Minutes | 0 | 0.0% |
| 45 to 59 Minutes | 84 | 26.4% |
| 60 to 89 Minutes | 0 | 0.0% |
| 90 or more Minutes | 0 | 0.0% |
Commute Time by Sex in Eden
The most common commute times in Eden are 45 to 59 minutes (84 commuters, 48.3%) for males and 15 to 19 minutes (91 commuters, 63.2%) for females.
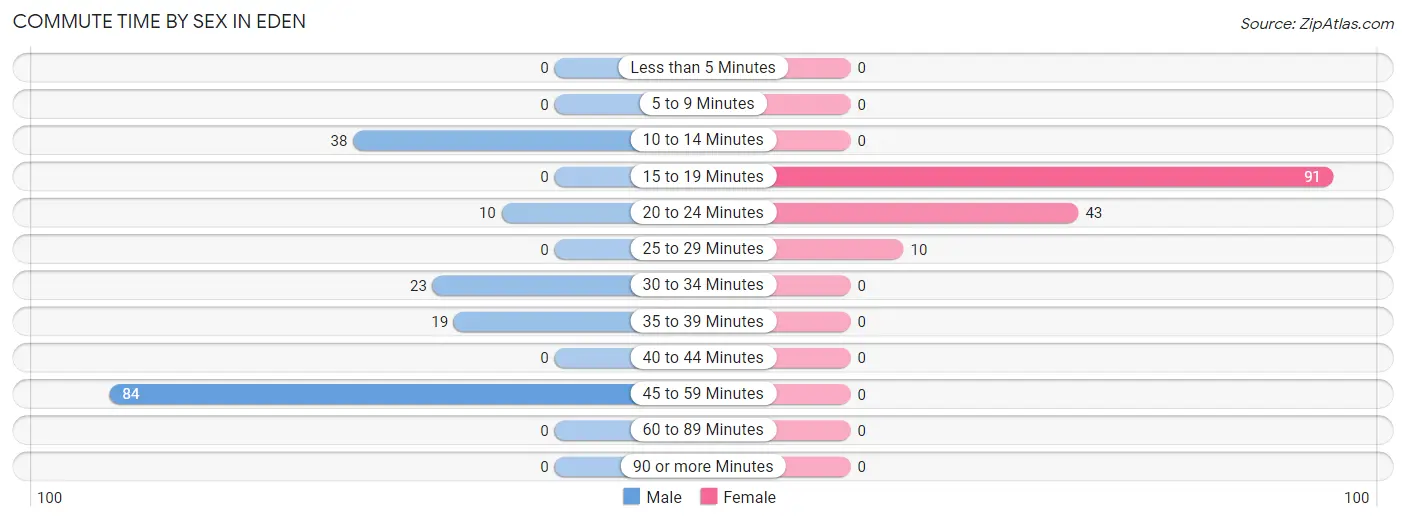
| Commute Time | Male | Female |
| Less than 5 Minutes | 0 (0.0%) | 0 (0.0%) |
| 5 to 9 Minutes | 0 (0.0%) | 0 (0.0%) |
| 10 to 14 Minutes | 38 (21.8%) | 0 (0.0%) |
| 15 to 19 Minutes | 0 (0.0%) | 91 (63.2%) |
| 20 to 24 Minutes | 10 (5.8%) | 43 (29.9%) |
| 25 to 29 Minutes | 0 (0.0%) | 10 (6.9%) |
| 30 to 34 Minutes | 23 (13.2%) | 0 (0.0%) |
| 35 to 39 Minutes | 19 (10.9%) | 0 (0.0%) |
| 40 to 44 Minutes | 0 (0.0%) | 0 (0.0%) |
| 45 to 59 Minutes | 84 (48.3%) | 0 (0.0%) |
| 60 to 89 Minutes | 0 (0.0%) | 0 (0.0%) |
| 90 or more Minutes | 0 (0.0%) | 0 (0.0%) |
Time of Departure to Work by Sex in Eden
The most frequent times of departure to work in Eden are 7:00 AM to 7:29 AM (65, 37.4%) for males and 6:30 AM to 6:59 AM (43, 29.9%) for females.
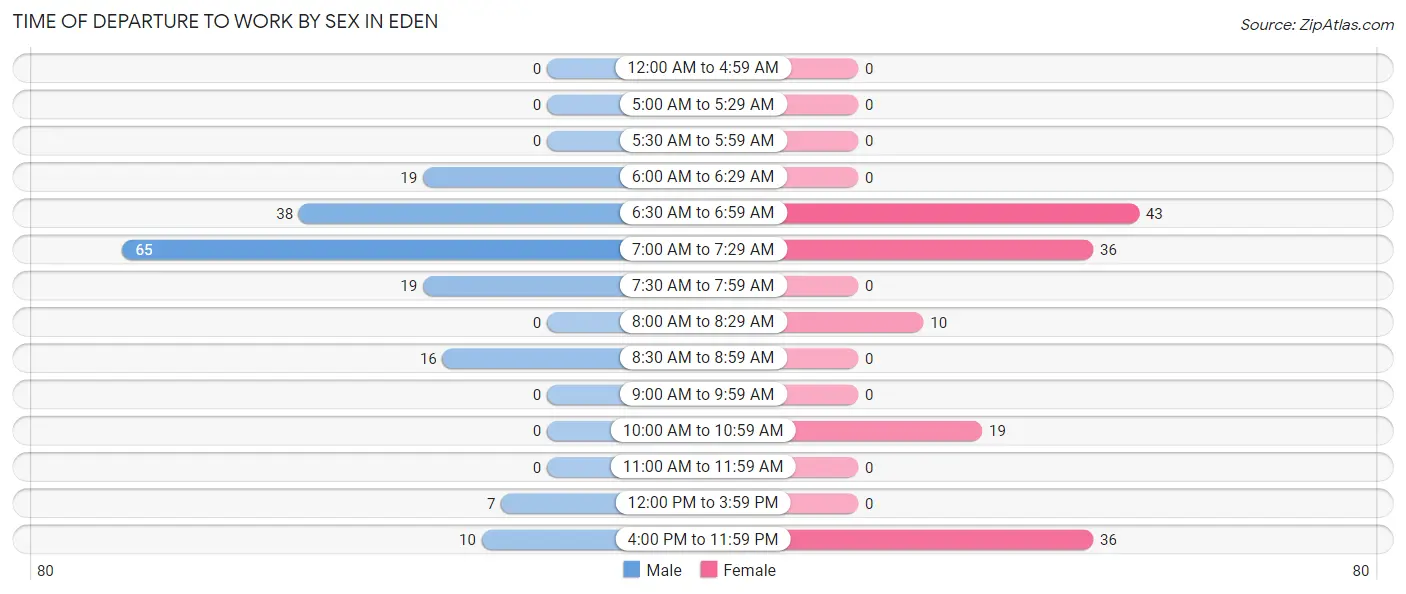
| Time of Departure | Male | Female |
| 12:00 AM to 4:59 AM | 0 (0.0%) | 0 (0.0%) |
| 5:00 AM to 5:29 AM | 0 (0.0%) | 0 (0.0%) |
| 5:30 AM to 5:59 AM | 0 (0.0%) | 0 (0.0%) |
| 6:00 AM to 6:29 AM | 19 (10.9%) | 0 (0.0%) |
| 6:30 AM to 6:59 AM | 38 (21.8%) | 43 (29.9%) |
| 7:00 AM to 7:29 AM | 65 (37.4%) | 36 (25.0%) |
| 7:30 AM to 7:59 AM | 19 (10.9%) | 0 (0.0%) |
| 8:00 AM to 8:29 AM | 0 (0.0%) | 10 (6.9%) |
| 8:30 AM to 8:59 AM | 16 (9.2%) | 0 (0.0%) |
| 9:00 AM to 9:59 AM | 0 (0.0%) | 0 (0.0%) |
| 10:00 AM to 10:59 AM | 0 (0.0%) | 19 (13.2%) |
| 11:00 AM to 11:59 AM | 0 (0.0%) | 0 (0.0%) |
| 12:00 PM to 3:59 PM | 7 (4.0%) | 0 (0.0%) |
| 4:00 PM to 11:59 PM | 10 (5.8%) | 36 (25.0%) |
| Total | 174 (100.0%) | 144 (100.0%) |
Housing Occupancy in Eden
Occupancy by Ownership in Eden
Of the total 389 dwellings in Eden, owner-occupied units account for 240 (61.7%), while renter-occupied units make up 149 (38.3%).
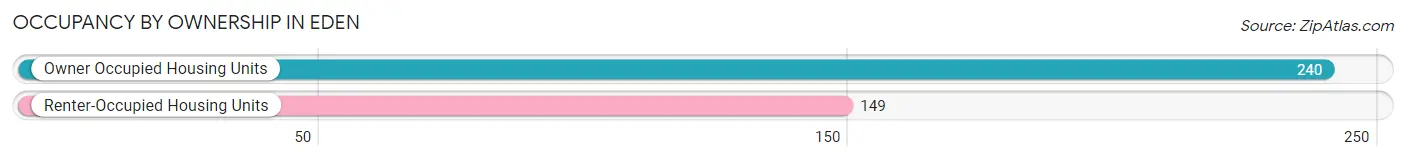
| Occupancy | # Housing Units | % Housing Units |
| Owner Occupied Housing Units | 240 | 61.7% |
| Renter-Occupied Housing Units | 149 | 38.3% |
| Total Occupied Housing Units | 389 | 100.0% |
Occupancy by Household Size in Eden
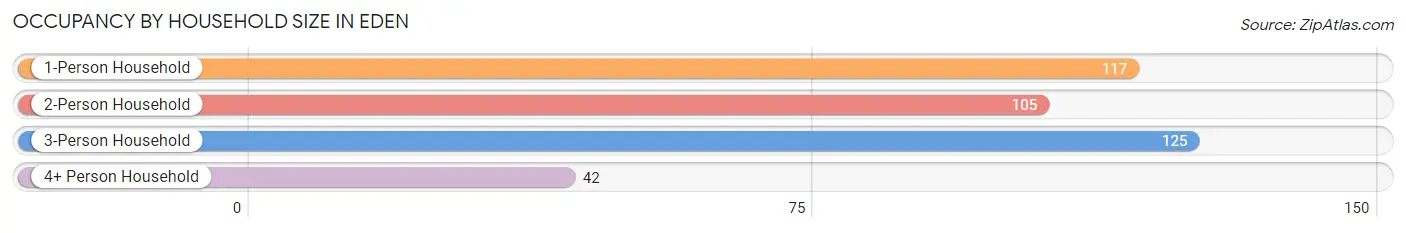
| Household Size | # Housing Units | % Housing Units |
| 1-Person Household | 117 | 30.1% |
| 2-Person Household | 105 | 27.0% |
| 3-Person Household | 125 | 32.1% |
| 4+ Person Household | 42 | 10.8% |
| Total Housing Units | 389 | 100.0% |
Occupancy by Ownership by Household Size in Eden
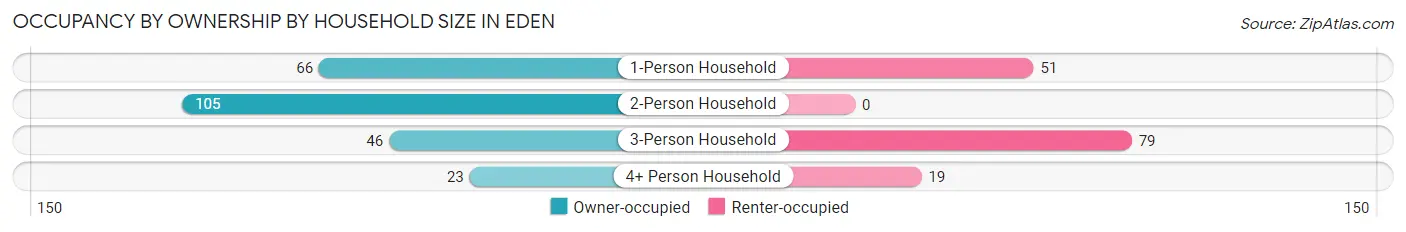
| Household Size | Owner-occupied | Renter-occupied |
| 1-Person Household | 66 (56.4%) | 51 (43.6%) |
| 2-Person Household | 105 (100.0%) | 0 (0.0%) |
| 3-Person Household | 46 (36.8%) | 79 (63.2%) |
| 4+ Person Household | 23 (54.8%) | 19 (45.2%) |
| Total Housing Units | 240 (61.7%) | 149 (38.3%) |
Occupancy by Educational Attainment in Eden
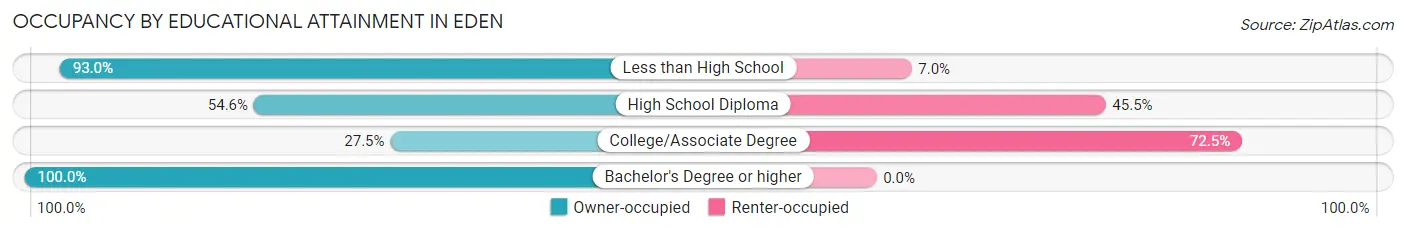
| Household Size | Owner-occupied | Renter-occupied |
| Less than High School | 120 (93.0%) | 9 (7.0%) |
| High School Diploma | 54 (54.5%) | 45 (45.5%) |
| College/Associate Degree | 36 (27.5%) | 95 (72.5%) |
| Bachelor's Degree or higher | 30 (100.0%) | 0 (0.0%) |
Occupancy by Age of Householder in Eden
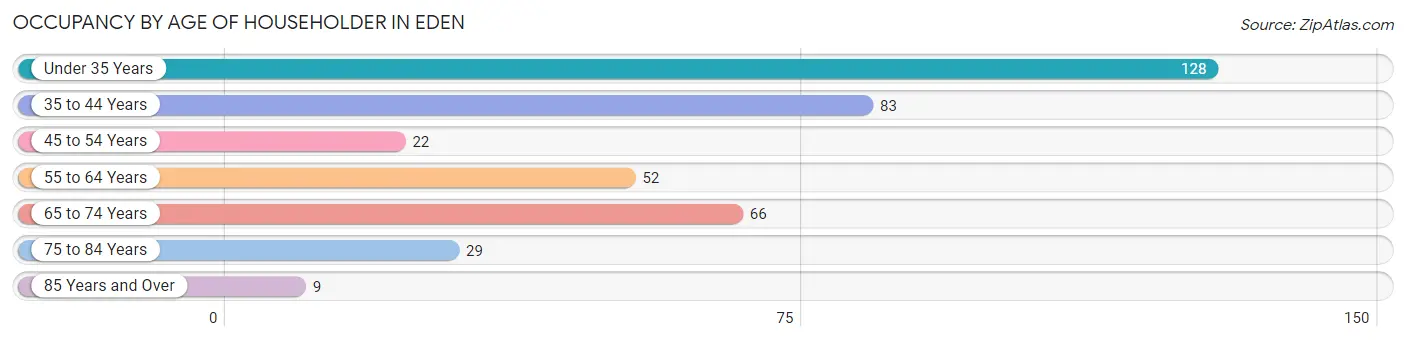
| Age Bracket | # Households | % Households |
| Under 35 Years | 128 | 32.9% |
| 35 to 44 Years | 83 | 21.3% |
| 45 to 54 Years | 22 | 5.7% |
| 55 to 64 Years | 52 | 13.4% |
| 65 to 74 Years | 66 | 17.0% |
| 75 to 84 Years | 29 | 7.5% |
| 85 Years and Over | 9 | 2.3% |
| Total | 389 | 100.0% |
Housing Finances in Eden
Median Income by Occupancy in Eden
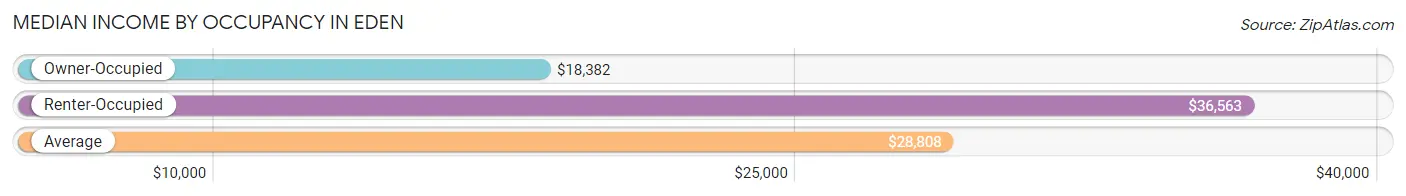
| Occupancy Type | # Households | Median Income |
| Owner-Occupied | 240 (61.7%) | $18,382 |
| Renter-Occupied | 149 (38.3%) | $36,563 |
| Average | 389 (100.0%) | $28,808 |
Occupancy by Householder Income Bracket in Eden
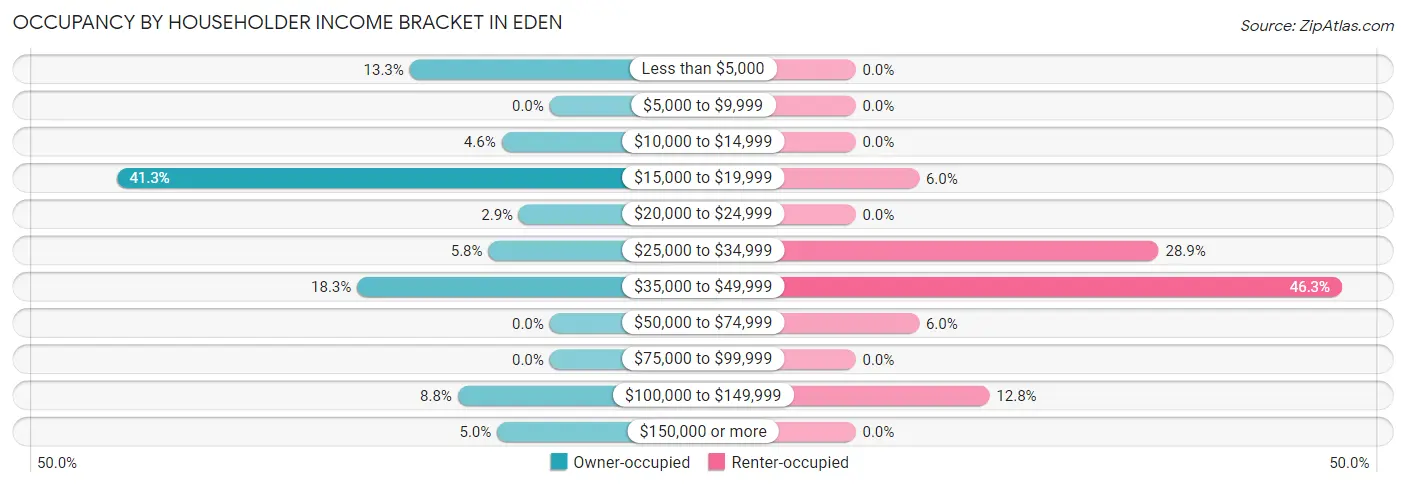
| Income Bracket | Owner-occupied | Renter-occupied |
| Less than $5,000 | 32 (13.3%) | 0 (0.0%) |
| $5,000 to $9,999 | 0 (0.0%) | 0 (0.0%) |
| $10,000 to $14,999 | 11 (4.6%) | 0 (0.0%) |
| $15,000 to $19,999 | 99 (41.2%) | 9 (6.0%) |
| $20,000 to $24,999 | 7 (2.9%) | 0 (0.0%) |
| $25,000 to $34,999 | 14 (5.8%) | 43 (28.9%) |
| $35,000 to $49,999 | 44 (18.3%) | 69 (46.3%) |
| $50,000 to $74,999 | 0 (0.0%) | 9 (6.0%) |
| $75,000 to $99,999 | 0 (0.0%) | 0 (0.0%) |
| $100,000 to $149,999 | 21 (8.7%) | 19 (12.8%) |
| $150,000 or more | 12 (5.0%) | 0 (0.0%) |
| Total | 240 (100.0%) | 149 (100.0%) |
Monthly Housing Cost Tiers in Eden
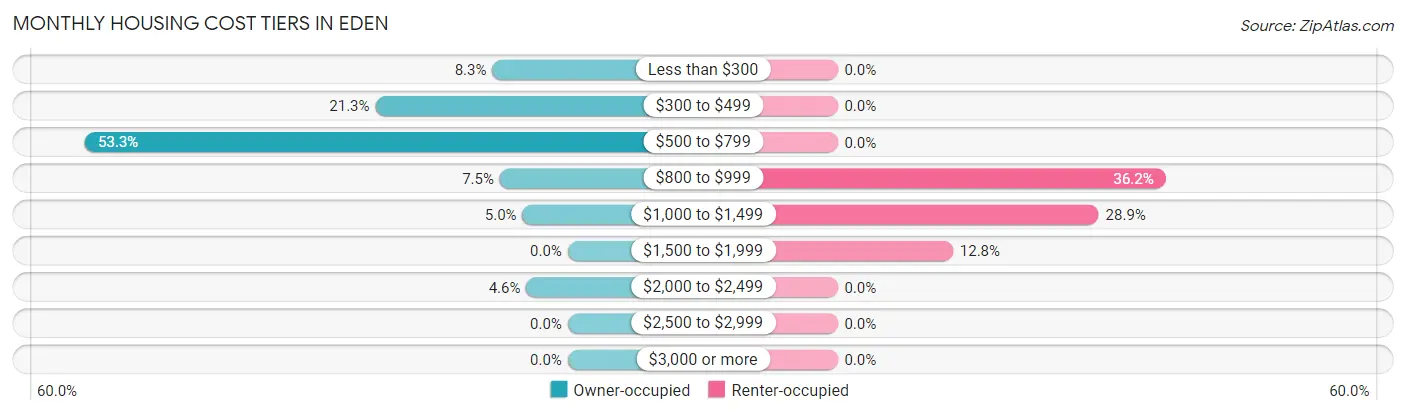
| Monthly Cost | Owner-occupied | Renter-occupied |
| Less than $300 | 20 (8.3%) | 0 (0.0%) |
| $300 to $499 | 51 (21.2%) | 0 (0.0%) |
| $500 to $799 | 128 (53.3%) | 0 (0.0%) |
| $800 to $999 | 18 (7.5%) | 54 (36.2%) |
| $1,000 to $1,499 | 12 (5.0%) | 43 (28.9%) |
| $1,500 to $1,999 | 0 (0.0%) | 19 (12.8%) |
| $2,000 to $2,499 | 11 (4.6%) | 0 (0.0%) |
| $2,500 to $2,999 | 0 (0.0%) | 0 (0.0%) |
| $3,000 or more | 0 (0.0%) | 0 (0.0%) |
| Total | 240 (100.0%) | 149 (100.0%) |
Physical Housing Characteristics in Eden
Housing Structures in Eden
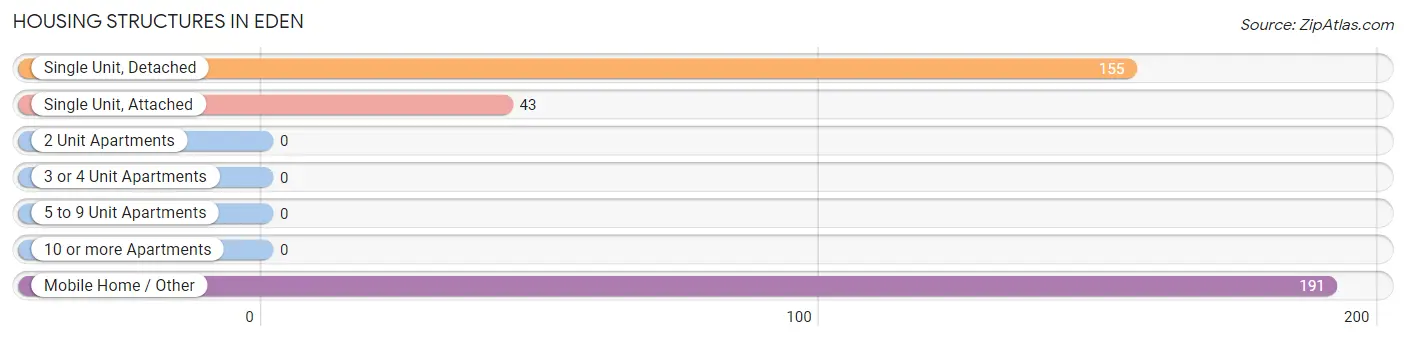
| Structure Type | # Housing Units | % Housing Units |
| Single Unit, Detached | 155 | 39.9% |
| Single Unit, Attached | 43 | 11.1% |
| 2 Unit Apartments | 0 | 0.0% |
| 3 or 4 Unit Apartments | 0 | 0.0% |
| 5 to 9 Unit Apartments | 0 | 0.0% |
| 10 or more Apartments | 0 | 0.0% |
| Mobile Home / Other | 191 | 49.1% |
| Total | 389 | 100.0% |
Housing Structures by Occupancy in Eden
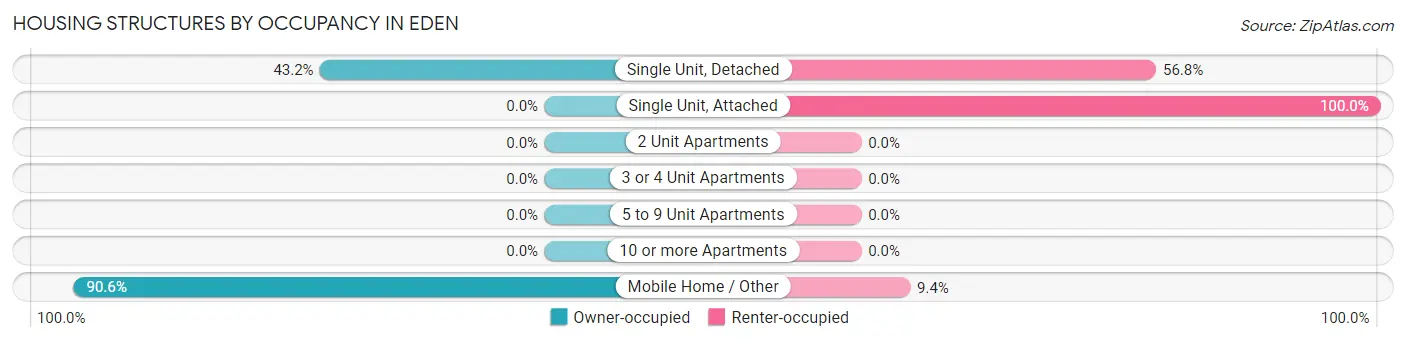
| Structure Type | Owner-occupied | Renter-occupied |
| Single Unit, Detached | 67 (43.2%) | 88 (56.8%) |
| Single Unit, Attached | 0 (0.0%) | 43 (100.0%) |
| 2 Unit Apartments | 0 (0.0%) | 0 (0.0%) |
| 3 or 4 Unit Apartments | 0 (0.0%) | 0 (0.0%) |
| 5 to 9 Unit Apartments | 0 (0.0%) | 0 (0.0%) |
| 10 or more Apartments | 0 (0.0%) | 0 (0.0%) |
| Mobile Home / Other | 173 (90.6%) | 18 (9.4%) |
| Total | 240 (61.7%) | 149 (38.3%) |
Housing Structures by Number of Rooms in Eden
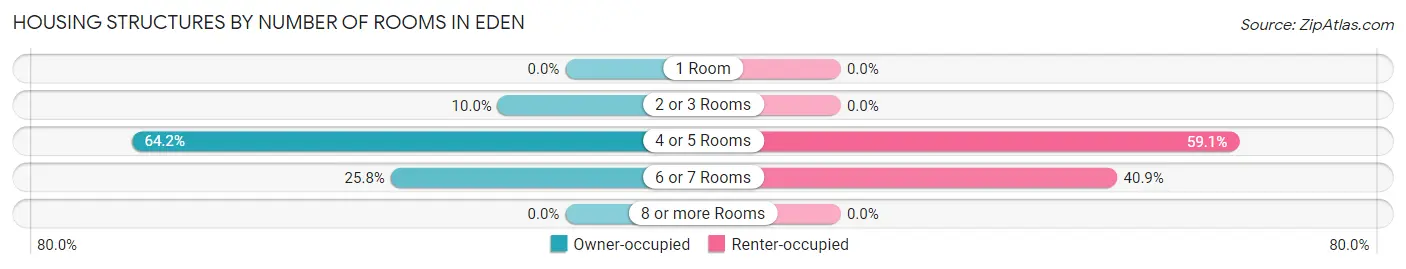
| Number of Rooms | Owner-occupied | Renter-occupied |
| 1 Room | 0 (0.0%) | 0 (0.0%) |
| 2 or 3 Rooms | 24 (10.0%) | 0 (0.0%) |
| 4 or 5 Rooms | 154 (64.2%) | 88 (59.1%) |
| 6 or 7 Rooms | 62 (25.8%) | 61 (40.9%) |
| 8 or more Rooms | 0 (0.0%) | 0 (0.0%) |
| Total | 240 (100.0%) | 149 (100.0%) |
Housing Structure by Heating Type in Eden
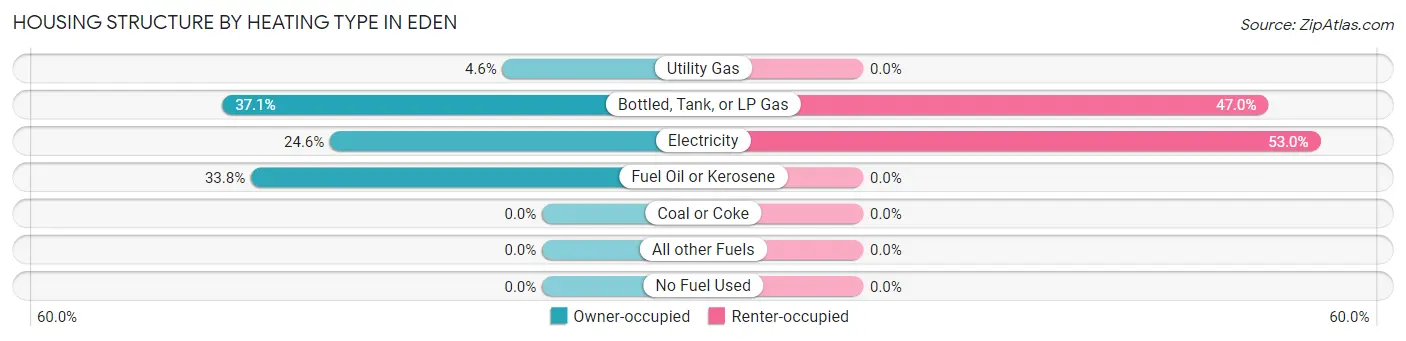
| Heating Type | Owner-occupied | Renter-occupied |
| Utility Gas | 11 (4.6%) | 0 (0.0%) |
| Bottled, Tank, or LP Gas | 89 (37.1%) | 70 (47.0%) |
| Electricity | 59 (24.6%) | 79 (53.0%) |
| Fuel Oil or Kerosene | 81 (33.8%) | 0 (0.0%) |
| Coal or Coke | 0 (0.0%) | 0 (0.0%) |
| All other Fuels | 0 (0.0%) | 0 (0.0%) |
| No Fuel Used | 0 (0.0%) | 0 (0.0%) |
| Total | 240 (100.0%) | 149 (100.0%) |
Household Vehicle Usage in Eden
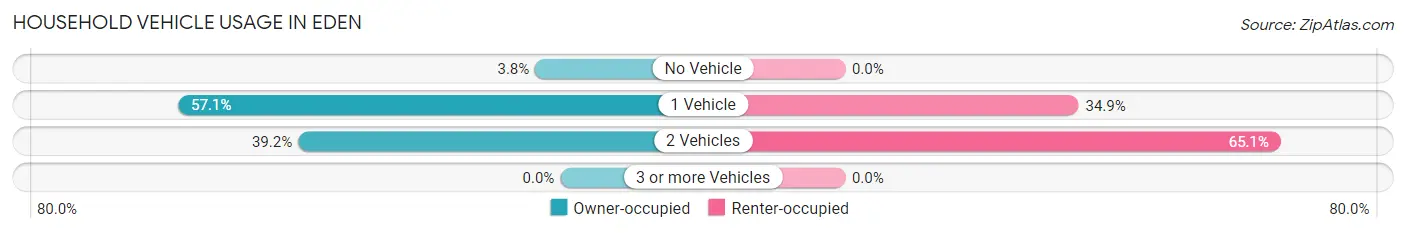
| Vehicles per Household | Owner-occupied | Renter-occupied |
| No Vehicle | 9 (3.7%) | 0 (0.0%) |
| 1 Vehicle | 137 (57.1%) | 52 (34.9%) |
| 2 Vehicles | 94 (39.2%) | 97 (65.1%) |
| 3 or more Vehicles | 0 (0.0%) | 0 (0.0%) |
| Total | 240 (100.0%) | 149 (100.0%) |
Real Estate & Mortgages in Eden
Real Estate and Mortgage Overview in Eden
| Characteristic | Without Mortgage | With Mortgage |
| Housing Units | 199 | 41 |
| Median Property Value | $13,600 | $161,800 |
| Median Household Income | $17,684 | $12 |
| Monthly Housing Costs | $612 | $0 |
| Real Estate Taxes | $804 | $0 |
Property Value by Mortgage Status in Eden
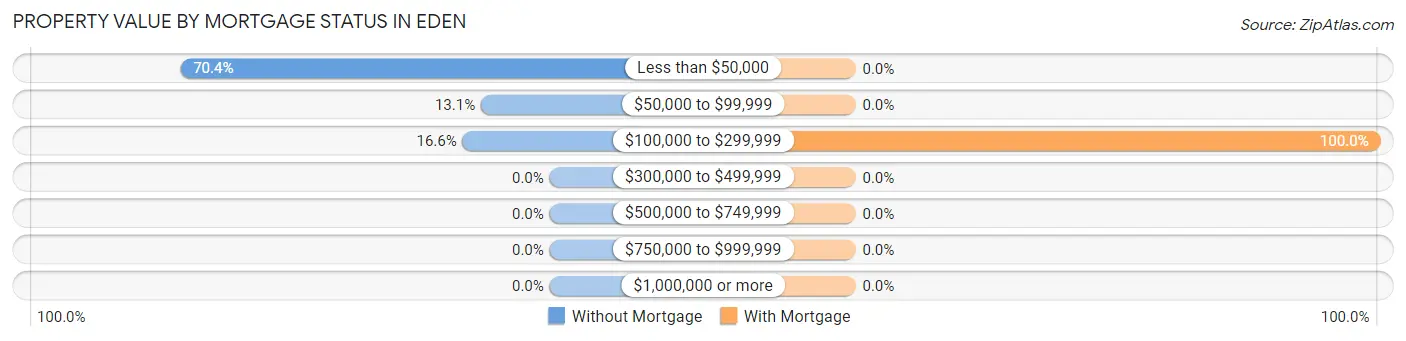
| Property Value | Without Mortgage | With Mortgage |
| Less than $50,000 | 140 (70.4%) | 0 (0.0%) |
| $50,000 to $99,999 | 26 (13.1%) | 0 (0.0%) |
| $100,000 to $299,999 | 33 (16.6%) | 41 (100.0%) |
| $300,000 to $499,999 | 0 (0.0%) | 0 (0.0%) |
| $500,000 to $749,999 | 0 (0.0%) | 0 (0.0%) |
| $750,000 to $999,999 | 0 (0.0%) | 0 (0.0%) |
| $1,000,000 or more | 0 (0.0%) | 0 (0.0%) |
| Total | 199 (100.0%) | 41 (100.0%) |
Household Income by Mortgage Status in Eden
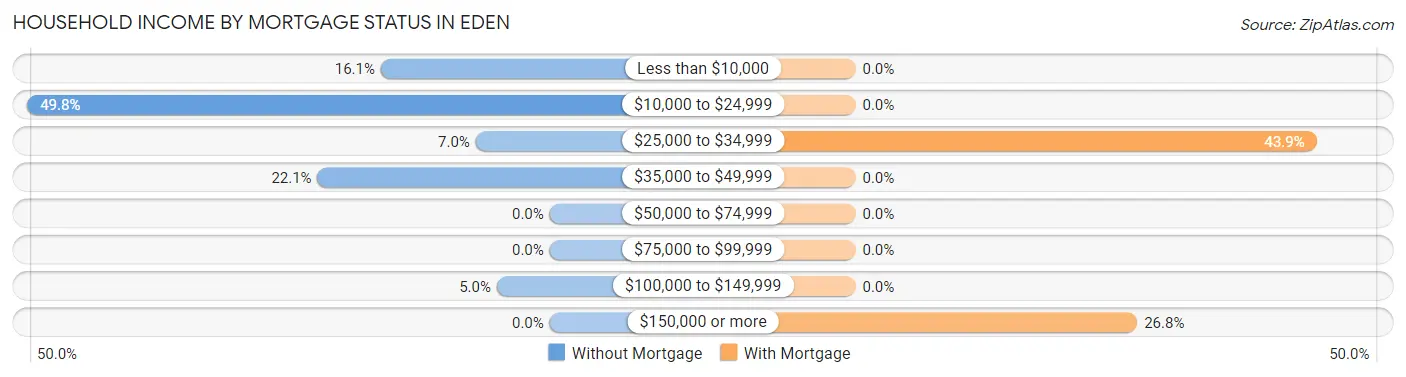
| Household Income | Without Mortgage | With Mortgage |
| Less than $10,000 | 32 (16.1%) | 0 (0.0%) |
| $10,000 to $24,999 | 99 (49.7%) | 0 (0.0%) |
| $25,000 to $34,999 | 14 (7.0%) | 18 (43.9%) |
| $35,000 to $49,999 | 44 (22.1%) | 0 (0.0%) |
| $50,000 to $74,999 | 0 (0.0%) | 0 (0.0%) |
| $75,000 to $99,999 | 0 (0.0%) | 0 (0.0%) |
| $100,000 to $149,999 | 10 (5.0%) | 0 (0.0%) |
| $150,000 or more | 0 (0.0%) | 11 (26.8%) |
| Total | 199 (100.0%) | 41 (100.0%) |
Property Value to Household Income Ratio in Eden
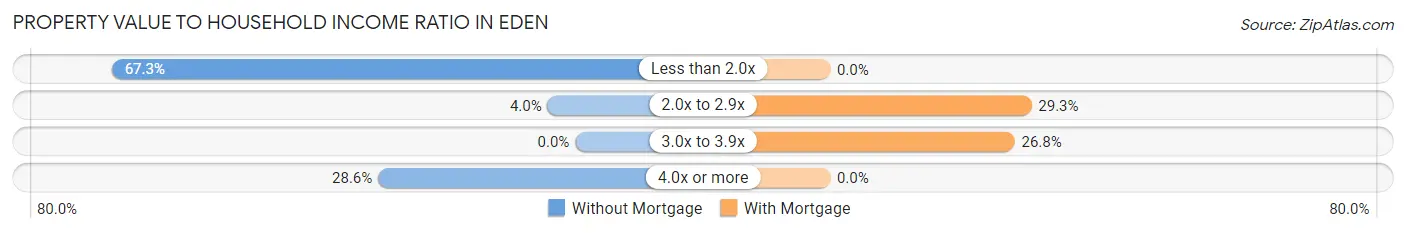
| Value-to-Income Ratio | Without Mortgage | With Mortgage |
| Less than 2.0x | 134 (67.3%) | 0 (0.0%) |
| 2.0x to 2.9x | 8 (4.0%) | 12 (29.3%) |
| 3.0x to 3.9x | 0 (0.0%) | 11 (26.8%) |
| 4.0x or more | 57 (28.6%) | 0 (0.0%) |
| Total | 199 (100.0%) | 41 (100.0%) |
Real Estate Taxes by Mortgage Status in Eden
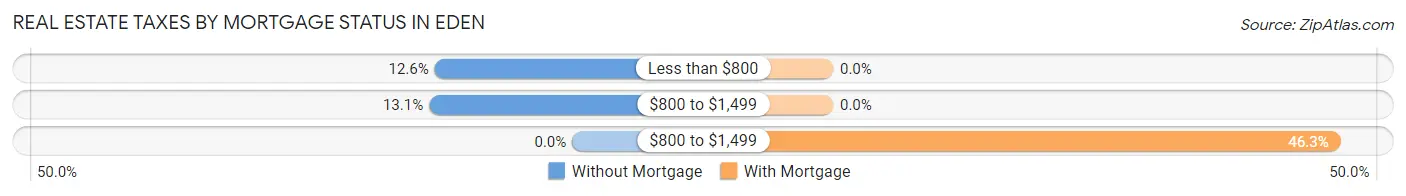
| Property Taxes | Without Mortgage | With Mortgage |
| Less than $800 | 25 (12.6%) | 0 (0.0%) |
| $800 to $1,499 | 26 (13.1%) | 0 (0.0%) |
| $800 to $1,499 | 0 (0.0%) | 19 (46.3%) |
| Total | 199 (100.0%) | 41 (100.0%) |
Health & Disability in Eden
Health Insurance Coverage by Age in Eden
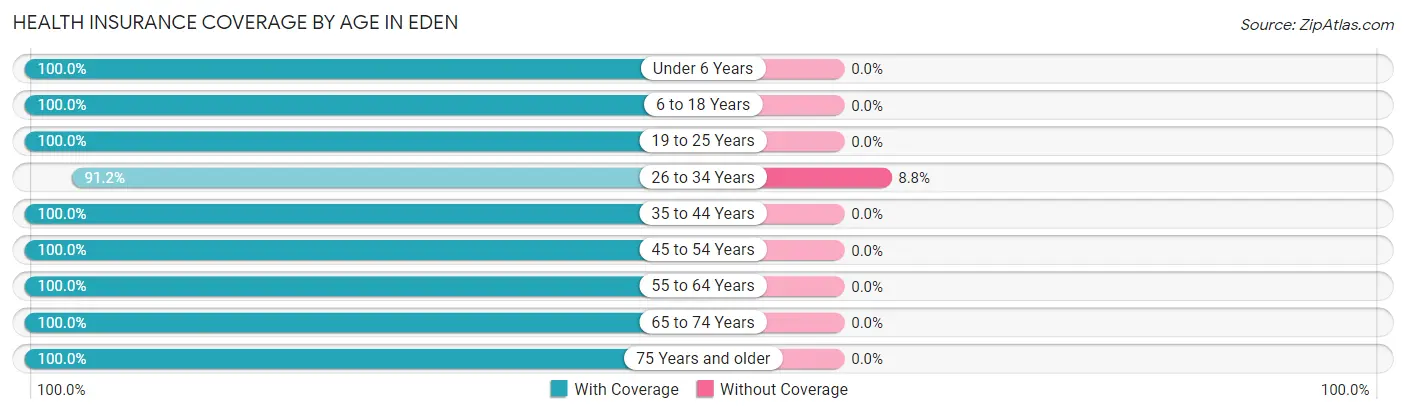
| Age Bracket | With Coverage | Without Coverage |
| Under 6 Years | 161 (100.0%) | 0 (0.0%) |
| 6 to 18 Years | 252 (100.0%) | 0 (0.0%) |
| 19 to 25 Years | 28 (100.0%) | 0 (0.0%) |
| 26 to 34 Years | 198 (91.2%) | 19 (8.8%) |
| 35 to 44 Years | 115 (100.0%) | 0 (0.0%) |
| 45 to 54 Years | 22 (100.0%) | 0 (0.0%) |
| 55 to 64 Years | 109 (100.0%) | 0 (0.0%) |
| 65 to 74 Years | 66 (100.0%) | 0 (0.0%) |
| 75 Years and older | 38 (100.0%) | 0 (0.0%) |
| Total | 989 (98.1%) | 19 (1.9%) |
Health Insurance Coverage by Citizenship Status in Eden
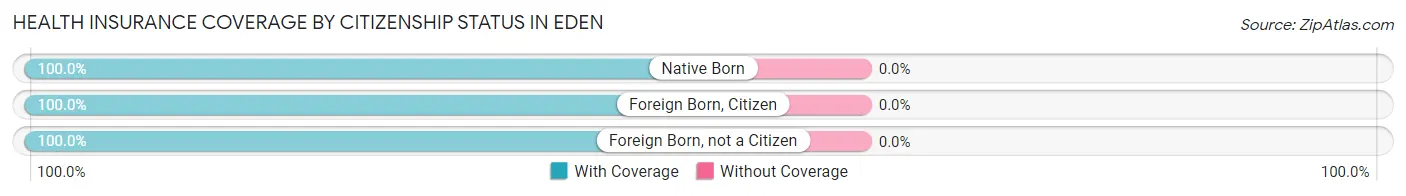
| Citizenship Status | With Coverage | Without Coverage |
| Native Born | 161 (100.0%) | 0 (0.0%) |
| Foreign Born, Citizen | 252 (100.0%) | 0 (0.0%) |
| Foreign Born, not a Citizen | 28 (100.0%) | 0 (0.0%) |
Health Insurance Coverage by Household Income in Eden
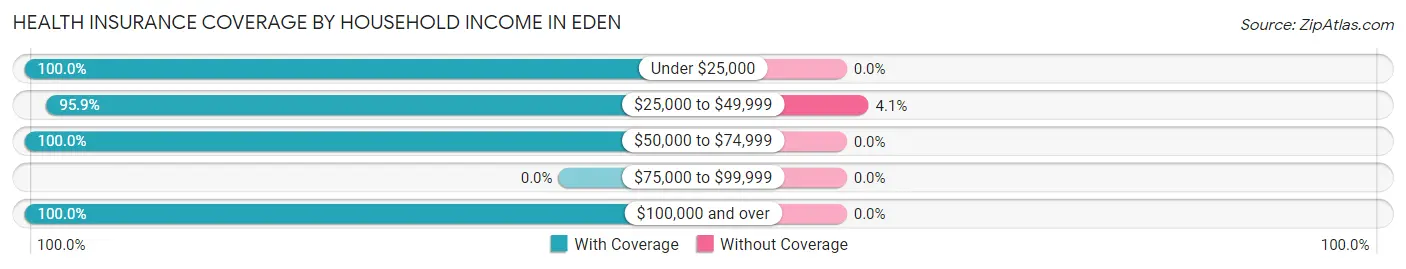
| Household Income | With Coverage | Without Coverage |
| Under $25,000 | 266 (100.0%) | 0 (0.0%) |
| $25,000 to $49,999 | 447 (95.9%) | 19 (4.1%) |
| $50,000 to $74,999 | 9 (100.0%) | 0 (0.0%) |
| $75,000 to $99,999 | 0 (0.0%) | 0 (0.0%) |
| $100,000 and over | 267 (100.0%) | 0 (0.0%) |
Public vs Private Health Insurance Coverage by Age in Eden
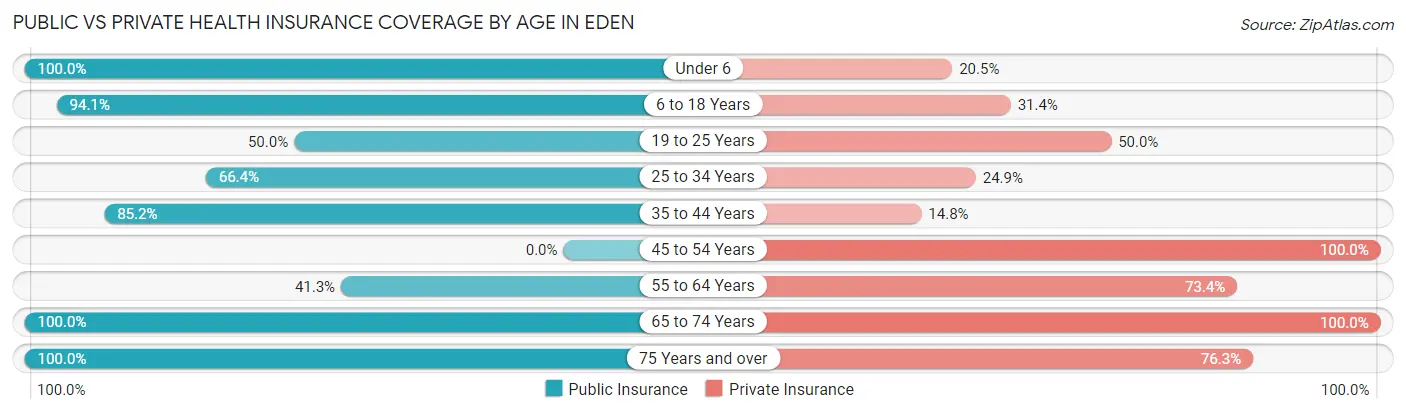
| Age Bracket | Public Insurance | Private Insurance |
| Under 6 | 161 (100.0%) | 33 (20.5%) |
| 6 to 18 Years | 237 (94.1%) | 79 (31.4%) |
| 19 to 25 Years | 14 (50.0%) | 14 (50.0%) |
| 25 to 34 Years | 144 (66.4%) | 54 (24.9%) |
| 35 to 44 Years | 98 (85.2%) | 17 (14.8%) |
| 45 to 54 Years | 0 (0.0%) | 22 (100.0%) |
| 55 to 64 Years | 45 (41.3%) | 80 (73.4%) |
| 65 to 74 Years | 66 (100.0%) | 66 (100.0%) |
| 75 Years and over | 38 (100.0%) | 29 (76.3%) |
| Total | 803 (79.7%) | 394 (39.1%) |
Disability Status by Sex by Age in Eden
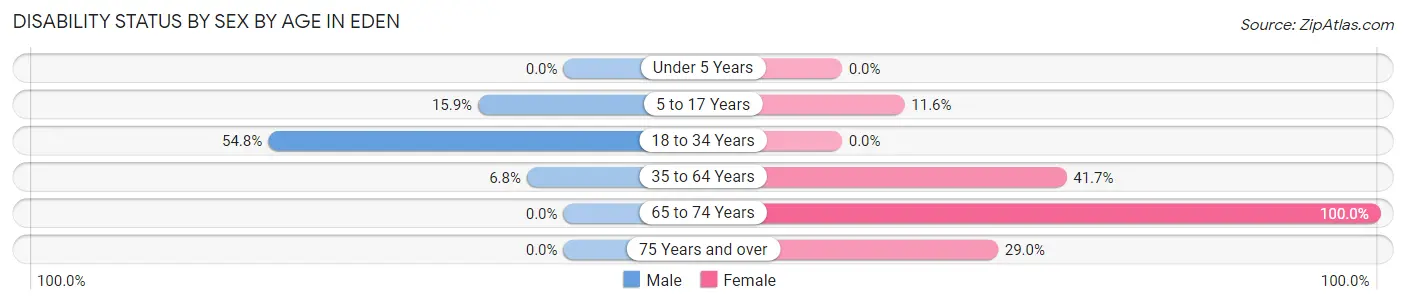
| Age Bracket | Male | Female |
| Under 5 Years | 0 (0.0%) | 0 (0.0%) |
| 5 to 17 Years | 13 (15.9%) | 18 (11.6%) |
| 18 to 34 Years | 57 (54.8%) | 0 (0.0%) |
| 35 to 64 Years | 11 (6.8%) | 35 (41.7%) |
| 65 to 74 Years | 0 (0.0%) | 8 (100.0%) |
| 75 Years and over | 0 (0.0%) | 11 (28.9%) |
Disability Class by Sex by Age in Eden
Disability Class: Hearing Difficulty
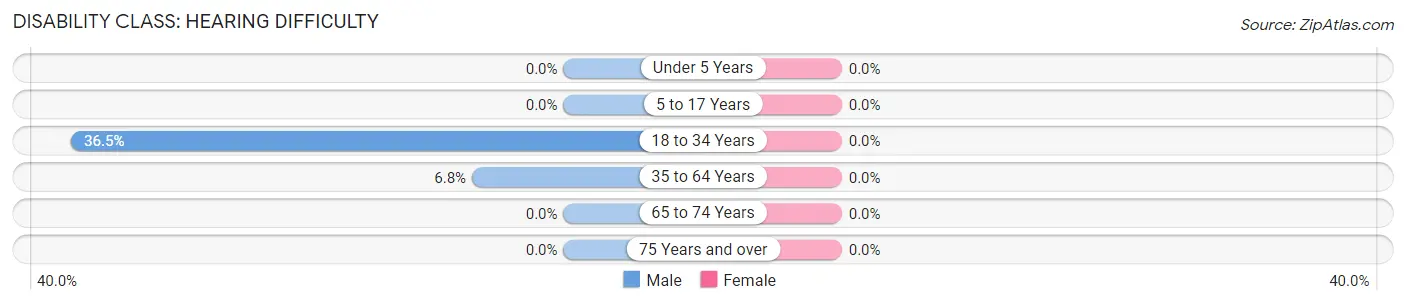
| Age Bracket | Male | Female |
| Under 5 Years | 0 (0.0%) | 0 (0.0%) |
| 5 to 17 Years | 0 (0.0%) | 0 (0.0%) |
| 18 to 34 Years | 38 (36.5%) | 0 (0.0%) |
| 35 to 64 Years | 11 (6.8%) | 0 (0.0%) |
| 65 to 74 Years | 0 (0.0%) | 0 (0.0%) |
| 75 Years and over | 0 (0.0%) | 0 (0.0%) |
Disability Class: Vision Difficulty
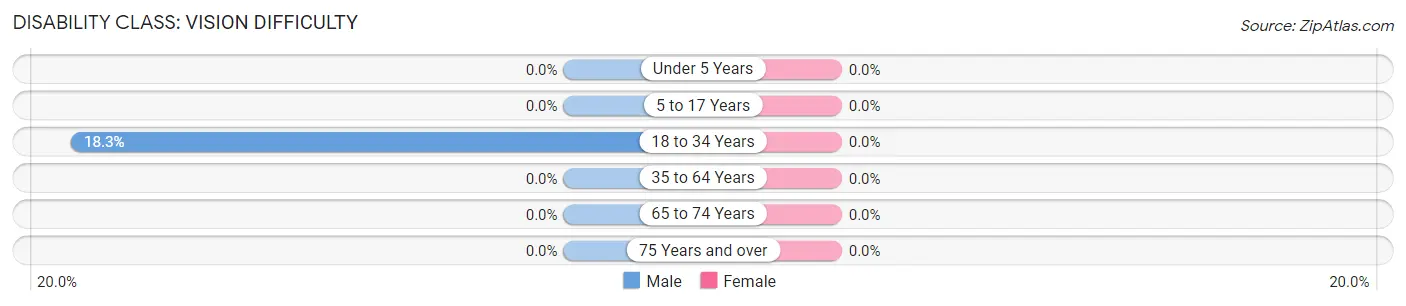
| Age Bracket | Male | Female |
| Under 5 Years | 0 (0.0%) | 0 (0.0%) |
| 5 to 17 Years | 0 (0.0%) | 0 (0.0%) |
| 18 to 34 Years | 19 (18.3%) | 0 (0.0%) |
| 35 to 64 Years | 0 (0.0%) | 0 (0.0%) |
| 65 to 74 Years | 0 (0.0%) | 0 (0.0%) |
| 75 Years and over | 0 (0.0%) | 0 (0.0%) |
Disability Class: Cognitive Difficulty
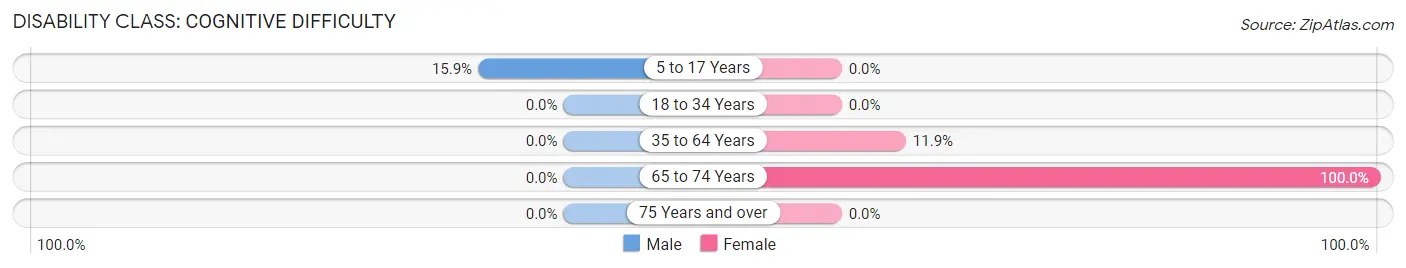
| Age Bracket | Male | Female |
| 5 to 17 Years | 13 (15.9%) | 0 (0.0%) |
| 18 to 34 Years | 0 (0.0%) | 0 (0.0%) |
| 35 to 64 Years | 0 (0.0%) | 10 (11.9%) |
| 65 to 74 Years | 0 (0.0%) | 8 (100.0%) |
| 75 Years and over | 0 (0.0%) | 0 (0.0%) |
Disability Class: Ambulatory Difficulty
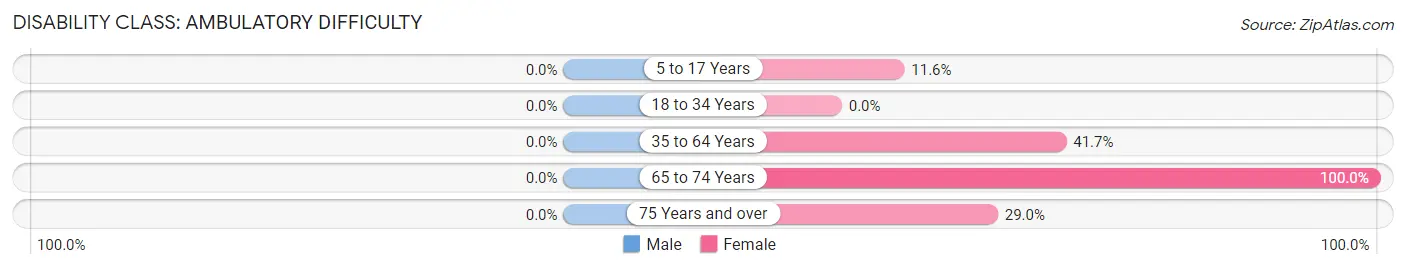
| Age Bracket | Male | Female |
| 5 to 17 Years | 0 (0.0%) | 18 (11.6%) |
| 18 to 34 Years | 0 (0.0%) | 0 (0.0%) |
| 35 to 64 Years | 0 (0.0%) | 35 (41.7%) |
| 65 to 74 Years | 0 (0.0%) | 8 (100.0%) |
| 75 Years and over | 0 (0.0%) | 11 (28.9%) |
Disability Class: Self-Care Difficulty
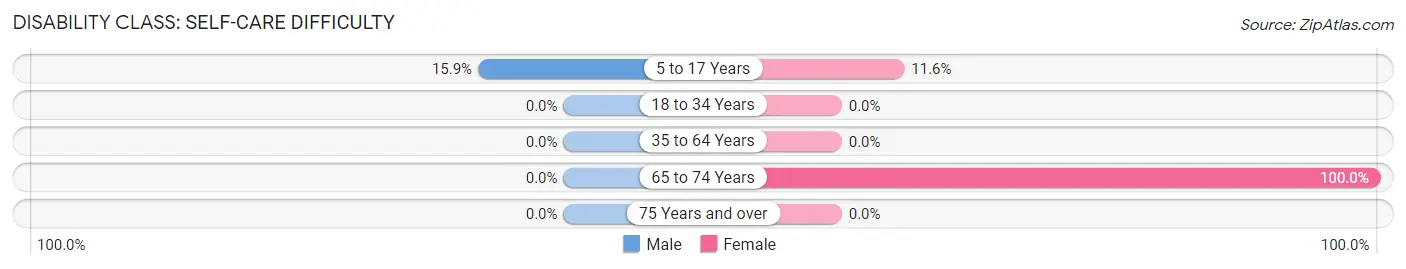
| Age Bracket | Male | Female |
| 5 to 17 Years | 13 (15.9%) | 18 (11.6%) |
| 18 to 34 Years | 0 (0.0%) | 0 (0.0%) |
| 35 to 64 Years | 0 (0.0%) | 0 (0.0%) |
| 65 to 74 Years | 0 (0.0%) | 8 (100.0%) |
| 75 Years and over | 0 (0.0%) | 0 (0.0%) |
Technology Access in Eden
Computing Device Access in Eden
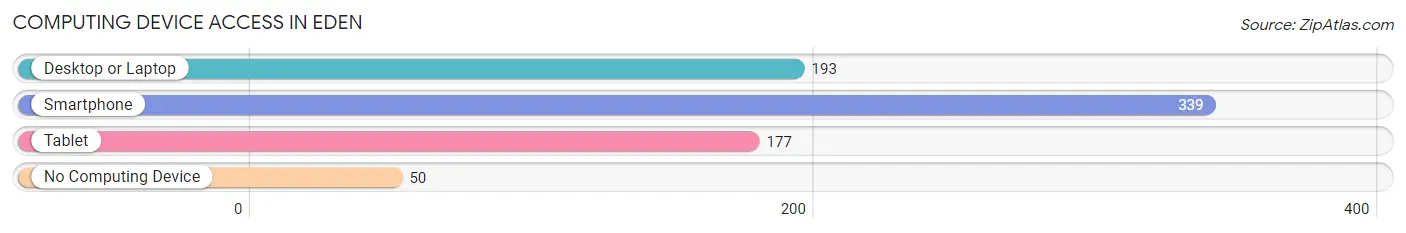
| Device Type | # Households | % Households |
| Desktop or Laptop | 193 | 49.6% |
| Smartphone | 339 | 87.2% |
| Tablet | 177 | 45.5% |
| No Computing Device | 50 | 12.9% |
| Total | 389 | 100.0% |
Internet Access in Eden
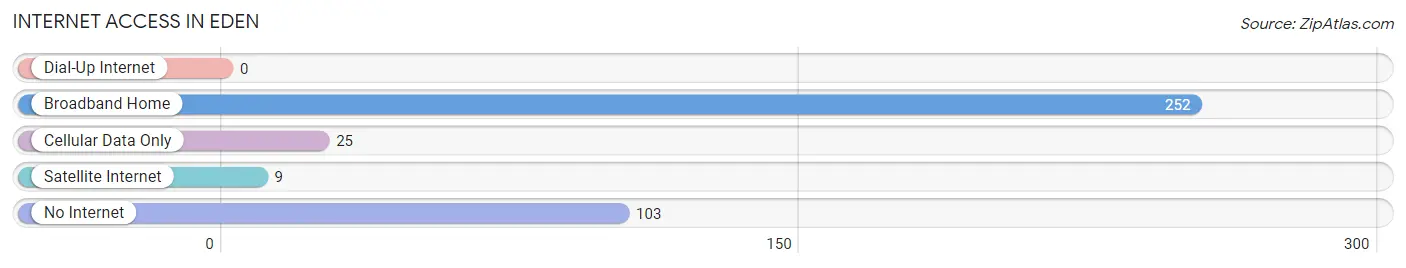
| Internet Type | # Households | % Households |
| Dial-Up Internet | 0 | 0.0% |
| Broadband Home | 252 | 64.8% |
| Cellular Data Only | 25 | 6.4% |
| Satellite Internet | 9 | 2.3% |
| No Internet | 103 | 26.5% |
| Total | 389 | 100.0% |
Eden Summary
Eden is a town located in Maryland, United States. It is situated in the northern part of the state, in the county of Caroline. The town has a population of approximately 1,500 people, according to the 2010 census.
Geography
Eden is located in the northern part of Maryland, in Caroline County. It is situated on the Choptank River, which is a tributary of the Chesapeake Bay. The town is bordered by the towns of Denton, Greensboro, and Preston. The town is located in a rural area, with a total area of 1.2 square miles. The terrain is mostly flat, with some rolling hills.
History
Eden was first settled in the early 1700s by English settlers. The town was originally known as "Eden's Neck," and was named after the biblical Garden of Eden. The town was incorporated in 1867.
In the late 1800s, the town was a major center for the production of oysters. The oyster industry was a major source of income for the town, and it was also a major employer. The oyster industry declined in the early 1900s, and the town began to focus on other industries, such as farming and timber.
Economy
Eden's economy is largely based on agriculture and timber. The town is home to several farms, which produce a variety of crops, including corn, soybeans, and wheat. The town also has several timber companies, which harvest and process timber for use in construction and other industries.
The town also has several small businesses, including restaurants, retail stores, and service providers. The town is also home to a few small manufacturing companies, which produce a variety of products, including furniture and clothing.
Demographics
According to the 2010 census, the population of Eden was 1,500. The town is predominantly white, with a small African American population. The median household income is $45,000, and the median age is 40.
Conclusion
Eden is a small town located in Maryland, United States. It is situated in the northern part of the state, in the county of Caroline. The town has a population of approximately 1,500 people, according to the 2010 census. The town's economy is largely based on agriculture and timber, and it is home to several small businesses. The town is predominantly white, with a small African American population.
Common Questions
What is Per Capita Income in Eden?
Per Capita income in Eden is $16,555.
What is the Median Family Income in Eden?
Median Family Income in Eden is $19,340.
What is the Median Household income in Eden?
Median Household Income in Eden is $28,808.
What is Inequality or Gini Index in Eden?
Inequality or Gini Index in Eden is 0.44.
What is the Total Population of Eden?
Total Population of Eden is 1,008.
What is the Total Male Population of Eden?
Total Male Population of Eden is 513.
What is the Total Female Population of Eden?
Total Female Population of Eden is 495.
What is the Ratio of Males per 100 Females in Eden?
There are 103.64 Males per 100 Females in Eden.
What is the Ratio of Females per 100 Males in Eden?
There are 96.49 Females per 100 Males in Eden.
What is the Median Population Age in Eden?
Median Population Age in Eden is 29.2 Years.
What is the Average Family Size in Eden
Average Family Size in Eden is 3.2 People.
What is the Average Household Size in Eden
Average Household Size in Eden is 2.6 People.
How Large is the Labor Force in Eden?
There are 368 People in the Labor Forcein in Eden.
What is the Percentage of People in the Labor Force in Eden?
60.3% of People are in the Labor Force in Eden.
What is the Unemployment Rate in Eden?
Unemployment Rate in Eden is 10.3%.