Pittsville, MD Map & Demographics
Pittsville Map
Pittsville Overview
$29,513
PER CAPITA INCOME
$81,912
AVG FAMILY INCOME
$68,594
AVG HOUSEHOLD INCOME
33.9%
WAGE / INCOME GAP [ % ]
66.1¢/ $1
WAGE / INCOME GAP [ $ ]
$6,456
FAMILY INCOME DEFICIT
0.33
INEQUALITY / GINI INDEX
2,205
TOTAL POPULATION
1,179
MALE POPULATION
1,026
FEMALE POPULATION
114.91
MALES / 100 FEMALES
87.02
FEMALES / 100 MALES
39.2
MEDIAN AGE
3.0
AVG FAMILY SIZE
2.4
AVG HOUSEHOLD SIZE
1,108
LABOR FORCE [ PEOPLE ]
62.8%
PERCENT IN LABOR FORCE
3.3%
UNEMPLOYMENT RATE
Pittsville Zip Codes
Pittsville Area Codes
Income in Pittsville
Income Overview in Pittsville
Per Capita Income in Pittsville is $29,513, while median incomes of families and households are $81,912 and $68,594 respectively.
| Characteristic | Number | Measure |
| Per Capita Income | 2,205 | $29,513 |
| Median Family Income | 542 | $81,912 |
| Mean Family Income | 542 | $83,736 |
| Median Household Income | 913 | $68,594 |
| Mean Household Income | 913 | $73,227 |
| Income Deficit | 542 | $6,456 |
| Wage / Income Gap (%) | 2,205 | 33.86% |
| Wage / Income Gap ($) | 2,205 | 66.14¢ per $1 |
| Gini / Inequality Index | 2,205 | 0.33 |
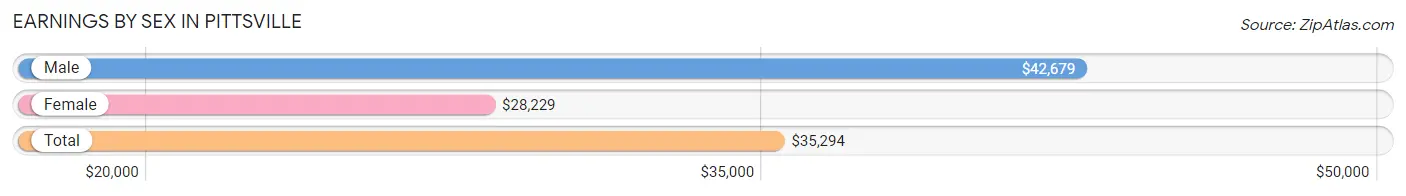
Earnings by Sex in Pittsville
Average Earnings in Pittsville are $35,294, $42,679 for men and $28,229 for women, a difference of 33.9%.
| Sex | Number | Average Earnings |
| Male | 555 (48.7%) | $42,679 |
| Female | 585 (51.3%) | $28,229 |
| Total | 1,140 (100.0%) | $35,294 |
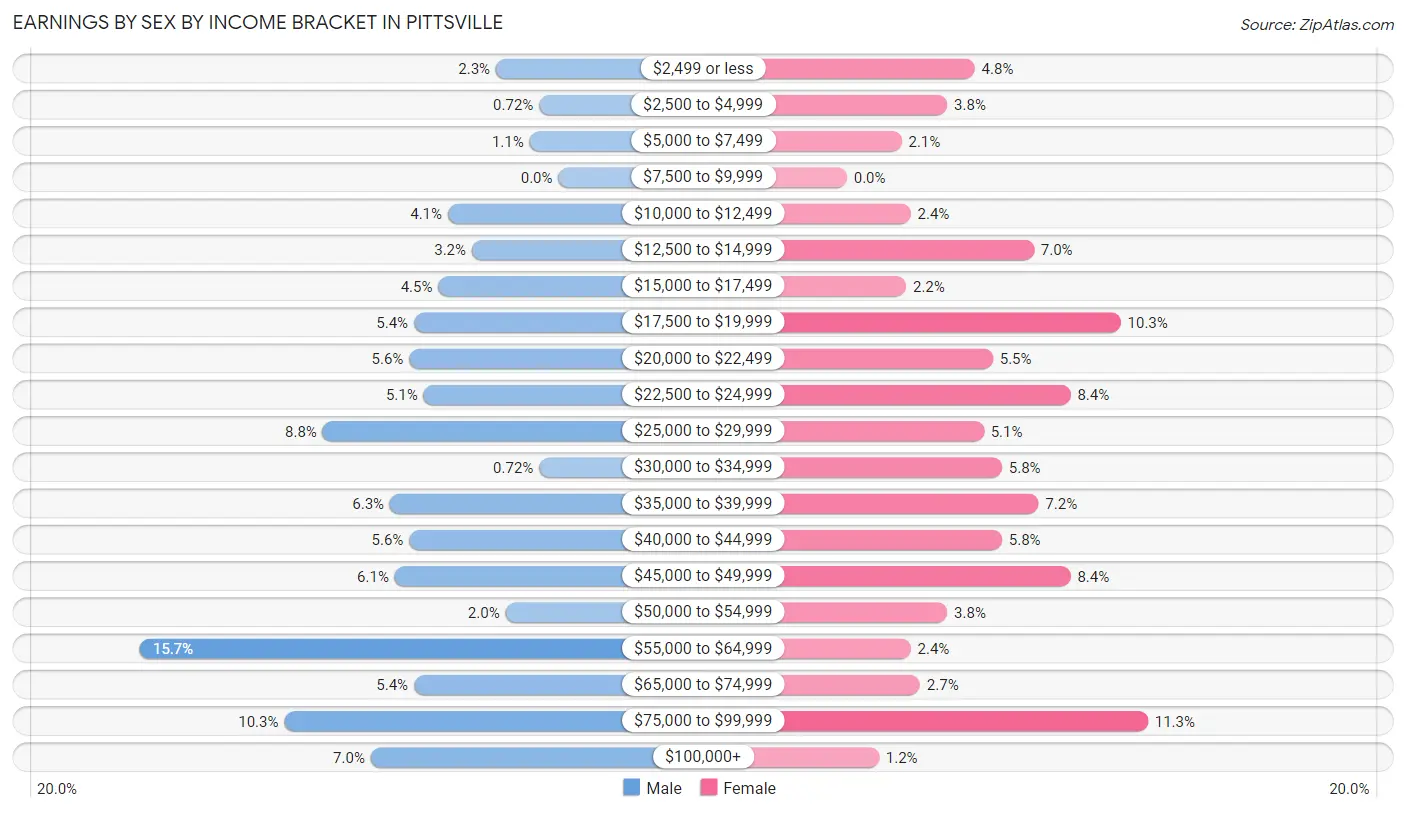
Earnings by Sex by Income Bracket in Pittsville
The most common earnings brackets in Pittsville are $55,000 to $64,999 for men (87 | 15.7%) and $75,000 to $99,999 for women (66 | 11.3%).
| Income | Male | Female |
| $2,499 or less | 13 (2.3%) | 28 (4.8%) |
| $2,500 to $4,999 | 4 (0.7%) | 22 (3.8%) |
| $5,000 to $7,499 | 6 (1.1%) | 12 (2.1%) |
| $7,500 to $9,999 | 0 (0.0%) | 0 (0.0%) |
| $10,000 to $12,499 | 23 (4.1%) | 14 (2.4%) |
| $12,500 to $14,999 | 18 (3.2%) | 41 (7.0%) |
| $15,000 to $17,499 | 25 (4.5%) | 13 (2.2%) |
| $17,500 to $19,999 | 30 (5.4%) | 60 (10.3%) |
| $20,000 to $22,499 | 31 (5.6%) | 32 (5.5%) |
| $22,500 to $24,999 | 28 (5.1%) | 49 (8.4%) |
| $25,000 to $29,999 | 49 (8.8%) | 30 (5.1%) |
| $30,000 to $34,999 | 4 (0.7%) | 34 (5.8%) |
| $35,000 to $39,999 | 35 (6.3%) | 42 (7.2%) |
| $40,000 to $44,999 | 31 (5.6%) | 34 (5.8%) |
| $45,000 to $49,999 | 34 (6.1%) | 49 (8.4%) |
| $50,000 to $54,999 | 11 (2.0%) | 22 (3.8%) |
| $55,000 to $64,999 | 87 (15.7%) | 14 (2.4%) |
| $65,000 to $74,999 | 30 (5.4%) | 16 (2.7%) |
| $75,000 to $99,999 | 57 (10.3%) | 66 (11.3%) |
| $100,000+ | 39 (7.0%) | 7 (1.2%) |
| Total | 555 (100.0%) | 585 (100.0%) |
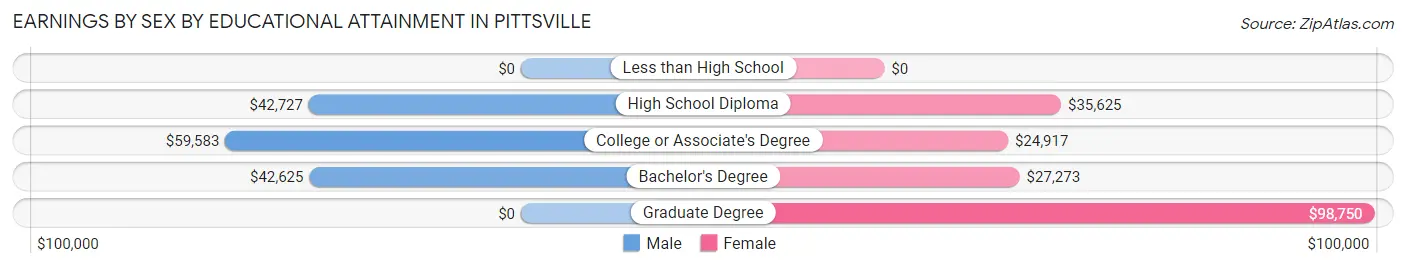
Earnings by Sex by Educational Attainment in Pittsville
Average earnings in Pittsville are $49,091 for men and $33,636 for women, a difference of 31.5%. Men with an educational attainment of college or associate's degree enjoy the highest average annual earnings of $59,583, while those with bachelor's degree education earn the least with $42,625. Women with an educational attainment of graduate degree earn the most with the average annual earnings of $98,750, while those with college or associate's degree education have the smallest earnings of $24,917.
| Educational Attainment | Male Income | Female Income |
| Less than High School | - | - |
| High School Diploma | $42,727 | $35,625 |
| College or Associate's Degree | $59,583 | $24,917 |
| Bachelor's Degree | $42,625 | $27,273 |
| Graduate Degree | - | - |
| Total | $49,091 | $33,636 |
Family Income in Pittsville
Family Income Brackets in Pittsville
According to the Pittsville family income data, there are 131 families falling into the $100,000 to $149,999 income range, which is the most common income bracket and makes up 24.2% of all families. Conversely, the less than $10,000 income bracket is the least frequent group with only 5 families (0.9%) belonging to this category.
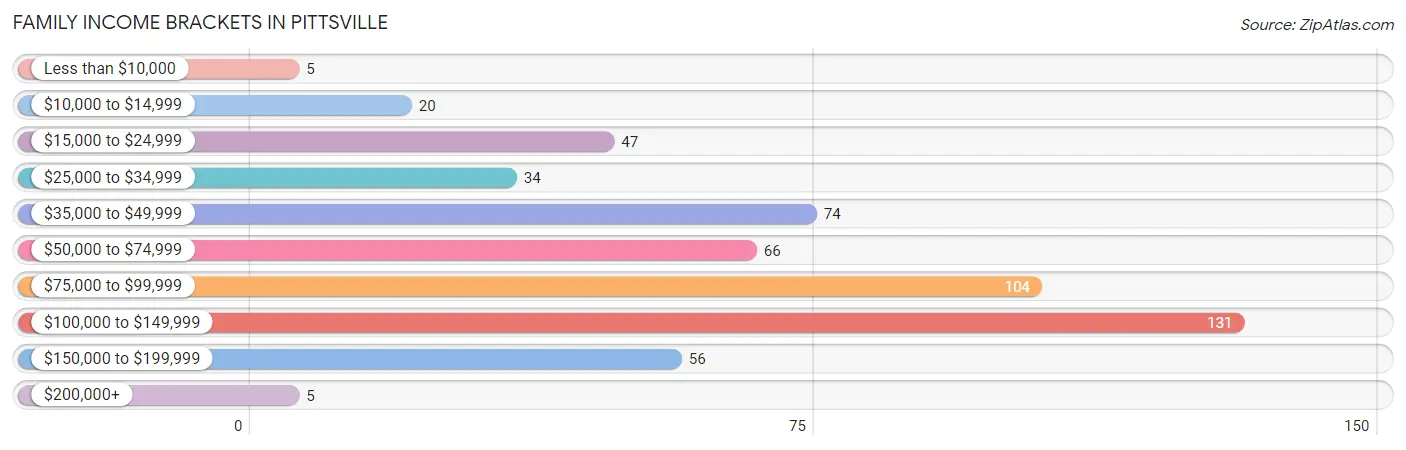
| Income Bracket | # Families | % Families |
| Less than $10,000 | 5 | 0.9% |
| $10,000 to $14,999 | 20 | 3.7% |
| $15,000 to $24,999 | 47 | 8.7% |
| $25,000 to $34,999 | 34 | 6.3% |
| $35,000 to $49,999 | 74 | 13.7% |
| $50,000 to $74,999 | 66 | 12.2% |
| $75,000 to $99,999 | 104 | 19.2% |
| $100,000 to $149,999 | 131 | 24.2% |
| $150,000 to $199,999 | 56 | 10.3% |
| $200,000+ | 5 | 0.9% |
Family Income by Famaliy Size in Pittsville
4-person families (104 | 19.2%) account for the highest median family income in Pittsville with $91,190 per family, while 2-person families (223 | 41.1%) have the highest median income of $34,875 per family member.
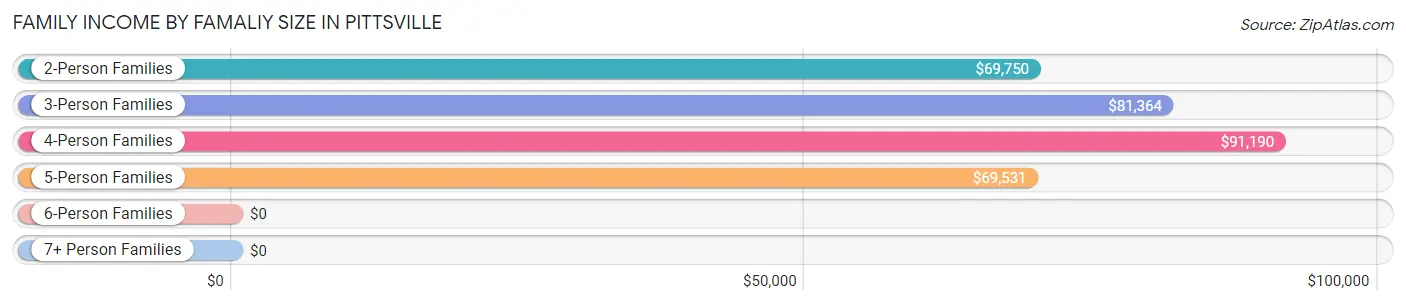
| Income Bracket | # Families | Median Income |
| 2-Person Families | 223 (41.1%) | $69,750 |
| 3-Person Families | 164 (30.3%) | $81,364 |
| 4-Person Families | 104 (19.2%) | $91,190 |
| 5-Person Families | 32 (5.9%) | $69,531 |
| 6-Person Families | 0 (0.0%) | $0 |
| 7+ Person Families | 19 (3.5%) | $0 |
| Total | 542 (100.0%) | $81,912 |
Family Income by Number of Earners in Pittsville
The median family income in Pittsville is $81,912, with families comprising 3+ earners (87) having the highest median family income of $99,861, while families with 1 earner (159) have the lowest median family income of $40,375, accounting for 16.1% and 29.3% of families, respectively.
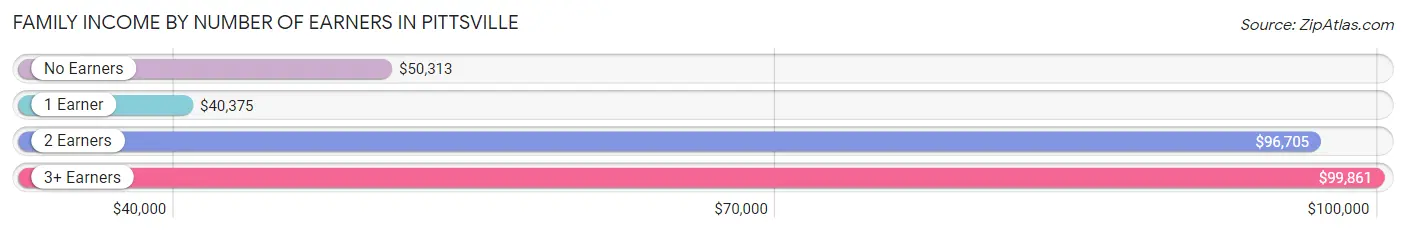
| Number of Earners | # Families | Median Income |
| No Earners | 59 (10.9%) | $50,313 |
| 1 Earner | 159 (29.3%) | $40,375 |
| 2 Earners | 237 (43.7%) | $96,705 |
| 3+ Earners | 87 (16.1%) | $99,861 |
| Total | 542 (100.0%) | $81,912 |
Household Income in Pittsville
Household Income Brackets in Pittsville
With 251 households falling in the category, the $50,000 to $74,999 income range is the most frequent in Pittsville, accounting for 27.5% of all households. In contrast, only 20 households (2.2%) fall into the $10,000 to $14,999 income bracket, making it the least populous group.
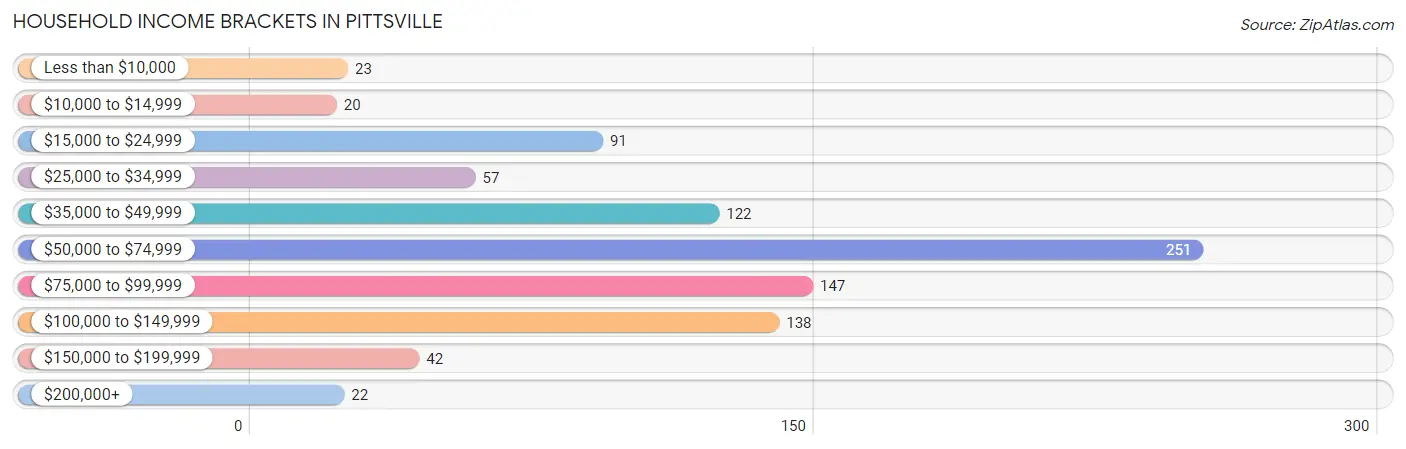
| Income Bracket | # Households | % Households |
| Less than $10,000 | 23 | 2.5% |
| $10,000 to $14,999 | 20 | 2.2% |
| $15,000 to $24,999 | 91 | 10.0% |
| $25,000 to $34,999 | 57 | 6.2% |
| $35,000 to $49,999 | 122 | 13.4% |
| $50,000 to $74,999 | 251 | 27.5% |
| $75,000 to $99,999 | 147 | 16.1% |
| $100,000 to $149,999 | 138 | 15.1% |
| $150,000 to $199,999 | 42 | 4.6% |
| $200,000+ | 22 | 2.4% |
Household Income by Householder Age in Pittsville
The median household income in Pittsville is $68,594, with the highest median household income of $77,321 found in the 45 to 64 years age bracket for the primary householder. A total of 375 households (41.1%) fall into this category. Meanwhile, the 15 to 24 years age bracket for the primary householder has the lowest median household income of $0, with 36 households (3.9%) in this group.
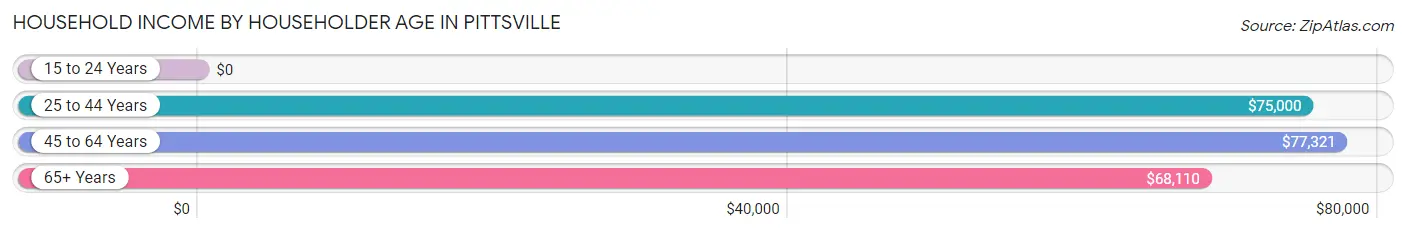
| Income Bracket | # Households | Median Income |
| 15 to 24 Years | 36 (3.9%) | $0 |
| 25 to 44 Years | 226 (24.7%) | $75,000 |
| 45 to 64 Years | 375 (41.1%) | $77,321 |
| 65+ Years | 276 (30.2%) | $68,110 |
| Total | 913 (100.0%) | $68,594 |
Poverty in Pittsville
Income Below Poverty by Sex and Age in Pittsville
With 7.2% poverty level for males and 17.0% for females among the residents of Pittsville, 12 to 14 year old males and under 5 year old females are the most vulnerable to poverty, with 19 males (38.8%) and 48 females (60.0%) in their respective age groups living below the poverty level.
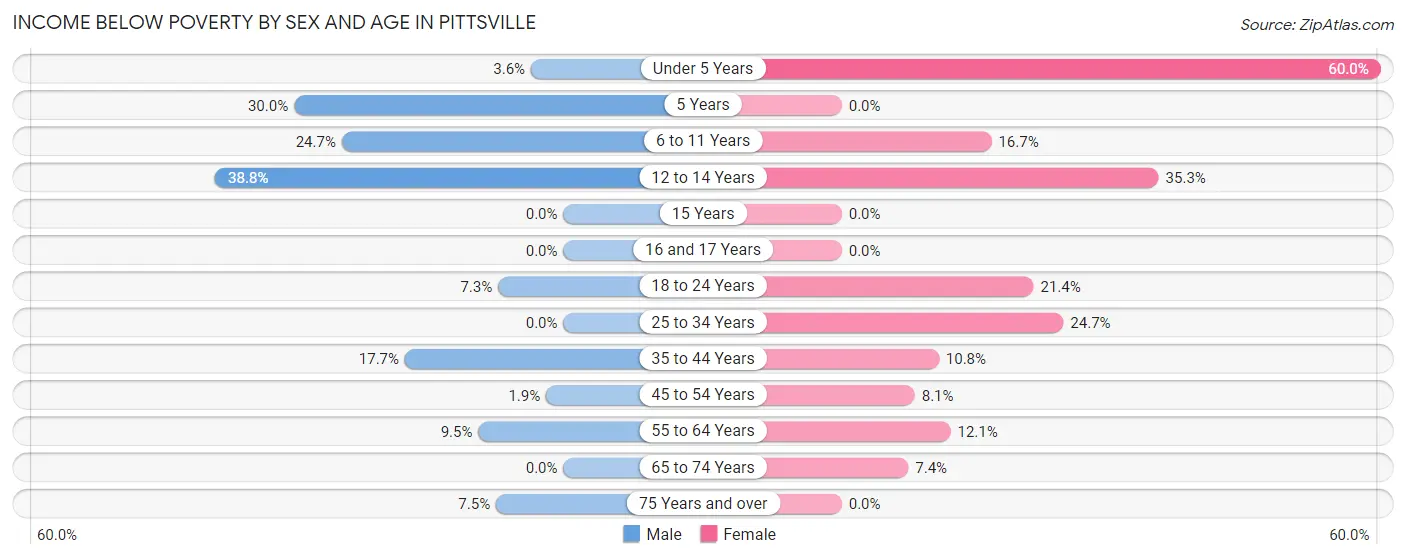
| Age Bracket | Male | Female |
| Under 5 Years | 3 (3.6%) | 48 (60.0%) |
| 5 Years | 6 (30.0%) | 0 (0.0%) |
| 6 to 11 Years | 19 (24.7%) | 3 (16.7%) |
| 12 to 14 Years | 19 (38.8%) | 6 (35.3%) |
| 15 Years | 0 (0.0%) | 0 (0.0%) |
| 16 and 17 Years | 0 (0.0%) | 0 (0.0%) |
| 18 to 24 Years | 8 (7.3%) | 22 (21.4%) |
| 25 to 34 Years | 0 (0.0%) | 38 (24.7%) |
| 35 to 44 Years | 12 (17.6%) | 12 (10.8%) |
| 45 to 54 Years | 4 (1.9%) | 10 (8.1%) |
| 55 to 64 Years | 9 (9.5%) | 27 (12.1%) |
| 65 to 74 Years | 0 (0.0%) | 4 (7.4%) |
| 75 Years and over | 3 (7.5%) | 0 (0.0%) |
| Total | 83 (7.2%) | 170 (17.0%) |
Income Above Poverty by Sex and Age in Pittsville
According to the poverty statistics in Pittsville, males aged 15 years and females aged 5 years are the age groups that are most secure financially, with 100.0% of males and 100.0% of females in these age groups living above the poverty line.
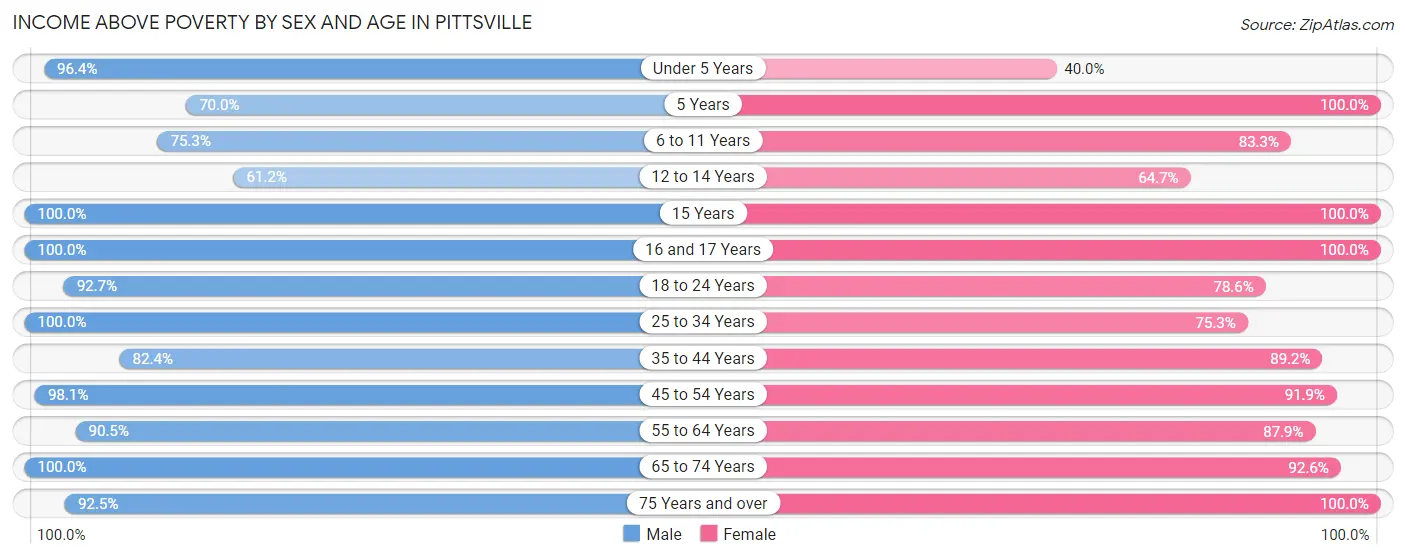
| Age Bracket | Male | Female |
| Under 5 Years | 80 (96.4%) | 32 (40.0%) |
| 5 Years | 14 (70.0%) | 15 (100.0%) |
| 6 to 11 Years | 58 (75.3%) | 15 (83.3%) |
| 12 to 14 Years | 30 (61.2%) | 11 (64.7%) |
| 15 Years | 6 (100.0%) | 19 (100.0%) |
| 16 and 17 Years | 59 (100.0%) | 13 (100.0%) |
| 18 to 24 Years | 102 (92.7%) | 81 (78.6%) |
| 25 to 34 Years | 142 (100.0%) | 116 (75.3%) |
| 35 to 44 Years | 56 (82.4%) | 99 (89.2%) |
| 45 to 54 Years | 203 (98.1%) | 113 (91.9%) |
| 55 to 64 Years | 86 (90.5%) | 196 (87.9%) |
| 65 to 74 Years | 193 (100.0%) | 50 (92.6%) |
| 75 Years and over | 37 (92.5%) | 69 (100.0%) |
| Total | 1,066 (92.8%) | 829 (83.0%) |
Income Below Poverty Among Married-Couple Families in Pittsville
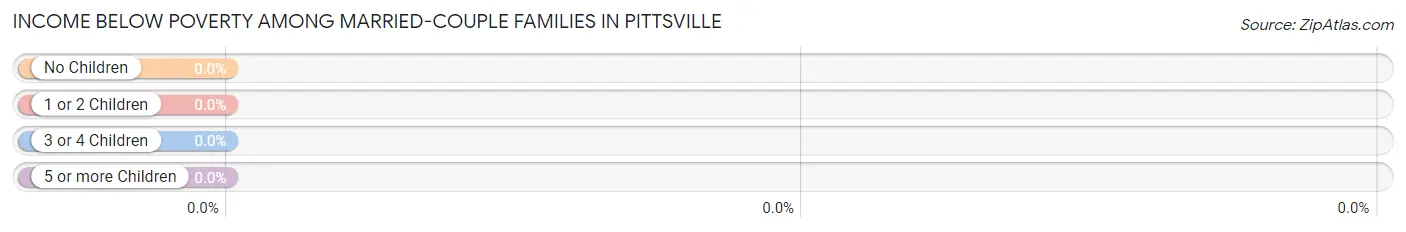
| Children | Above Poverty | Below Poverty |
| No Children | 177 (100.0%) | 0 (0.0%) |
| 1 or 2 Children | 153 (100.0%) | 0 (0.0%) |
| 3 or 4 Children | 4 (100.0%) | 0 (0.0%) |
| 5 or more Children | 0 (0.0%) | 0 (0.0%) |
| Total | 334 (100.0%) | 0 (0.0%) |
Income Below Poverty Among Single-Parent Households in Pittsville
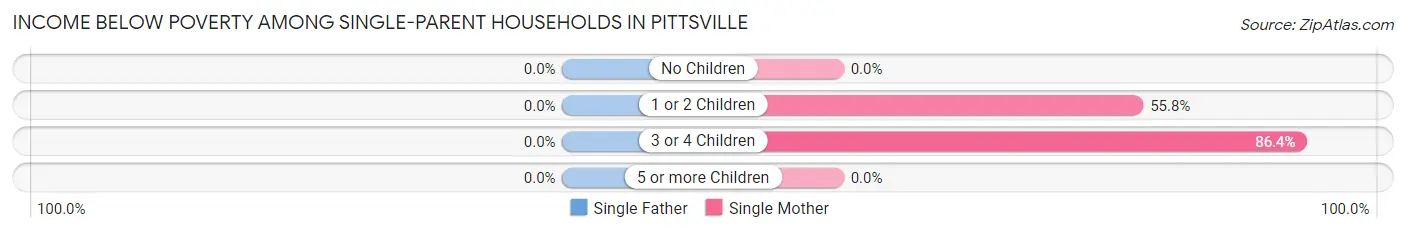
| Children | Single Father | Single Mother |
| No Children | 0 (0.0%) | 0 (0.0%) |
| 1 or 2 Children | 0 (0.0%) | 53 (55.8%) |
| 3 or 4 Children | 0 (0.0%) | 19 (86.4%) |
| 5 or more Children | 0 (0.0%) | 0 (0.0%) |
| Total | 0 (0.0%) | 72 (43.9%) |
Income Below Poverty Among Married-Couple vs Single-Parent Households in Pittsville
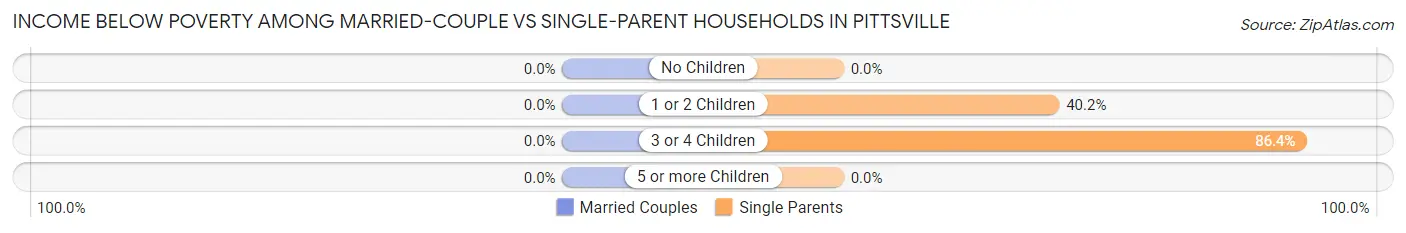
| Children | Married-Couple Families | Single-Parent Households |
| No Children | 0 (0.0%) | 0 (0.0%) |
| 1 or 2 Children | 0 (0.0%) | 53 (40.2%) |
| 3 or 4 Children | 0 (0.0%) | 19 (86.4%) |
| 5 or more Children | 0 (0.0%) | 0 (0.0%) |
| Total | 0 (0.0%) | 72 (34.6%) |
Race in Pittsville
The most populous races in Pittsville are White / Caucasian (1,778 | 80.6%), Two or more Races (294 | 13.3%), and Hispanic or Latino (168 | 7.6%).
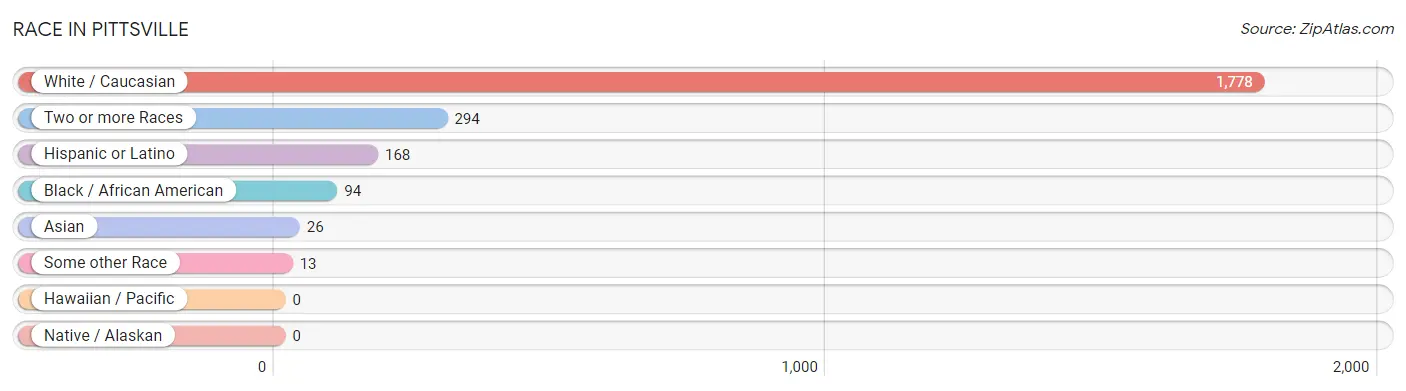
| Race | # Population | % Population |
| Asian | 26 | 1.2% |
| Black / African American | 94 | 4.3% |
| Hawaiian / Pacific | 0 | 0.0% |
| Hispanic or Latino | 168 | 7.6% |
| Native / Alaskan | 0 | 0.0% |
| White / Caucasian | 1,778 | 80.6% |
| Two or more Races | 294 | 13.3% |
| Some other Race | 13 | 0.6% |
| Total | 2,205 | 100.0% |
Ancestry in Pittsville
The most populous ancestries reported in Pittsville are Irish (328 | 14.9%), English (281 | 12.7%), German (253 | 11.5%), Puerto Rican (138 | 6.3%), and Polish (109 | 4.9%), together accounting for 50.3% of all Pittsville residents.
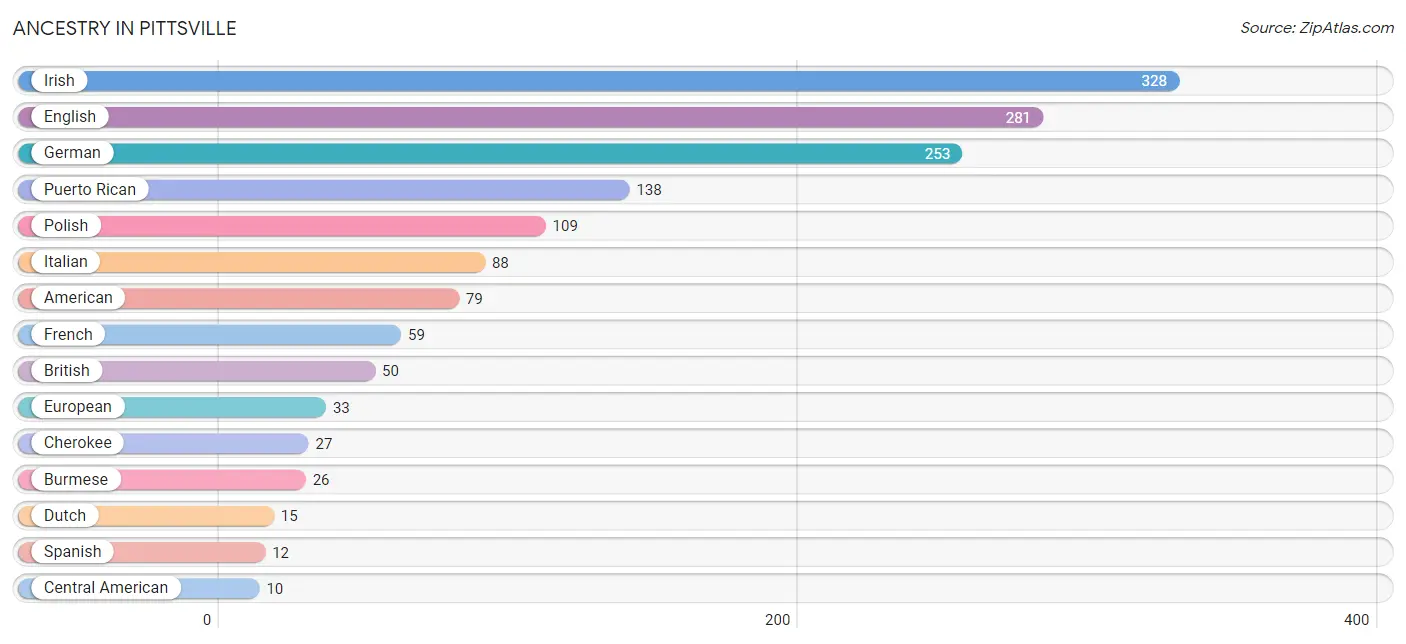
| Ancestry | # Population | % Population |
| African | 4 | 0.2% |
| American | 79 | 3.6% |
| British | 50 | 2.3% |
| Burmese | 26 | 1.2% |
| Central American | 10 | 0.4% |
| Cherokee | 27 | 1.2% |
| Cuban | 5 | 0.2% |
| Dutch | 15 | 0.7% |
| English | 281 | 12.7% |
| European | 33 | 1.5% |
| Finnish | 5 | 0.2% |
| French | 59 | 2.7% |
| French Canadian | 3 | 0.1% |
| German | 253 | 11.5% |
| Irish | 328 | 14.9% |
| Italian | 88 | 4.0% |
| Korean | 3 | 0.1% |
| Latvian | 4 | 0.2% |
| Lithuanian | 5 | 0.2% |
| Mexican | 3 | 0.1% |
| Norwegian | 4 | 0.2% |
| Polish | 109 | 4.9% |
| Portuguese | 6 | 0.3% |
| Puerto Rican | 138 | 6.3% |
| Russian | 6 | 0.3% |
| Salvadoran | 10 | 0.4% |
| Scandinavian | 6 | 0.3% |
| Scotch-Irish | 3 | 0.1% |
| Scottish | 3 | 0.1% |
| Spanish | 12 | 0.5% |
| Subsaharan African | 4 | 0.2% |
| Swedish | 6 | 0.3% |
| Swiss | 6 | 0.3% |
| Ukrainian | 4 | 0.2% | View All 34 Rows |
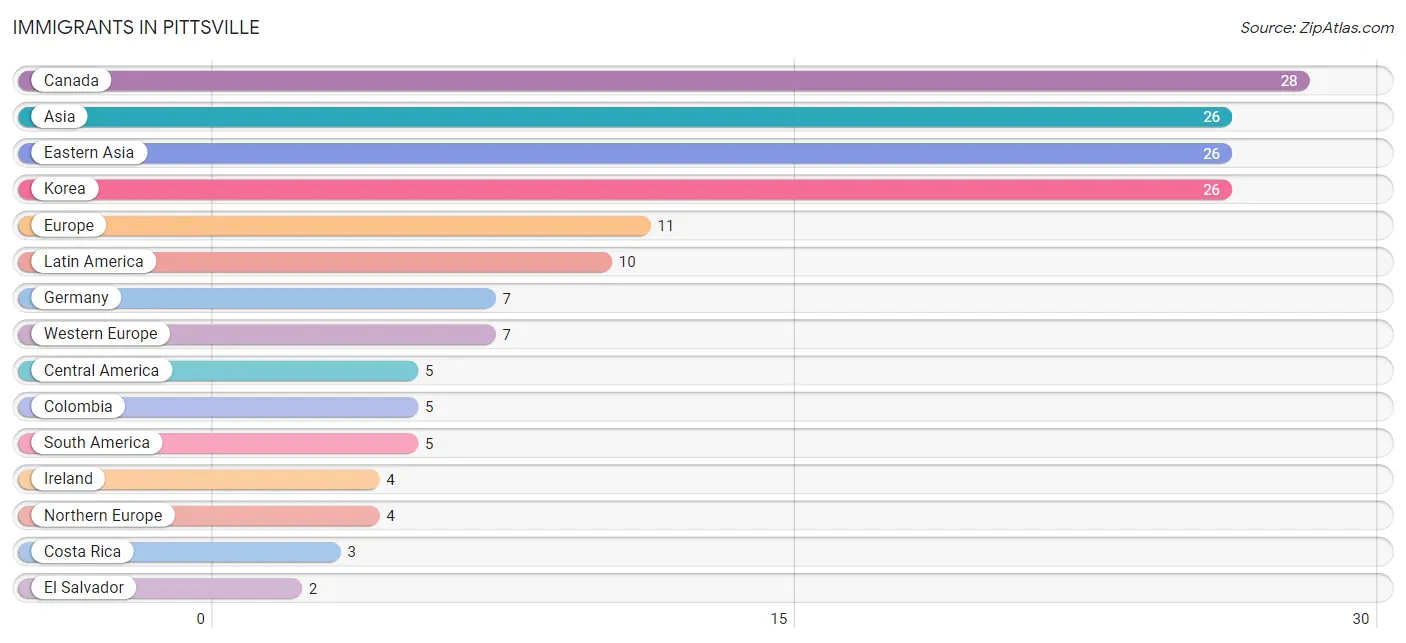
Immigrants in Pittsville
The most numerous immigrant groups reported in Pittsville came from Canada (28 | 1.3%), Asia (26 | 1.2%), Eastern Asia (26 | 1.2%), Korea (26 | 1.2%), and Europe (11 | 0.5%), together accounting for 5.3% of all Pittsville residents.
| Immigration Origin | # Population | % Population |
| Asia | 26 | 1.2% |
| Canada | 28 | 1.3% |
| Central America | 5 | 0.2% |
| Colombia | 5 | 0.2% |
| Costa Rica | 3 | 0.1% |
| Eastern Asia | 26 | 1.2% |
| El Salvador | 2 | 0.1% |
| Europe | 11 | 0.5% |
| Germany | 7 | 0.3% |
| Ireland | 4 | 0.2% |
| Korea | 26 | 1.2% |
| Latin America | 10 | 0.4% |
| Northern Europe | 4 | 0.2% |
| South America | 5 | 0.2% |
| Western Europe | 7 | 0.3% | View All 15 Rows |
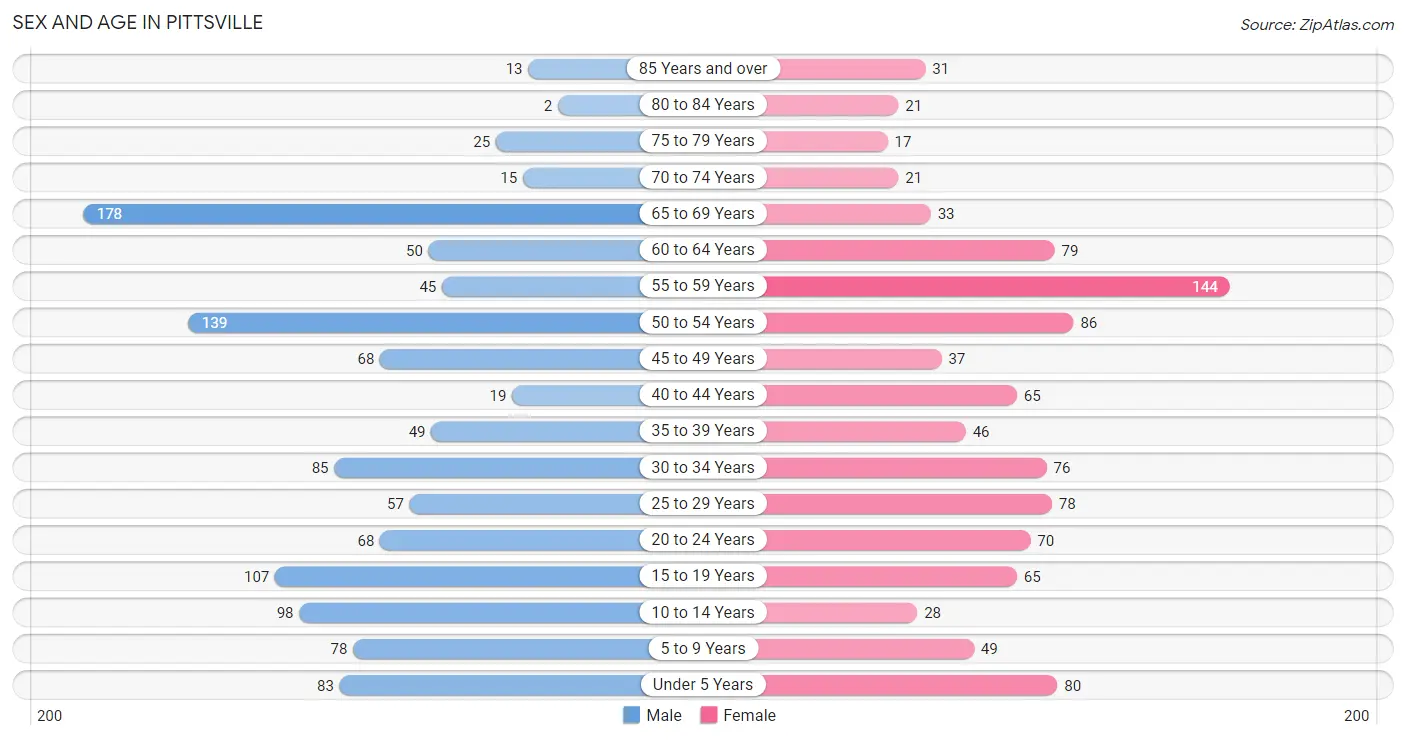
Sex and Age in Pittsville
Sex and Age in Pittsville
The most populous age groups in Pittsville are 65 to 69 Years (178 | 15.1%) for men and 55 to 59 Years (144 | 14.0%) for women.
| Age Bracket | Male | Female |
| Under 5 Years | 83 (7.0%) | 80 (7.8%) |
| 5 to 9 Years | 78 (6.6%) | 49 (4.8%) |
| 10 to 14 Years | 98 (8.3%) | 28 (2.7%) |
| 15 to 19 Years | 107 (9.1%) | 65 (6.3%) |
| 20 to 24 Years | 68 (5.8%) | 70 (6.8%) |
| 25 to 29 Years | 57 (4.8%) | 78 (7.6%) |
| 30 to 34 Years | 85 (7.2%) | 76 (7.4%) |
| 35 to 39 Years | 49 (4.2%) | 46 (4.5%) |
| 40 to 44 Years | 19 (1.6%) | 65 (6.3%) |
| 45 to 49 Years | 68 (5.8%) | 37 (3.6%) |
| 50 to 54 Years | 139 (11.8%) | 86 (8.4%) |
| 55 to 59 Years | 45 (3.8%) | 144 (14.0%) |
| 60 to 64 Years | 50 (4.2%) | 79 (7.7%) |
| 65 to 69 Years | 178 (15.1%) | 33 (3.2%) |
| 70 to 74 Years | 15 (1.3%) | 21 (2.1%) |
| 75 to 79 Years | 25 (2.1%) | 17 (1.7%) |
| 80 to 84 Years | 2 (0.2%) | 21 (2.1%) |
| 85 Years and over | 13 (1.1%) | 31 (3.0%) |
| Total | 1,179 (100.0%) | 1,026 (100.0%) |
Families and Households in Pittsville
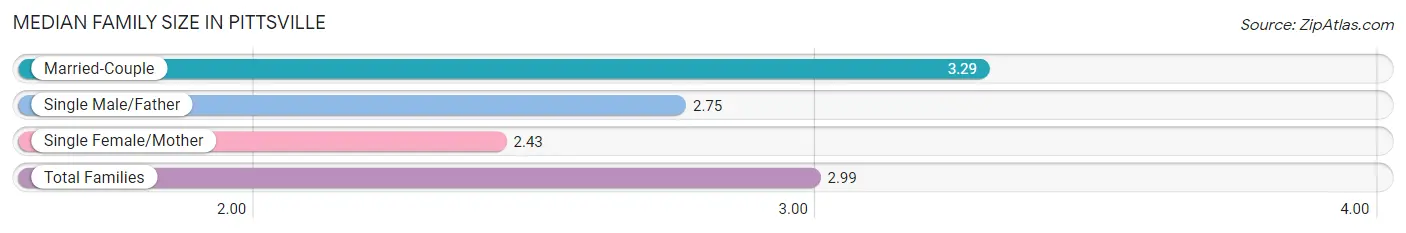
Median Family Size in Pittsville
The median family size in Pittsville is 2.99 persons per family, with married-couple families (334 | 61.6%) accounting for the largest median family size of 3.29 persons per family. On the other hand, single female/mother families (164 | 30.3%) represent the smallest median family size with 2.43 persons per family.
| Family Type | # Families | Family Size |
| Married-Couple | 334 (61.6%) | 3.29 |
| Single Male/Father | 44 (8.1%) | 2.75 |
| Single Female/Mother | 164 (30.3%) | 2.43 |
| Total Families | 542 (100.0%) | 2.99 |
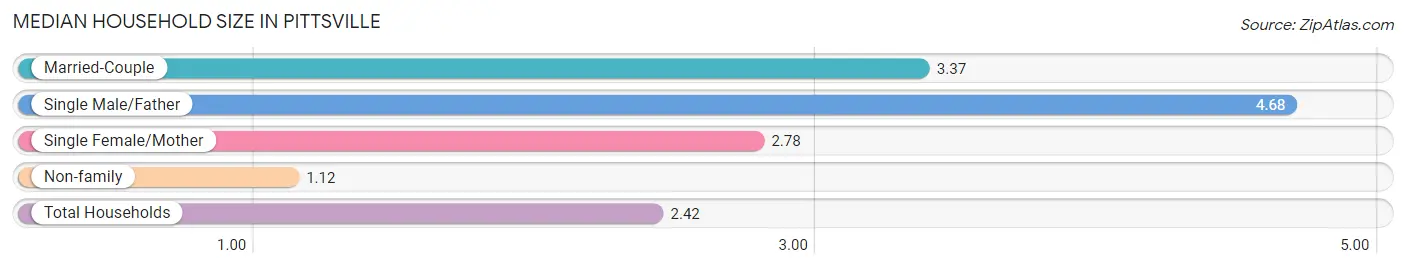
Median Household Size in Pittsville
The median household size in Pittsville is 2.42 persons per household, with single male/father households (44 | 4.8%) accounting for the largest median household size of 4.68 persons per household. non-family households (371 | 40.6%) represent the smallest median household size with 1.12 persons per household.
| Household Type | # Households | Household Size |
| Married-Couple | 334 (36.6%) | 3.37 |
| Single Male/Father | 44 (4.8%) | 4.68 |
| Single Female/Mother | 164 (18.0%) | 2.78 |
| Non-family | 371 (40.6%) | 1.12 |
| Total Households | 913 (100.0%) | 2.42 |
Household Size by Marriage Status in Pittsville
Out of a total of 913 households in Pittsville, 542 (59.4%) are family households, while 371 (40.6%) are nonfamily households. The most numerous type of family households are 2-person households, comprising 197, and the most common type of nonfamily households are 1-person households, comprising 332.
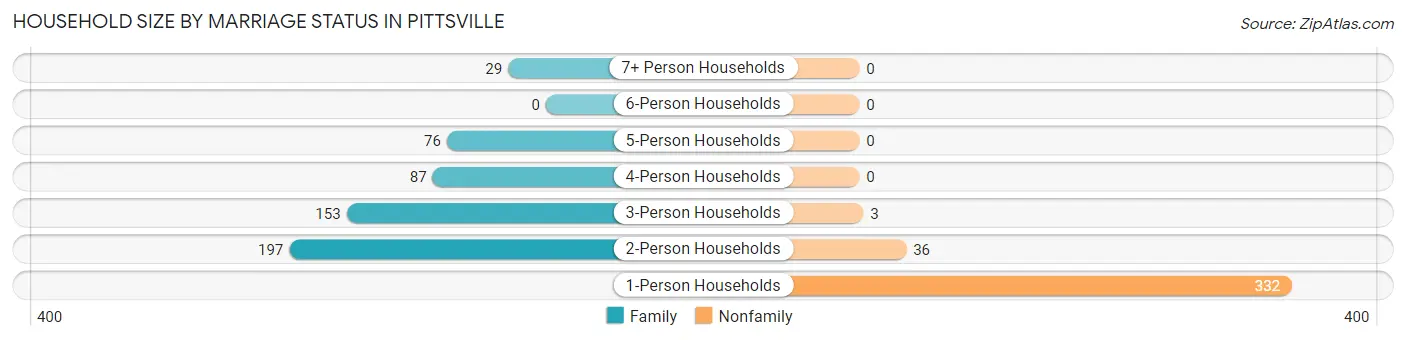
| Household Size | Family Households | Nonfamily Households |
| 1-Person Households | - | 332 (36.4%) |
| 2-Person Households | 197 (21.6%) | 36 (3.9%) |
| 3-Person Households | 153 (16.8%) | 3 (0.3%) |
| 4-Person Households | 87 (9.5%) | 0 (0.0%) |
| 5-Person Households | 76 (8.3%) | 0 (0.0%) |
| 6-Person Households | 0 (0.0%) | 0 (0.0%) |
| 7+ Person Households | 29 (3.2%) | 0 (0.0%) |
| Total | 542 (59.4%) | 371 (40.6%) |
Female Fertility in Pittsville
Fertility by Age in Pittsville
Average fertility rate in Pittsville is 60.0 births per 1,000 women. Women in the age bracket of 20 to 34 years have the highest fertility rate with 125.0 births per 1,000 women. Women in the age bracket of 20 to 34 years acount for 100.0% of all women with births.
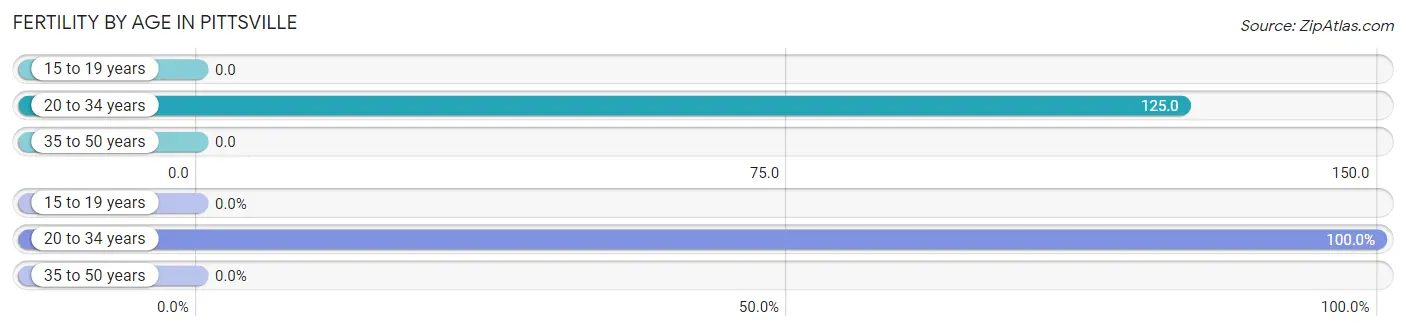
| Age Bracket | Women with Births | Births / 1,000 Women |
| 15 to 19 years | 0 (0.0%) | 0.0 |
| 20 to 34 years | 28 (100.0%) | 125.0 |
| 35 to 50 years | 0 (0.0%) | 0.0 |
| Total | 28 (100.0%) | 60.0 |
Fertility by Age by Marriage Status in Pittsville
39.3% of women with births (28) in Pittsville are married. The highest percentage of unmarried women with births falls into 20 to 34 years age bracket with 60.7% of them unmarried at the time of birth, while the lowest percentage of unmarried women with births belong to 20 to 34 years age bracket with 60.7% of them unmarried.

| Age Bracket | Married | Unmarried |
| 15 to 19 years | 0 (0.0%) | 0 (0.0%) |
| 20 to 34 years | 11 (39.3%) | 17 (60.7%) |
| 35 to 50 years | 0 (0.0%) | 0 (0.0%) |
| Total | 11 (39.3%) | 17 (60.7%) |
Fertility by Education in Pittsville
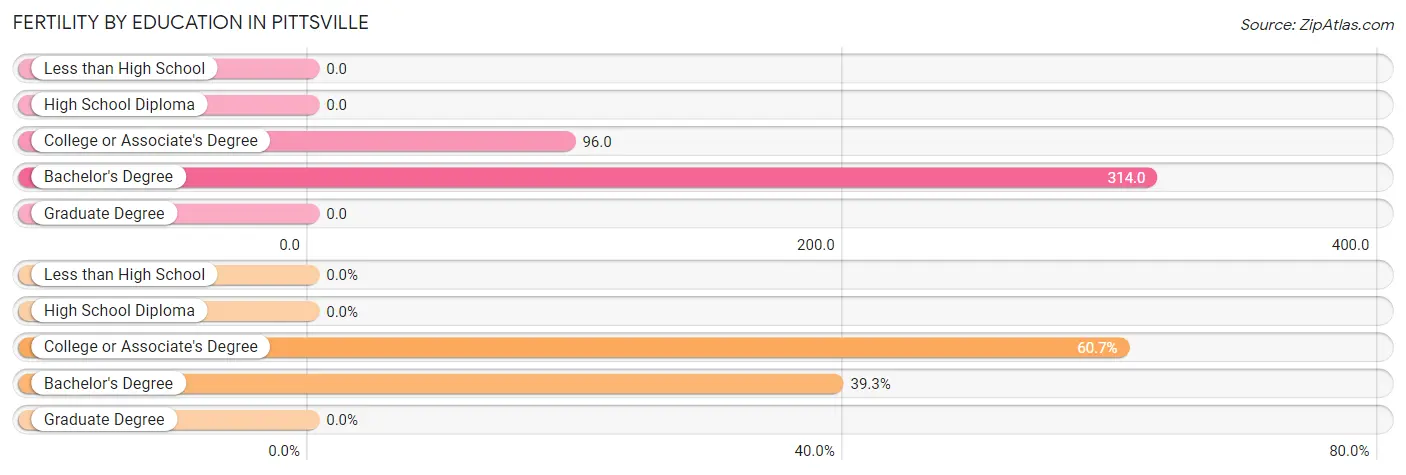
| Educational Attainment | Women with Births | Births / 1,000 Women |
| Less than High School | 0 (0.0%) | 0.0 |
| High School Diploma | 0 (0.0%) | 0.0 |
| College or Associate's Degree | 17 (60.7%) | 96.0 |
| Bachelor's Degree | 11 (39.3%) | 314.0 |
| Graduate Degree | 0 (0.0%) | 0.0 |
| Total | 28 (100.0%) | 60.0 |
Fertility by Education by Marriage Status in Pittsville
60.7% of women with births in Pittsville are unmarried. Women with the educational attainment of bachelor's degree are most likely to be married with 100.0% of them married at childbirth, while women with the educational attainment of college or associate's degree are least likely to be married with 100.0% of them unmarried at childbirth.
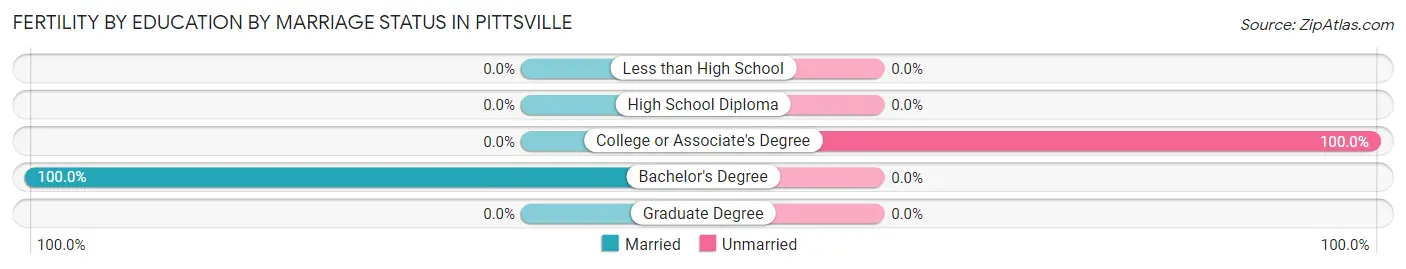
| Educational Attainment | Married | Unmarried |
| Less than High School | 0 (0.0%) | 0 (0.0%) |
| High School Diploma | 0 (0.0%) | 0 (0.0%) |
| College or Associate's Degree | 0 (0.0%) | 17 (100.0%) |
| Bachelor's Degree | 11 (100.0%) | 0 (0.0%) |
| Graduate Degree | 0 (0.0%) | 0 (0.0%) |
| Total | 11 (39.3%) | 17 (60.7%) |
Employment Characteristics in Pittsville
Employment by Class of Employer in Pittsville
Among the 1,070 employed individuals in Pittsville, private company employees (761 | 71.1%), local government employees (130 | 12.1%), and self-employed (not incorporated) (71 | 6.6%) make up the most common classes of employment.
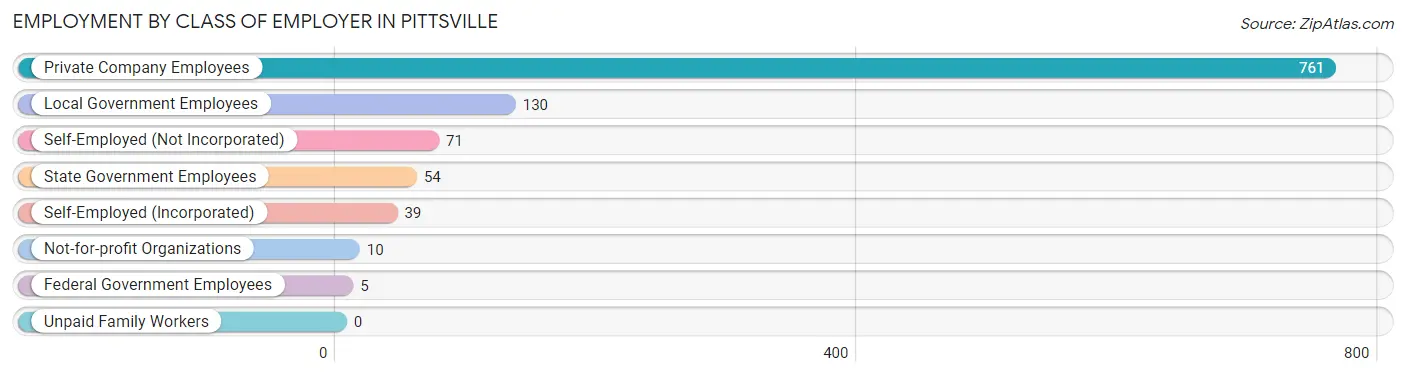
| Employer Class | # Employees | % Employees |
| Private Company Employees | 761 | 71.1% |
| Self-Employed (Incorporated) | 39 | 3.6% |
| Self-Employed (Not Incorporated) | 71 | 6.6% |
| Not-for-profit Organizations | 10 | 0.9% |
| Local Government Employees | 130 | 12.1% |
| State Government Employees | 54 | 5.1% |
| Federal Government Employees | 5 | 0.5% |
| Unpaid Family Workers | 0 | 0.0% |
| Total | 1,070 | 100.0% |
Employment Status by Age in Pittsville
According to the labor force statistics for Pittsville, out of the total population over 16 years of age (1,764), 62.8% or 1,108 individuals are in the labor force, with 3.3% or 37 of them unemployed. The age group with the highest labor force participation rate is 45 to 54 years, with 93.3% or 308 individuals in the labor force. Within the labor force, the 35 to 44 years age range has the highest percentage of unemployed individuals, with 15.5% or 24 of them being unemployed.
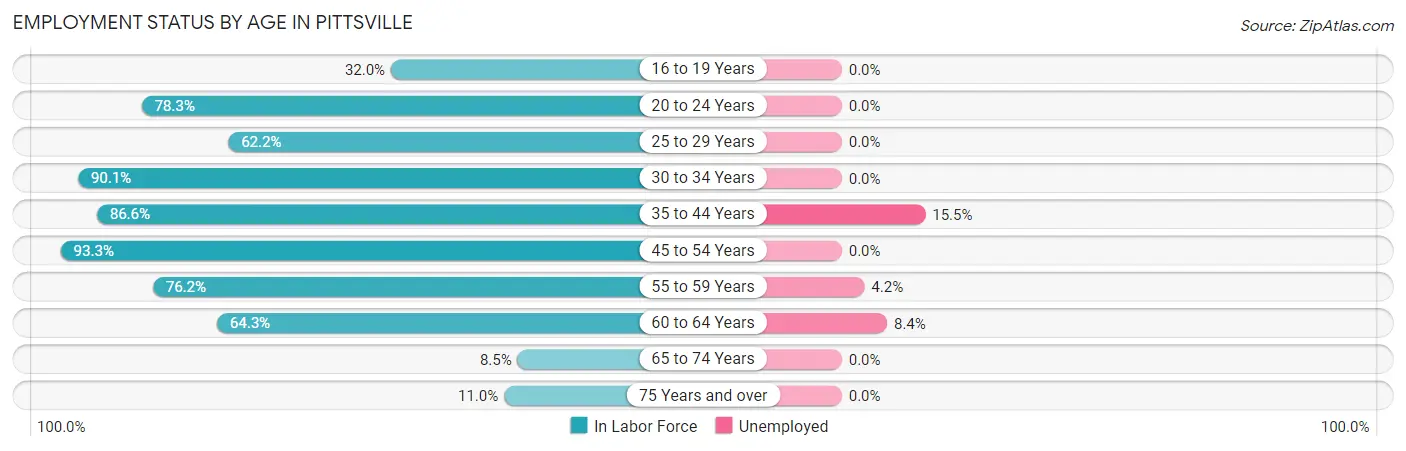
| Age Bracket | In Labor Force | Unemployed |
| 16 to 19 Years | 47 (32.0%) | 0 (0.0%) |
| 20 to 24 Years | 108 (78.3%) | 0 (0.0%) |
| 25 to 29 Years | 84 (62.2%) | 0 (0.0%) |
| 30 to 34 Years | 145 (90.1%) | 0 (0.0%) |
| 35 to 44 Years | 155 (86.6%) | 24 (15.5%) |
| 45 to 54 Years | 308 (93.3%) | 0 (0.0%) |
| 55 to 59 Years | 144 (76.2%) | 6 (4.2%) |
| 60 to 64 Years | 83 (64.3%) | 7 (8.4%) |
| 65 to 74 Years | 21 (8.5%) | 0 (0.0%) |
| 75 Years and over | 12 (11.0%) | 0 (0.0%) |
| Total | 1,108 (62.8%) | 37 (3.3%) |
Employment Status by Educational Attainment in Pittsville
According to labor force statistics for Pittsville, 81.8% of individuals (919) out of the total population between 25 and 64 years of age (1,123) are in the labor force, with 4.0% or 37 of them being unemployed. The group with the highest labor force participation rate are those with the educational attainment of college / associate degree, with 88.9% or 320 individuals in the labor force. Within the labor force, individuals with less than high school education have the highest percentage of unemployment, with 7.7% or 9 of them being unemployed.
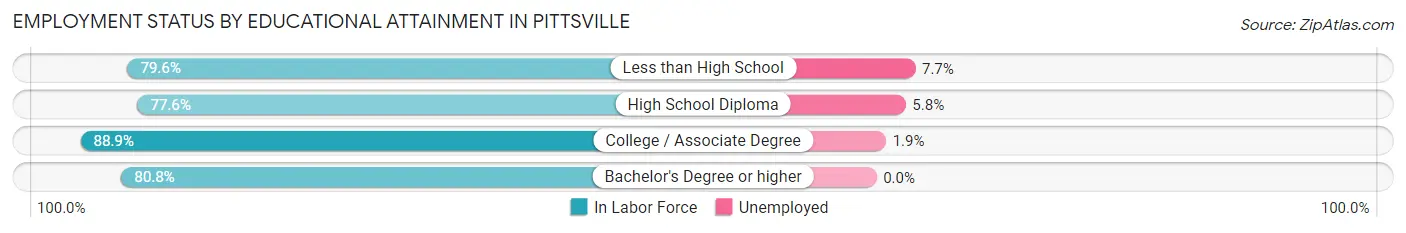
| Educational Attainment | In Labor Force | Unemployed |
| Less than High School | 117 (79.6%) | 11 (7.7%) |
| High School Diploma | 377 (77.6%) | 28 (5.8%) |
| College / Associate Degree | 320 (88.9%) | 7 (1.9%) |
| Bachelor's Degree or higher | 105 (80.8%) | 0 (0.0%) |
| Total | 919 (81.8%) | 45 (4.0%) |
Employment Occupations by Sex in Pittsville
Management, Business, Science and Arts Occupations
The most common Management, Business, Science and Arts occupations in Pittsville are Community & Social Service (90 | 8.4%), Management (87 | 8.1%), Education Instruction & Library (76 | 7.1%), Business & Financial (42 | 3.9%), and Health Diagnosing & Treating (26 | 2.4%).
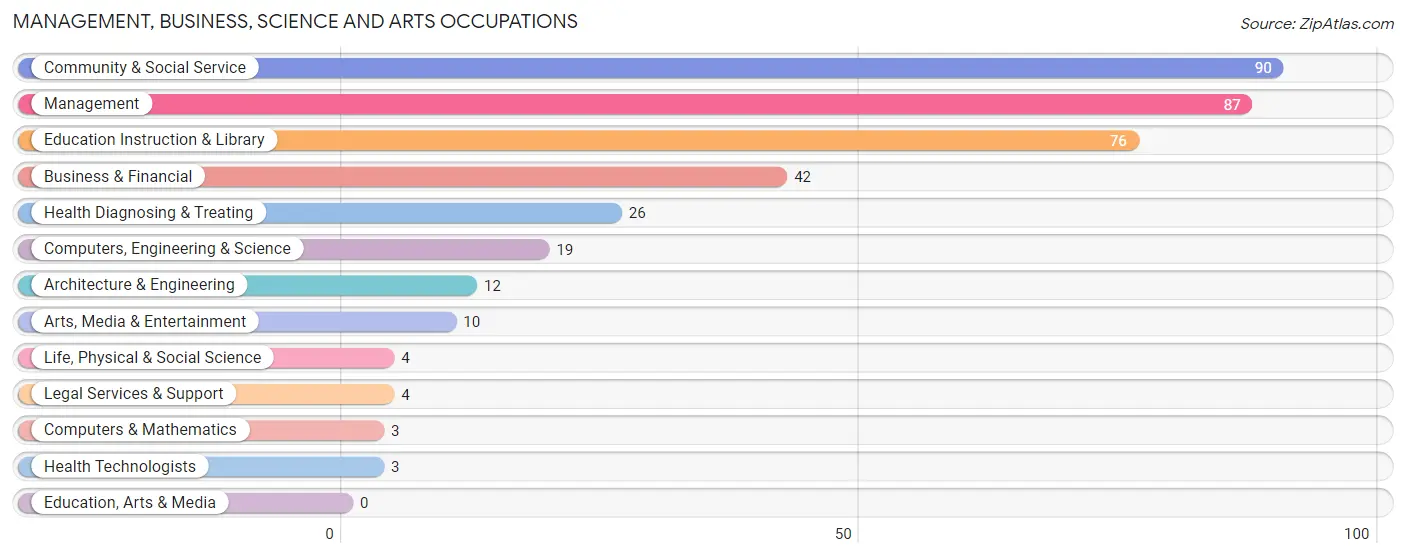
Management, Business, Science and Arts Occupations by Sex
Within the Management, Business, Science and Arts occupations in Pittsville, the most male-oriented occupations are Architecture & Engineering (100.0%), Legal Services & Support (100.0%), and Management (82.8%), while the most female-oriented occupations are Computers & Mathematics (100.0%), Life, Physical & Social Science (100.0%), and Health Technologists (100.0%).
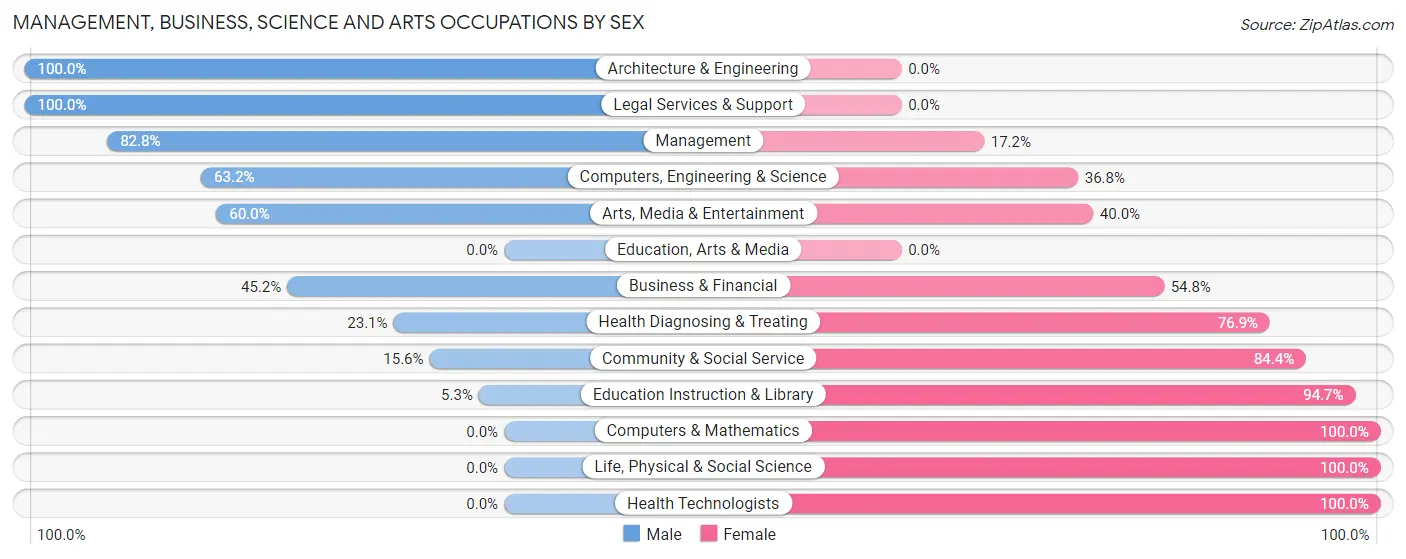
| Occupation | Male | Female |
| Management | 72 (82.8%) | 15 (17.2%) |
| Business & Financial | 19 (45.2%) | 23 (54.8%) |
| Computers, Engineering & Science | 12 (63.2%) | 7 (36.8%) |
| Computers & Mathematics | 0 (0.0%) | 3 (100.0%) |
| Architecture & Engineering | 12 (100.0%) | 0 (0.0%) |
| Life, Physical & Social Science | 0 (0.0%) | 4 (100.0%) |
| Community & Social Service | 14 (15.6%) | 76 (84.4%) |
| Education, Arts & Media | 0 (0.0%) | 0 (0.0%) |
| Legal Services & Support | 4 (100.0%) | 0 (0.0%) |
| Education Instruction & Library | 4 (5.3%) | 72 (94.7%) |
| Arts, Media & Entertainment | 6 (60.0%) | 4 (40.0%) |
| Health Diagnosing & Treating | 6 (23.1%) | 20 (76.9%) |
| Health Technologists | 0 (0.0%) | 3 (100.0%) |
| Total (Category) | 123 (46.6%) | 141 (53.4%) |
| Total (Overall) | 523 (48.9%) | 547 (51.1%) |
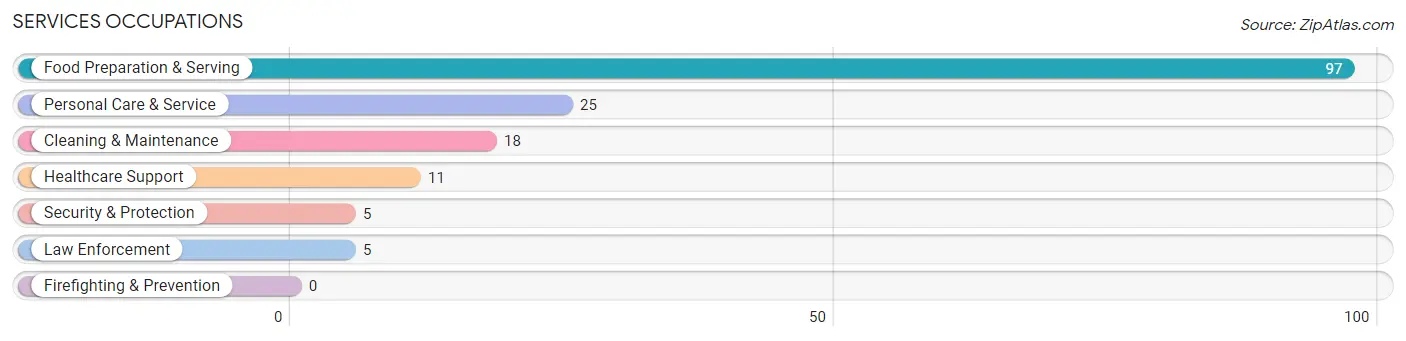
Services Occupations
The most common Services occupations in Pittsville are Food Preparation & Serving (97 | 9.1%), Personal Care & Service (25 | 2.3%), Cleaning & Maintenance (18 | 1.7%), Healthcare Support (11 | 1.0%), and Security & Protection (5 | 0.5%).
Services Occupations by Sex
Within the Services occupations in Pittsville, the most male-oriented occupations are Cleaning & Maintenance (83.3%), Security & Protection (60.0%), and Law Enforcement (60.0%), while the most female-oriented occupations are Healthcare Support (100.0%), Personal Care & Service (100.0%), and Food Preparation & Serving (71.1%).
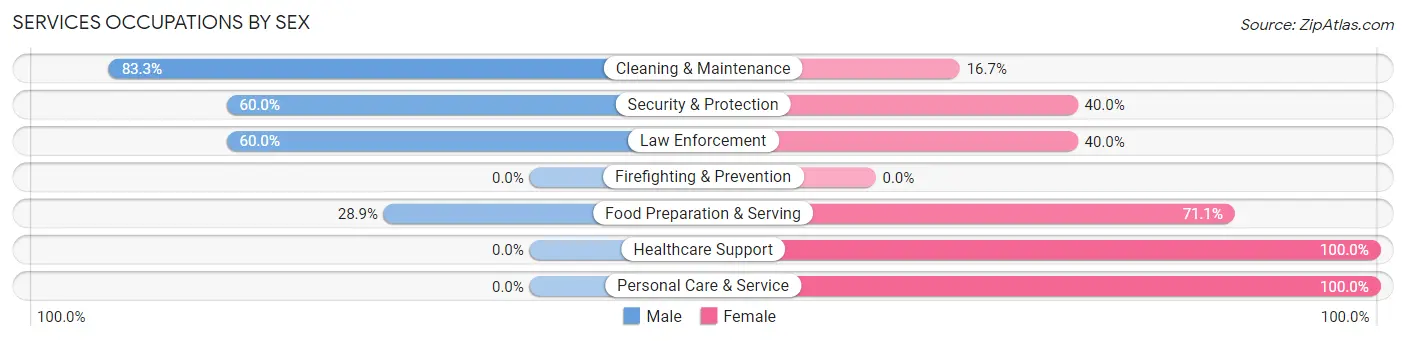
| Occupation | Male | Female |
| Healthcare Support | 0 (0.0%) | 11 (100.0%) |
| Security & Protection | 3 (60.0%) | 2 (40.0%) |
| Firefighting & Prevention | 0 (0.0%) | 0 (0.0%) |
| Law Enforcement | 3 (60.0%) | 2 (40.0%) |
| Food Preparation & Serving | 28 (28.9%) | 69 (71.1%) |
| Cleaning & Maintenance | 15 (83.3%) | 3 (16.7%) |
| Personal Care & Service | 0 (0.0%) | 25 (100.0%) |
| Total (Category) | 46 (29.5%) | 110 (70.5%) |
| Total (Overall) | 523 (48.9%) | 547 (51.1%) |
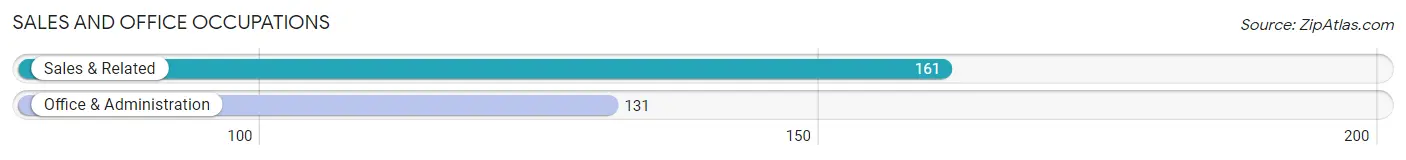
Sales and Office Occupations
The most common Sales and Office occupations in Pittsville are Sales & Related (161 | 15.0%), and Office & Administration (131 | 12.2%).
Sales and Office Occupations by Sex
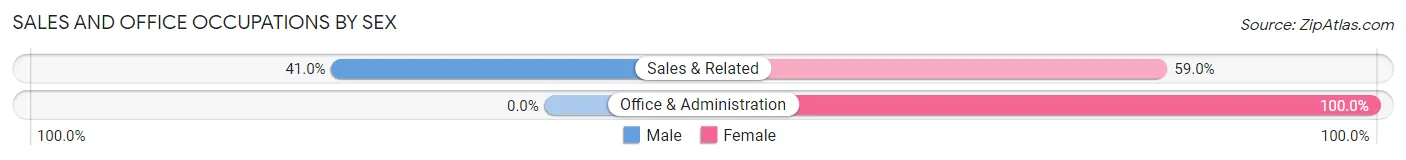
| Occupation | Male | Female |
| Sales & Related | 66 (41.0%) | 95 (59.0%) |
| Office & Administration | 0 (0.0%) | 131 (100.0%) |
| Total (Category) | 66 (22.6%) | 226 (77.4%) |
| Total (Overall) | 523 (48.9%) | 547 (51.1%) |
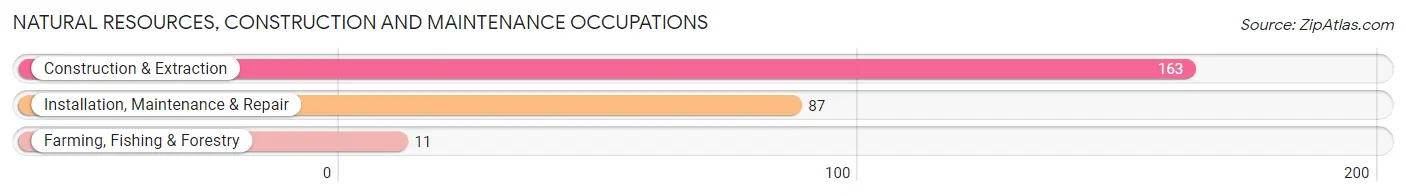
Natural Resources, Construction and Maintenance Occupations
The most common Natural Resources, Construction and Maintenance occupations in Pittsville are Construction & Extraction (163 | 15.2%), Installation, Maintenance & Repair (87 | 8.1%), and Farming, Fishing & Forestry (11 | 1.0%).
Natural Resources, Construction and Maintenance Occupations by Sex
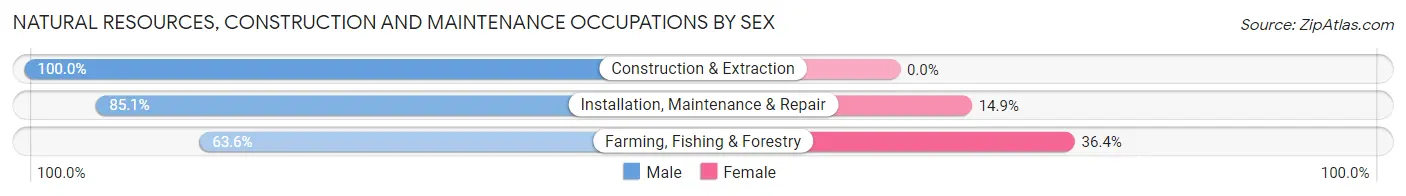
| Occupation | Male | Female |
| Farming, Fishing & Forestry | 7 (63.6%) | 4 (36.4%) |
| Construction & Extraction | 163 (100.0%) | 0 (0.0%) |
| Installation, Maintenance & Repair | 74 (85.1%) | 13 (14.9%) |
| Total (Category) | 244 (93.5%) | 17 (6.5%) |
| Total (Overall) | 523 (48.9%) | 547 (51.1%) |
Production, Transportation and Moving Occupations
The most common Production, Transportation and Moving occupations in Pittsville are Production (43 | 4.0%), Material Moving (29 | 2.7%), and Transportation (25 | 2.3%).
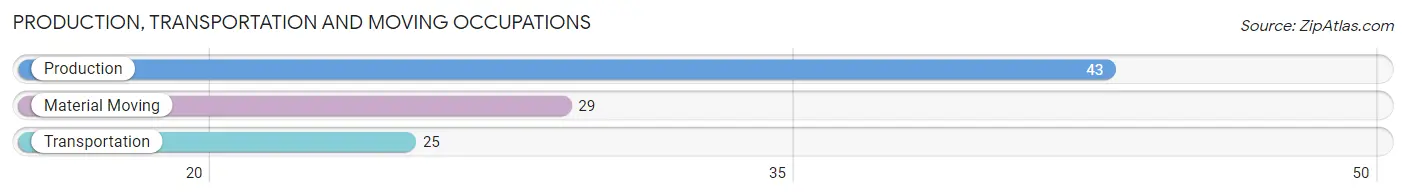
Production, Transportation and Moving Occupations by Sex
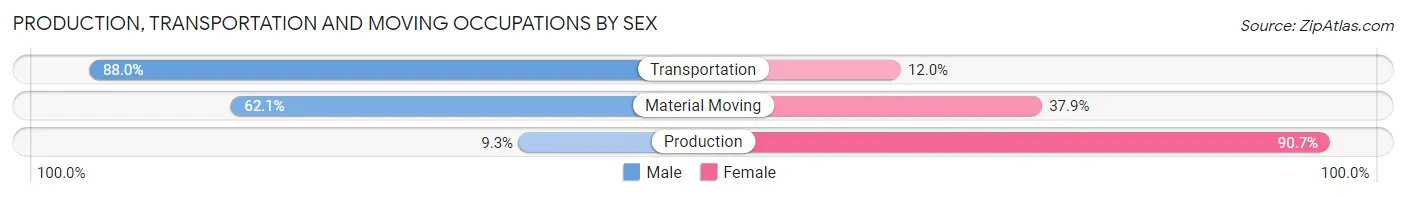
| Occupation | Male | Female |
| Production | 4 (9.3%) | 39 (90.7%) |
| Transportation | 22 (88.0%) | 3 (12.0%) |
| Material Moving | 18 (62.1%) | 11 (37.9%) |
| Total (Category) | 44 (45.4%) | 53 (54.6%) |
| Total (Overall) | 523 (48.9%) | 547 (51.1%) |
Employment Industries by Sex in Pittsville
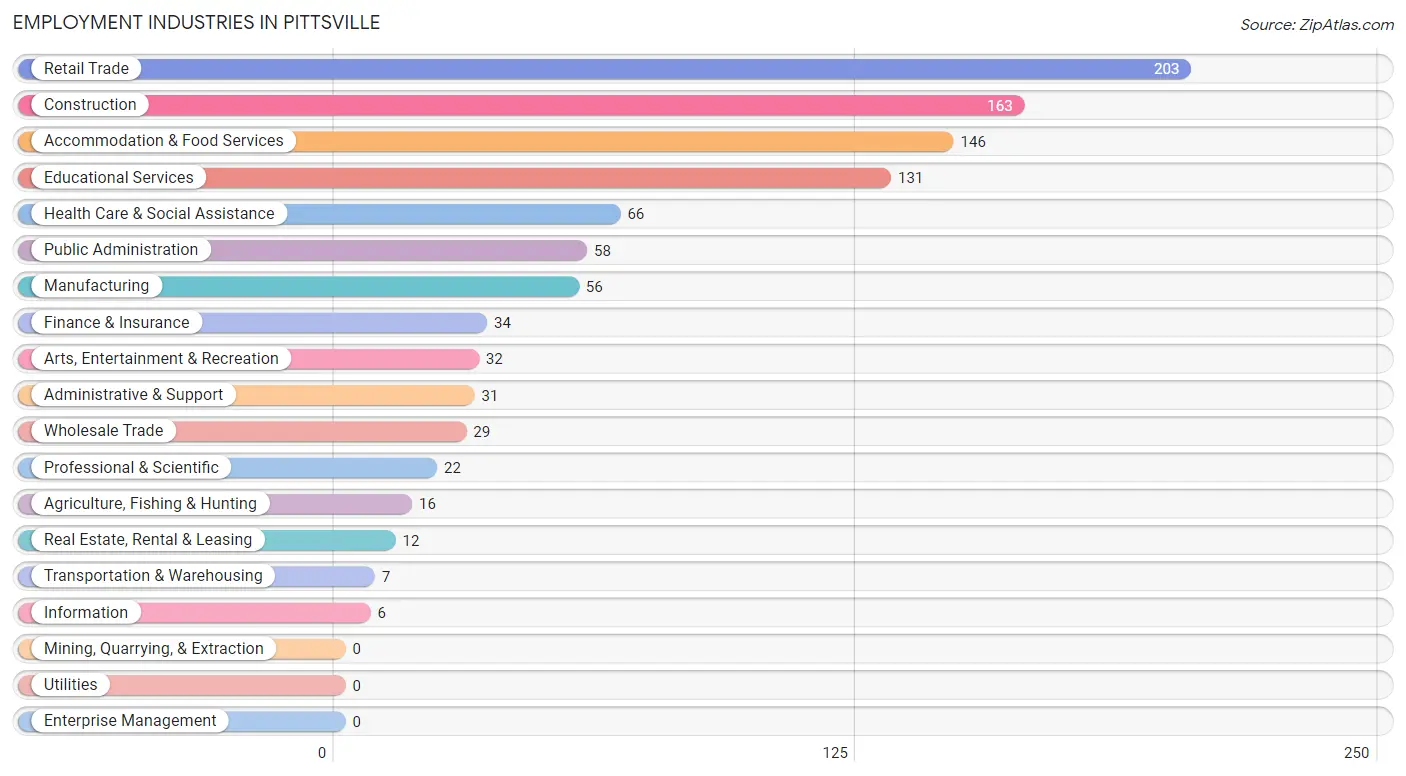
Employment Industries in Pittsville
The major employment industries in Pittsville include Retail Trade (203 | 19.0%), Construction (163 | 15.2%), Accommodation & Food Services (146 | 13.6%), Educational Services (131 | 12.2%), and Health Care & Social Assistance (66 | 6.2%).
Employment Industries by Sex in Pittsville
The Pittsville industries that see more men than women are Transportation & Warehousing (100.0%), Information (100.0%), and Construction (96.3%), whereas the industries that tend to have a higher number of women are Finance & Insurance (100.0%), Arts, Entertainment & Recreation (100.0%), and Educational Services (93.9%).
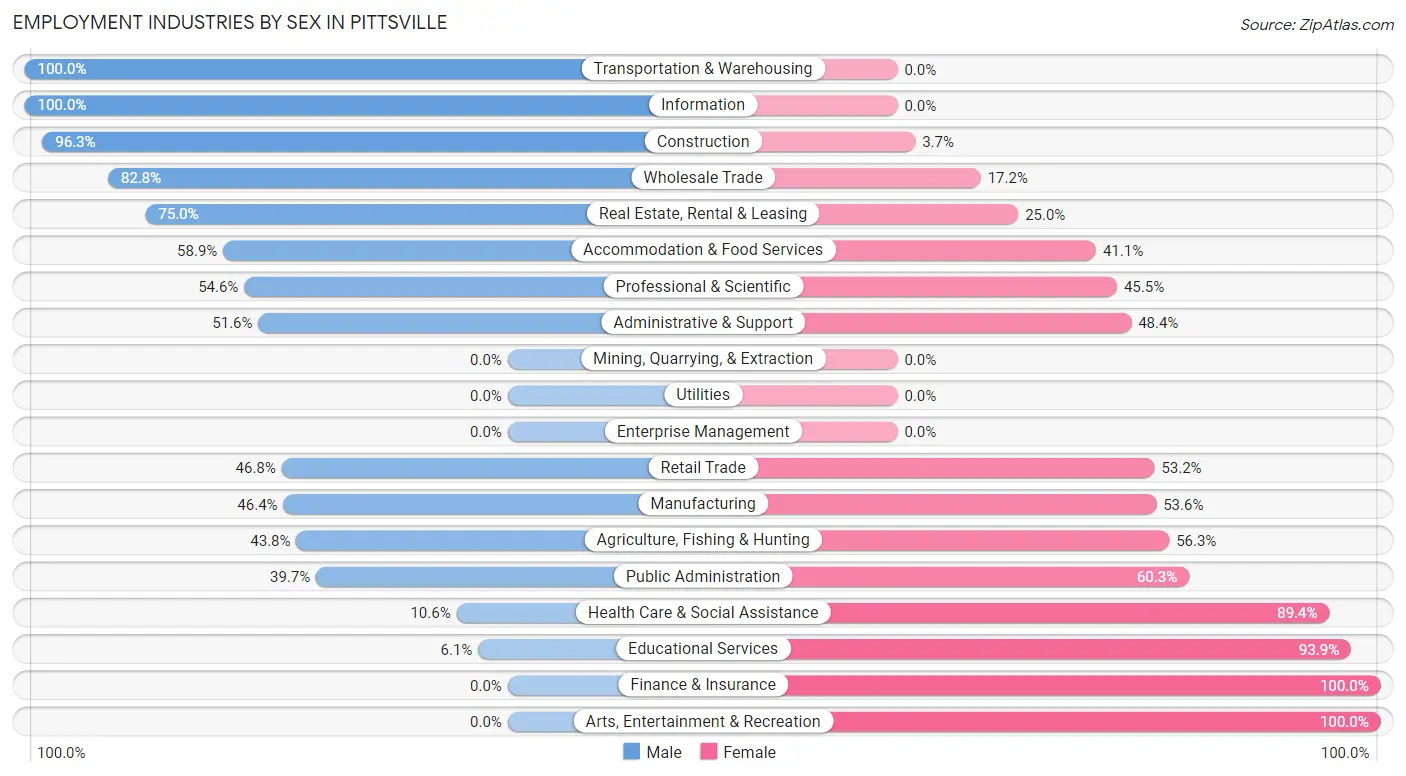
| Industry | Male | Female |
| Agriculture, Fishing & Hunting | 7 (43.8%) | 9 (56.2%) |
| Mining, Quarrying, & Extraction | 0 (0.0%) | 0 (0.0%) |
| Construction | 157 (96.3%) | 6 (3.7%) |
| Manufacturing | 26 (46.4%) | 30 (53.6%) |
| Wholesale Trade | 24 (82.8%) | 5 (17.2%) |
| Retail Trade | 95 (46.8%) | 108 (53.2%) |
| Transportation & Warehousing | 7 (100.0%) | 0 (0.0%) |
| Utilities | 0 (0.0%) | 0 (0.0%) |
| Information | 6 (100.0%) | 0 (0.0%) |
| Finance & Insurance | 0 (0.0%) | 34 (100.0%) |
| Real Estate, Rental & Leasing | 9 (75.0%) | 3 (25.0%) |
| Professional & Scientific | 12 (54.5%) | 10 (45.5%) |
| Enterprise Management | 0 (0.0%) | 0 (0.0%) |
| Administrative & Support | 16 (51.6%) | 15 (48.4%) |
| Educational Services | 8 (6.1%) | 123 (93.9%) |
| Health Care & Social Assistance | 7 (10.6%) | 59 (89.4%) |
| Arts, Entertainment & Recreation | 0 (0.0%) | 32 (100.0%) |
| Accommodation & Food Services | 86 (58.9%) | 60 (41.1%) |
| Public Administration | 23 (39.7%) | 35 (60.3%) |
| Total | 523 (48.9%) | 547 (51.1%) |
Education in Pittsville
School Enrollment in Pittsville
The most common levels of schooling among the 371 students in Pittsville are middle school (109 | 29.4%), high school (97 | 26.2%), and kindergarten (70 | 18.9%).
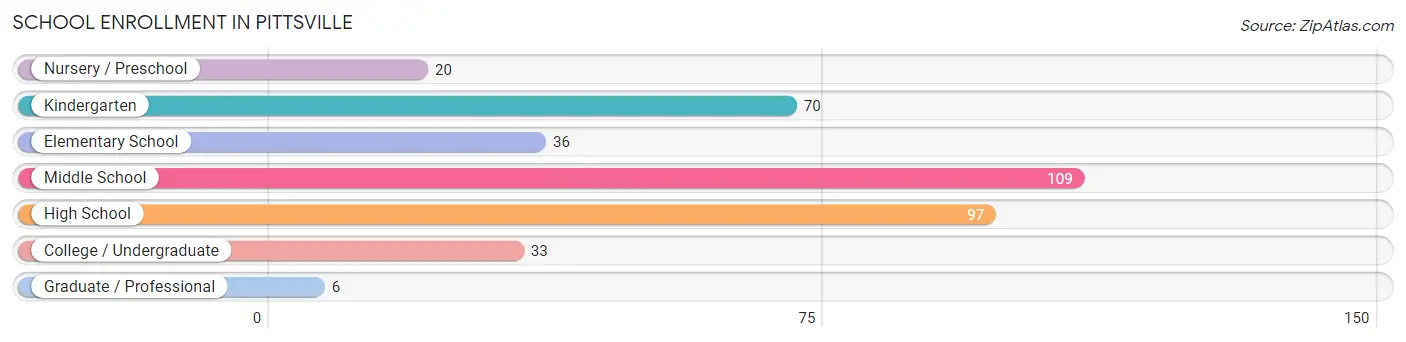
| School Level | # Students | % Students |
| Nursery / Preschool | 20 | 5.4% |
| Kindergarten | 70 | 18.9% |
| Elementary School | 36 | 9.7% |
| Middle School | 109 | 29.4% |
| High School | 97 | 26.2% |
| College / Undergraduate | 33 | 8.9% |
| Graduate / Professional | 6 | 1.6% |
| Total | 371 | 100.0% |
School Enrollment by Age by Funding Source in Pittsville
Out of a total of 371 students who are enrolled in schools in Pittsville, 55 (14.8%) attend a private institution, while the remaining 316 (85.2%) are enrolled in public schools. The age group of 35 years and over has the highest likelihood of being enrolled in private schools, with 11 (100.0% in the age bracket) enrolled. Conversely, the age group of 20 to 24 year olds has the lowest likelihood of being enrolled in a private school, with 13 (100.0% in the age bracket) attending a public institution.
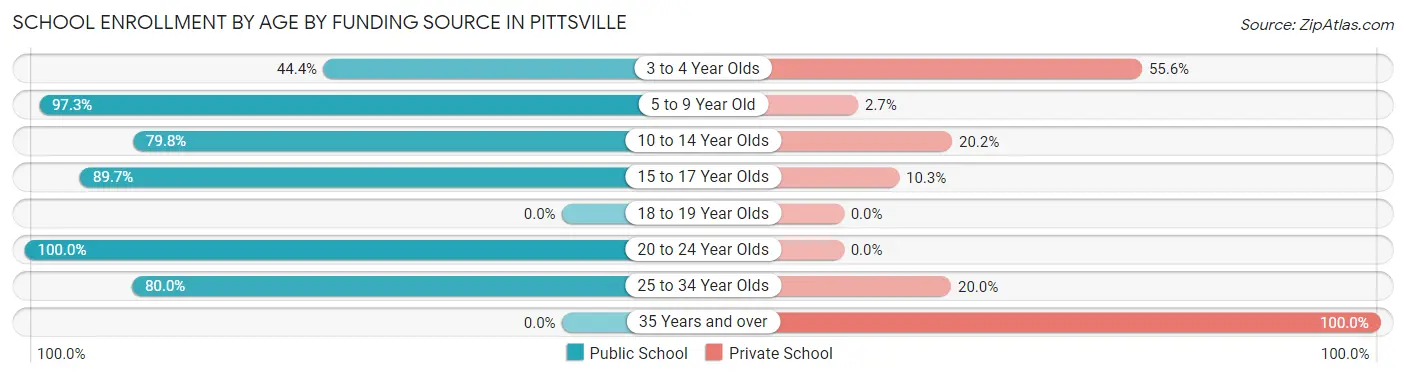
| Age Bracket | Public School | Private School |
| 3 to 4 Year Olds | 4 (44.4%) | 5 (55.6%) |
| 5 to 9 Year Old | 109 (97.3%) | 3 (2.7%) |
| 10 to 14 Year Olds | 91 (79.8%) | 23 (20.2%) |
| 15 to 17 Year Olds | 87 (89.7%) | 10 (10.3%) |
| 18 to 19 Year Olds | 0 (0.0%) | 0 (0.0%) |
| 20 to 24 Year Olds | 13 (100.0%) | 0 (0.0%) |
| 25 to 34 Year Olds | 12 (80.0%) | 3 (20.0%) |
| 35 Years and over | 0 (0.0%) | 11 (100.0%) |
| Total | 316 (85.2%) | 55 (14.8%) |
Educational Attainment by Field of Study in Pittsville
Computers & mathematics (31 | 19.8%), bio, nature & agricultural (30 | 19.1%), education (28 | 17.8%), business (19 | 12.1%), and engineering (12 | 7.6%) are the most common fields of study among 157 individuals in Pittsville who have obtained a bachelor's degree or higher.
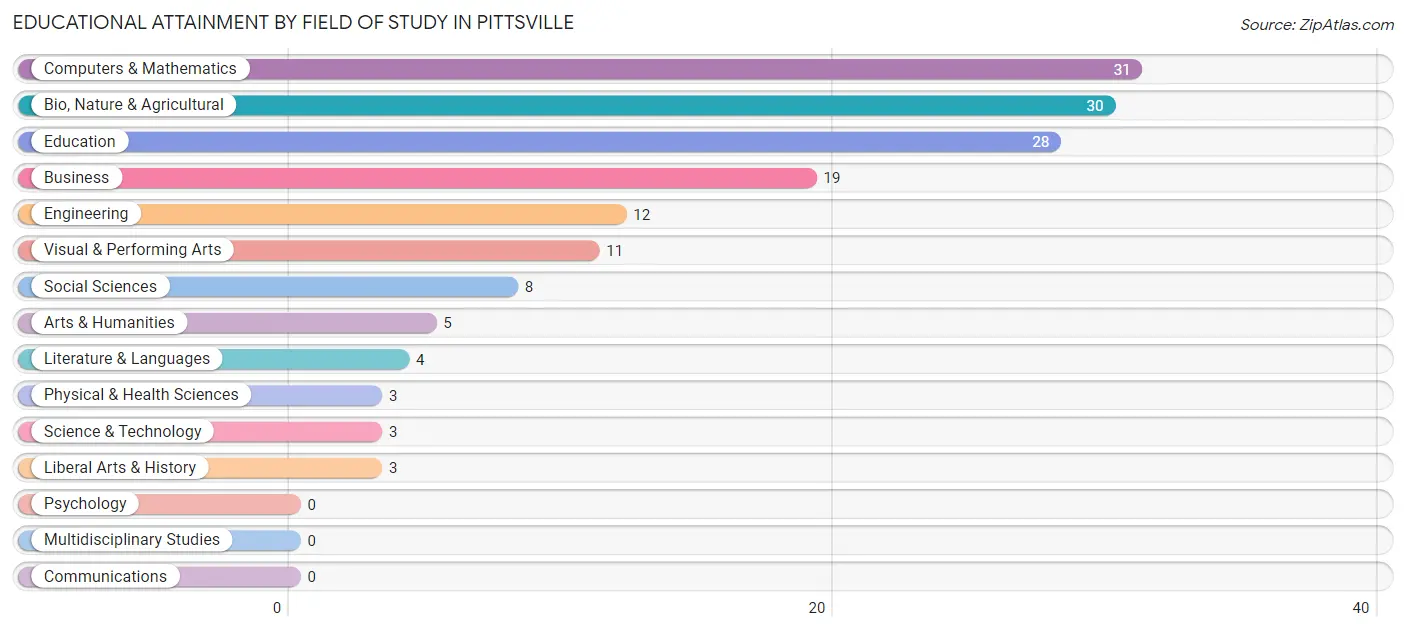
| Field of Study | # Graduates | % Graduates |
| Computers & Mathematics | 31 | 19.8% |
| Bio, Nature & Agricultural | 30 | 19.1% |
| Physical & Health Sciences | 3 | 1.9% |
| Psychology | 0 | 0.0% |
| Social Sciences | 8 | 5.1% |
| Engineering | 12 | 7.6% |
| Multidisciplinary Studies | 0 | 0.0% |
| Science & Technology | 3 | 1.9% |
| Business | 19 | 12.1% |
| Education | 28 | 17.8% |
| Literature & Languages | 4 | 2.5% |
| Liberal Arts & History | 3 | 1.9% |
| Visual & Performing Arts | 11 | 7.0% |
| Communications | 0 | 0.0% |
| Arts & Humanities | 5 | 3.2% |
| Total | 157 | 100.0% |
Transportation & Commute in Pittsville
Vehicle Availability by Sex in Pittsville
The most prevalent vehicle ownership categories in Pittsville are males with 3 vehicles (186, accounting for 35.6%) and females with 3 vehicles (140, making up 34.0%).
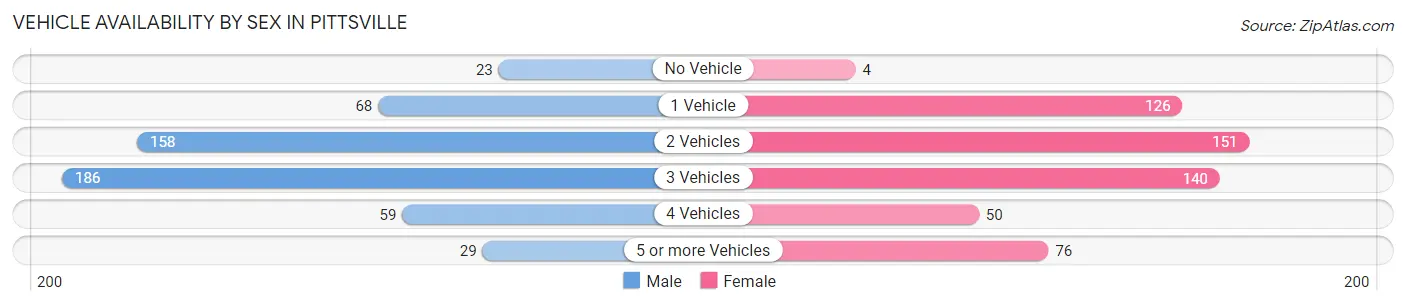
| Vehicles Available | Male | Female |
| No Vehicle | 23 (4.4%) | 4 (0.7%) |
| 1 Vehicle | 68 (13.0%) | 126 (23.0%) |
| 2 Vehicles | 158 (30.2%) | 151 (27.6%) |
| 3 Vehicles | 186 (35.6%) | 140 (25.6%) |
| 4 Vehicles | 59 (11.3%) | 50 (9.1%) |
| 5 or more Vehicles | 29 (5.5%) | 76 (13.9%) |
| Total | 523 (100.0%) | 547 (100.0%) |
Commute Time in Pittsville
The most frequently occuring commute durations in Pittsville are 20 to 24 minutes (250 commuters, 24.0%), 30 to 34 minutes (200 commuters, 19.2%), and 15 to 19 minutes (183 commuters, 17.6%).
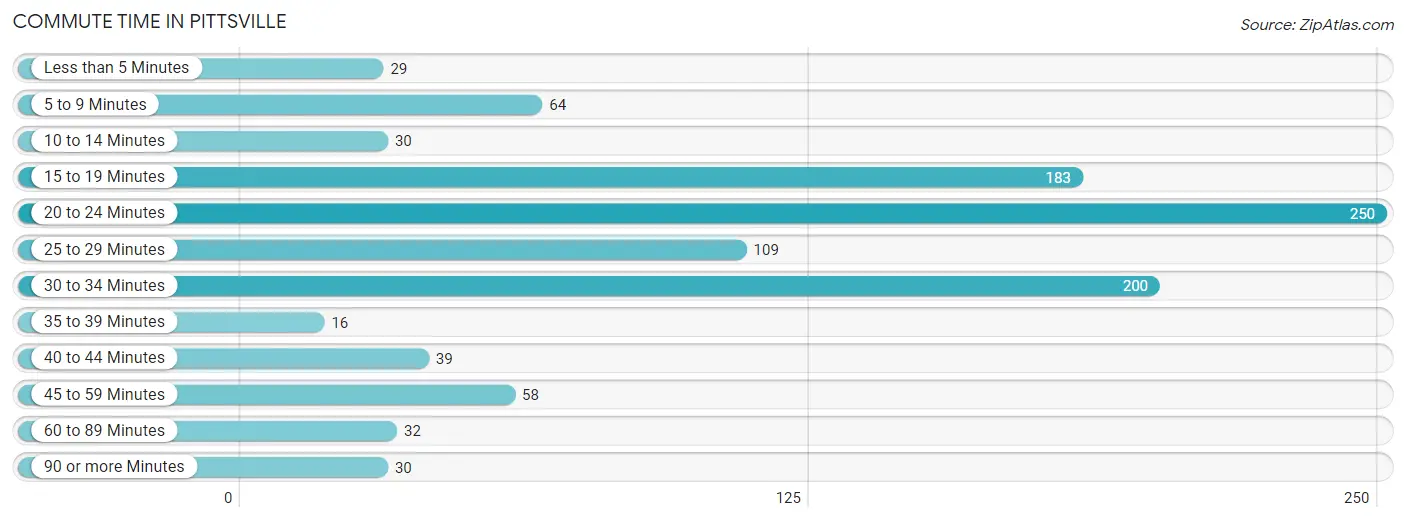
| Commute Time | # Commuters | % Commuters |
| Less than 5 Minutes | 29 | 2.8% |
| 5 to 9 Minutes | 64 | 6.1% |
| 10 to 14 Minutes | 30 | 2.9% |
| 15 to 19 Minutes | 183 | 17.6% |
| 20 to 24 Minutes | 250 | 24.0% |
| 25 to 29 Minutes | 109 | 10.5% |
| 30 to 34 Minutes | 200 | 19.2% |
| 35 to 39 Minutes | 16 | 1.5% |
| 40 to 44 Minutes | 39 | 3.7% |
| 45 to 59 Minutes | 58 | 5.6% |
| 60 to 89 Minutes | 32 | 3.1% |
| 90 or more Minutes | 30 | 2.9% |
Commute Time by Sex in Pittsville
The most common commute times in Pittsville are 30 to 34 minutes (121 commuters, 23.7%) for males and 20 to 24 minutes (136 commuters, 25.7%) for females.
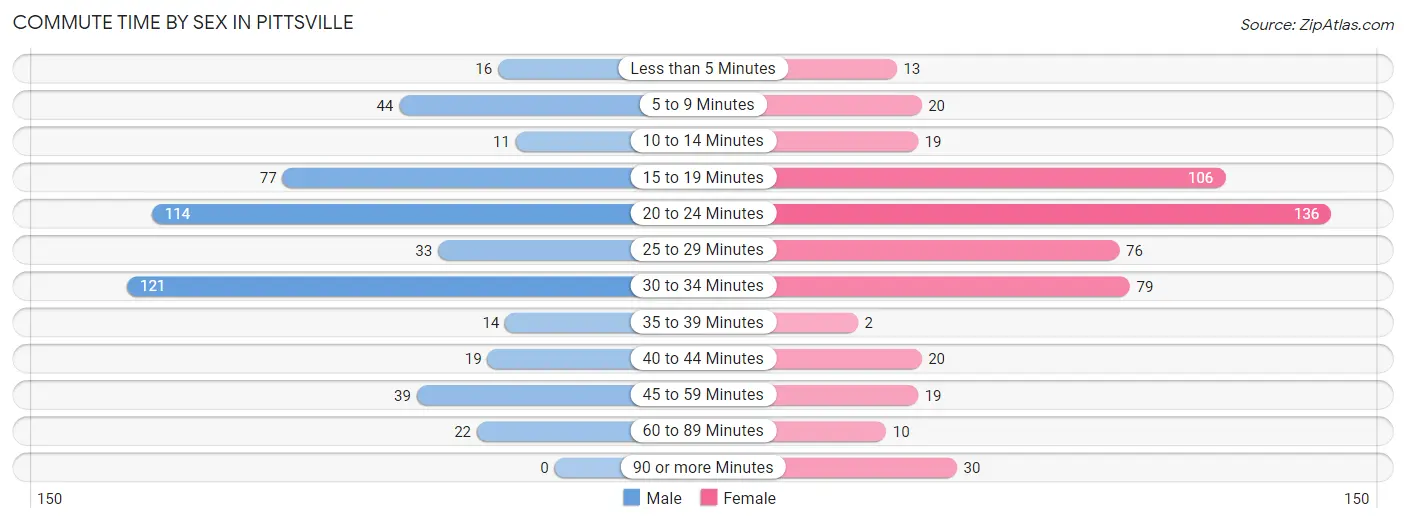
| Commute Time | Male | Female |
| Less than 5 Minutes | 16 (3.1%) | 13 (2.5%) |
| 5 to 9 Minutes | 44 (8.6%) | 20 (3.8%) |
| 10 to 14 Minutes | 11 (2.2%) | 19 (3.6%) |
| 15 to 19 Minutes | 77 (15.1%) | 106 (20.0%) |
| 20 to 24 Minutes | 114 (22.4%) | 136 (25.7%) |
| 25 to 29 Minutes | 33 (6.5%) | 76 (14.3%) |
| 30 to 34 Minutes | 121 (23.7%) | 79 (14.9%) |
| 35 to 39 Minutes | 14 (2.8%) | 2 (0.4%) |
| 40 to 44 Minutes | 19 (3.7%) | 20 (3.8%) |
| 45 to 59 Minutes | 39 (7.6%) | 19 (3.6%) |
| 60 to 89 Minutes | 22 (4.3%) | 10 (1.9%) |
| 90 or more Minutes | 0 (0.0%) | 30 (5.7%) |
Time of Departure to Work by Sex in Pittsville
The most frequent times of departure to work in Pittsville are 7:00 AM to 7:29 AM (123, 24.1%) for males and 7:00 AM to 7:29 AM (146, 27.6%) for females.
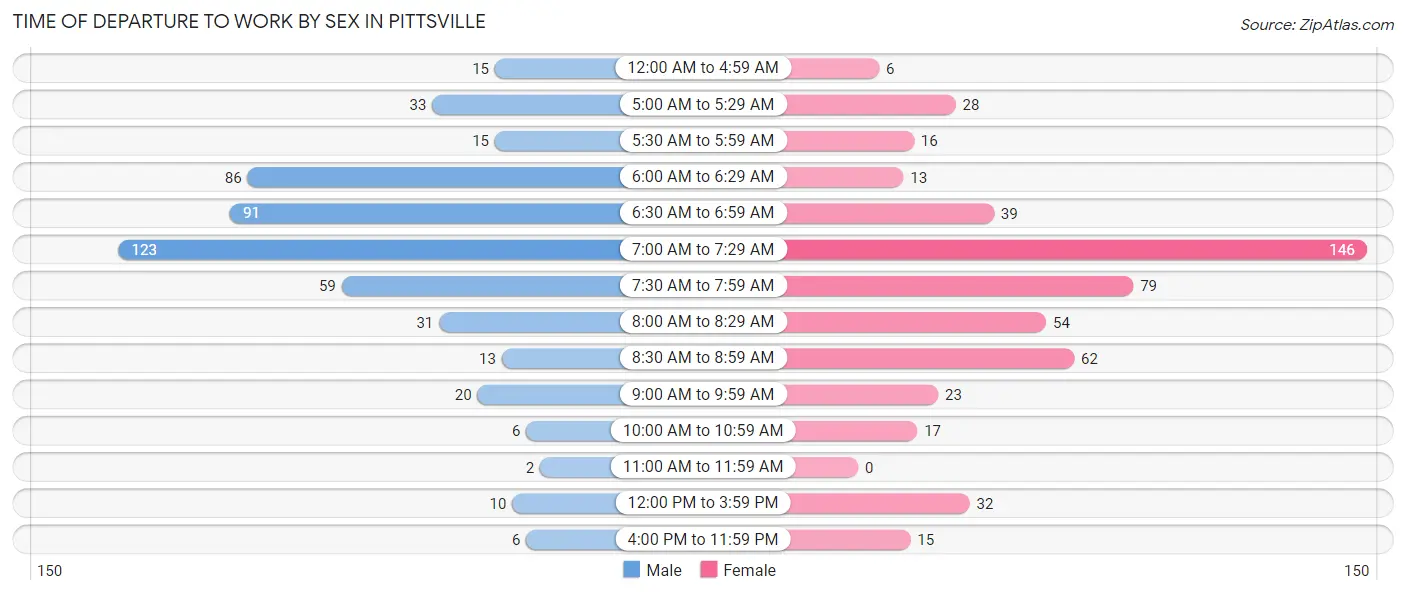
| Time of Departure | Male | Female |
| 12:00 AM to 4:59 AM | 15 (2.9%) | 6 (1.1%) |
| 5:00 AM to 5:29 AM | 33 (6.5%) | 28 (5.3%) |
| 5:30 AM to 5:59 AM | 15 (2.9%) | 16 (3.0%) |
| 6:00 AM to 6:29 AM | 86 (16.9%) | 13 (2.5%) |
| 6:30 AM to 6:59 AM | 91 (17.8%) | 39 (7.4%) |
| 7:00 AM to 7:29 AM | 123 (24.1%) | 146 (27.6%) |
| 7:30 AM to 7:59 AM | 59 (11.6%) | 79 (14.9%) |
| 8:00 AM to 8:29 AM | 31 (6.1%) | 54 (10.2%) |
| 8:30 AM to 8:59 AM | 13 (2.5%) | 62 (11.7%) |
| 9:00 AM to 9:59 AM | 20 (3.9%) | 23 (4.3%) |
| 10:00 AM to 10:59 AM | 6 (1.2%) | 17 (3.2%) |
| 11:00 AM to 11:59 AM | 2 (0.4%) | 0 (0.0%) |
| 12:00 PM to 3:59 PM | 10 (2.0%) | 32 (6.0%) |
| 4:00 PM to 11:59 PM | 6 (1.2%) | 15 (2.8%) |
| Total | 510 (100.0%) | 530 (100.0%) |
Housing Occupancy in Pittsville
Occupancy by Ownership in Pittsville
Of the total 913 dwellings in Pittsville, owner-occupied units account for 733 (80.3%), while renter-occupied units make up 180 (19.7%).
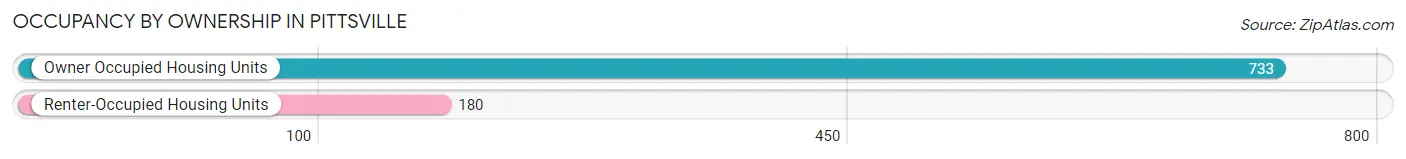
| Occupancy | # Housing Units | % Housing Units |
| Owner Occupied Housing Units | 733 | 80.3% |
| Renter-Occupied Housing Units | 180 | 19.7% |
| Total Occupied Housing Units | 913 | 100.0% |
Occupancy by Household Size in Pittsville
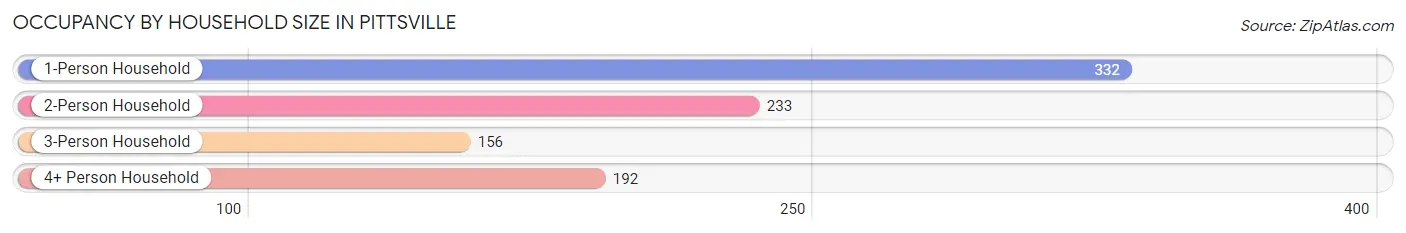
| Household Size | # Housing Units | % Housing Units |
| 1-Person Household | 332 | 36.4% |
| 2-Person Household | 233 | 25.5% |
| 3-Person Household | 156 | 17.1% |
| 4+ Person Household | 192 | 21.0% |
| Total Housing Units | 913 | 100.0% |
Occupancy by Ownership by Household Size in Pittsville
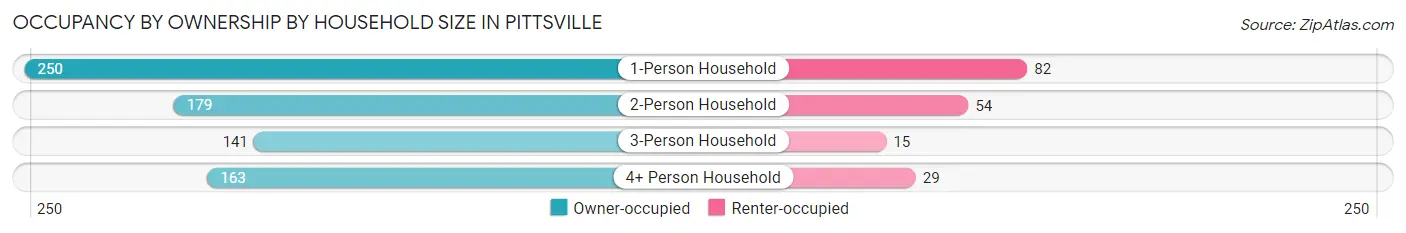
| Household Size | Owner-occupied | Renter-occupied |
| 1-Person Household | 250 (75.3%) | 82 (24.7%) |
| 2-Person Household | 179 (76.8%) | 54 (23.2%) |
| 3-Person Household | 141 (90.4%) | 15 (9.6%) |
| 4+ Person Household | 163 (84.9%) | 29 (15.1%) |
| Total Housing Units | 733 (80.3%) | 180 (19.7%) |
Occupancy by Educational Attainment in Pittsville
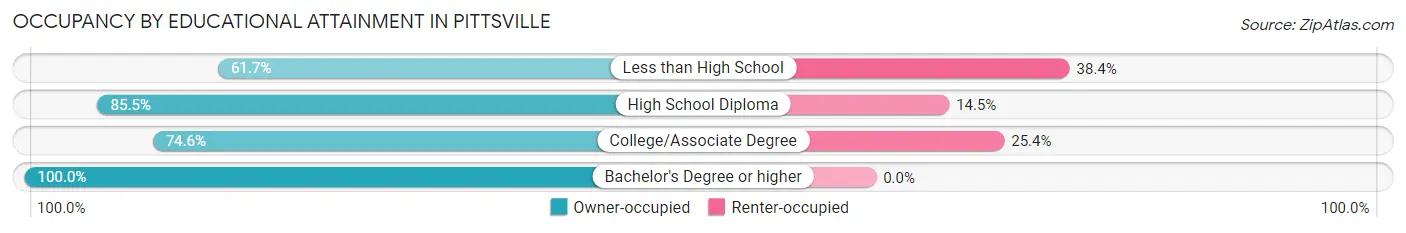
| Household Size | Owner-occupied | Renter-occupied |
| Less than High School | 82 (61.7%) | 51 (38.4%) |
| High School Diploma | 384 (85.5%) | 65 (14.5%) |
| College/Associate Degree | 188 (74.6%) | 64 (25.4%) |
| Bachelor's Degree or higher | 79 (100.0%) | 0 (0.0%) |
Occupancy by Age of Householder in Pittsville
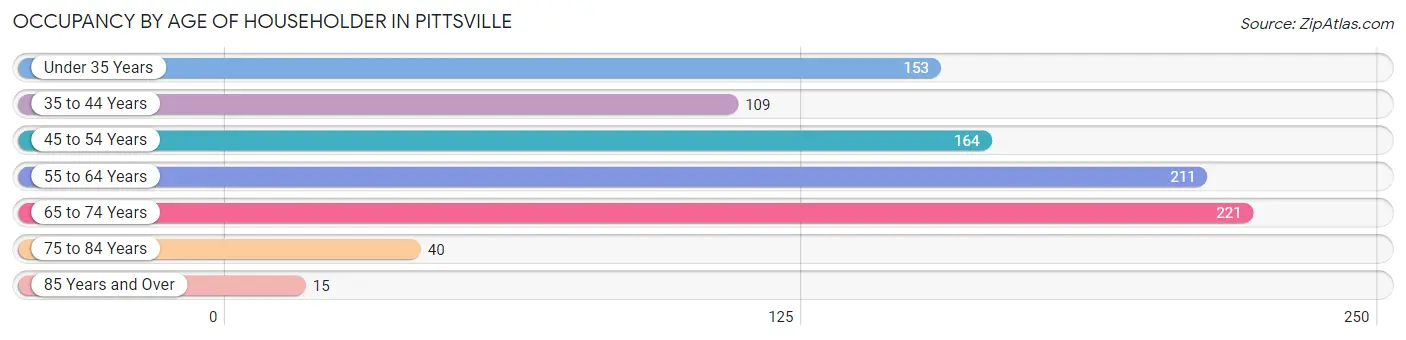
| Age Bracket | # Households | % Households |
| Under 35 Years | 153 | 16.8% |
| 35 to 44 Years | 109 | 11.9% |
| 45 to 54 Years | 164 | 18.0% |
| 55 to 64 Years | 211 | 23.1% |
| 65 to 74 Years | 221 | 24.2% |
| 75 to 84 Years | 40 | 4.4% |
| 85 Years and Over | 15 | 1.6% |
| Total | 913 | 100.0% |
Housing Finances in Pittsville
Median Income by Occupancy in Pittsville
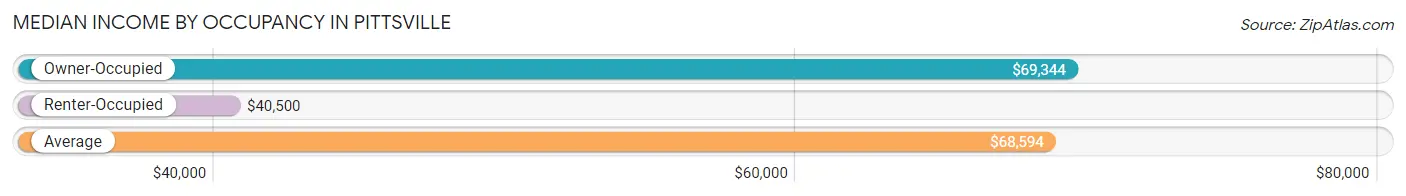
| Occupancy Type | # Households | Median Income |
| Owner-Occupied | 733 (80.3%) | $69,344 |
| Renter-Occupied | 180 (19.7%) | $40,500 |
| Average | 913 (100.0%) | $68,594 |
Occupancy by Householder Income Bracket in Pittsville
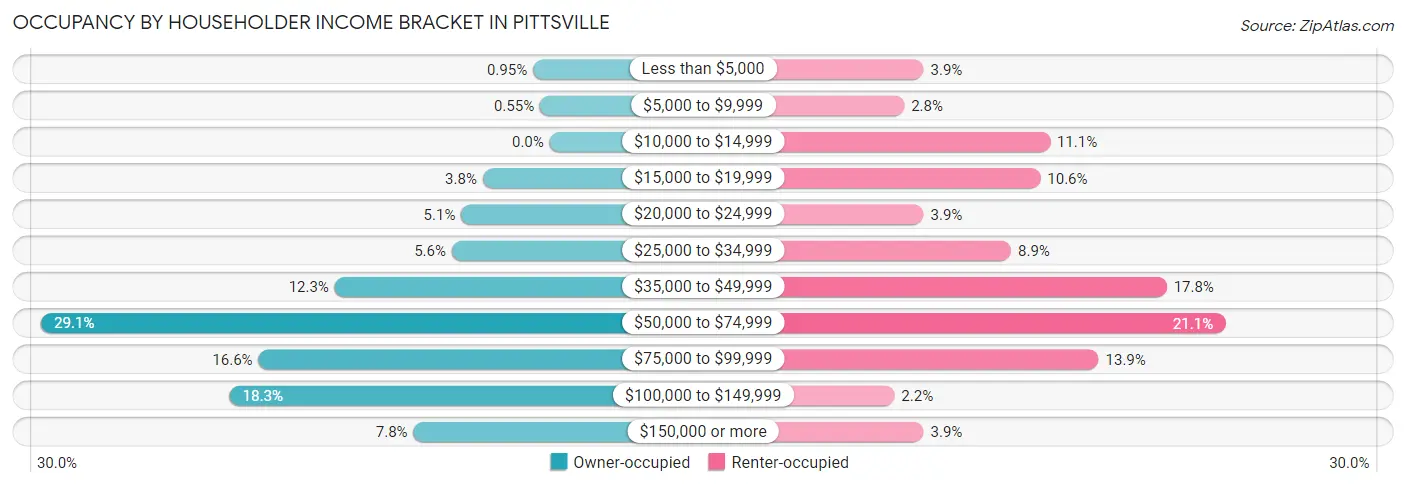
| Income Bracket | Owner-occupied | Renter-occupied |
| Less than $5,000 | 7 (0.9%) | 7 (3.9%) |
| $5,000 to $9,999 | 4 (0.5%) | 5 (2.8%) |
| $10,000 to $14,999 | 0 (0.0%) | 20 (11.1%) |
| $15,000 to $19,999 | 28 (3.8%) | 19 (10.6%) |
| $20,000 to $24,999 | 37 (5.1%) | 7 (3.9%) |
| $25,000 to $34,999 | 41 (5.6%) | 16 (8.9%) |
| $35,000 to $49,999 | 90 (12.3%) | 32 (17.8%) |
| $50,000 to $74,999 | 213 (29.1%) | 38 (21.1%) |
| $75,000 to $99,999 | 122 (16.6%) | 25 (13.9%) |
| $100,000 to $149,999 | 134 (18.3%) | 4 (2.2%) |
| $150,000 or more | 57 (7.8%) | 7 (3.9%) |
| Total | 733 (100.0%) | 180 (100.0%) |
Monthly Housing Cost Tiers in Pittsville
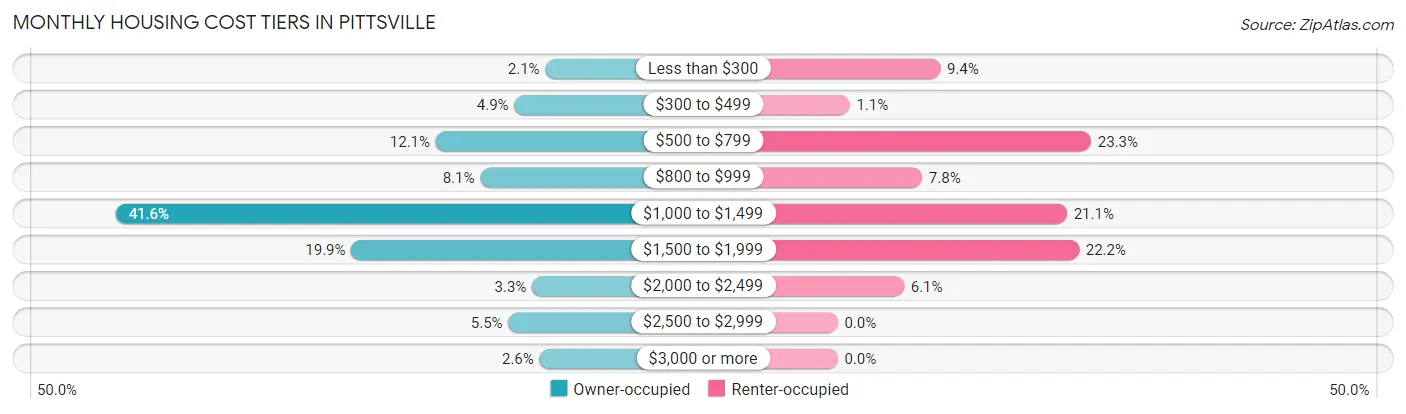
| Monthly Cost | Owner-occupied | Renter-occupied |
| Less than $300 | 15 (2.1%) | 17 (9.4%) |
| $300 to $499 | 36 (4.9%) | 2 (1.1%) |
| $500 to $799 | 89 (12.1%) | 42 (23.3%) |
| $800 to $999 | 59 (8.1%) | 14 (7.8%) |
| $1,000 to $1,499 | 305 (41.6%) | 38 (21.1%) |
| $1,500 to $1,999 | 146 (19.9%) | 40 (22.2%) |
| $2,000 to $2,499 | 24 (3.3%) | 11 (6.1%) |
| $2,500 to $2,999 | 40 (5.5%) | 0 (0.0%) |
| $3,000 or more | 19 (2.6%) | 0 (0.0%) |
| Total | 733 (100.0%) | 180 (100.0%) |
Physical Housing Characteristics in Pittsville
Housing Structures in Pittsville
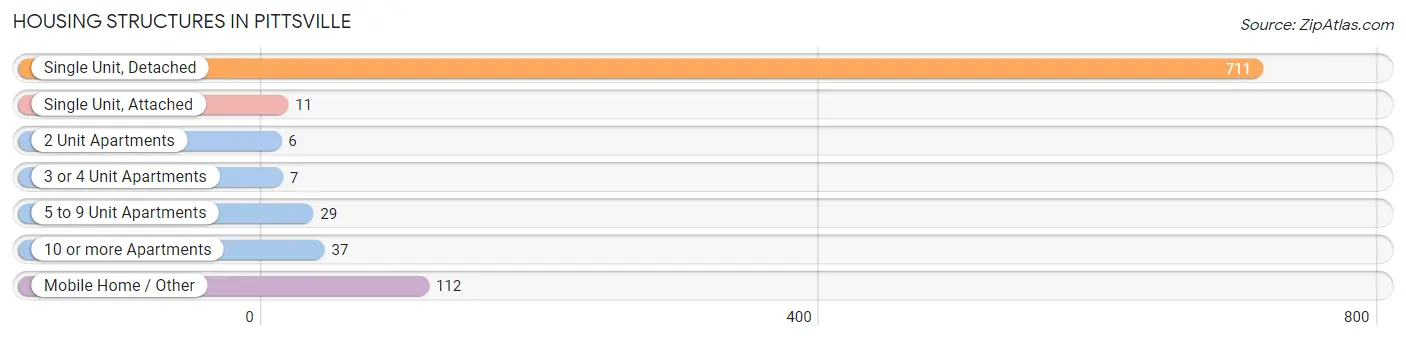
| Structure Type | # Housing Units | % Housing Units |
| Single Unit, Detached | 711 | 77.9% |
| Single Unit, Attached | 11 | 1.2% |
| 2 Unit Apartments | 6 | 0.7% |
| 3 or 4 Unit Apartments | 7 | 0.8% |
| 5 to 9 Unit Apartments | 29 | 3.2% |
| 10 or more Apartments | 37 | 4.1% |
| Mobile Home / Other | 112 | 12.3% |
| Total | 913 | 100.0% |
Housing Structures by Occupancy in Pittsville
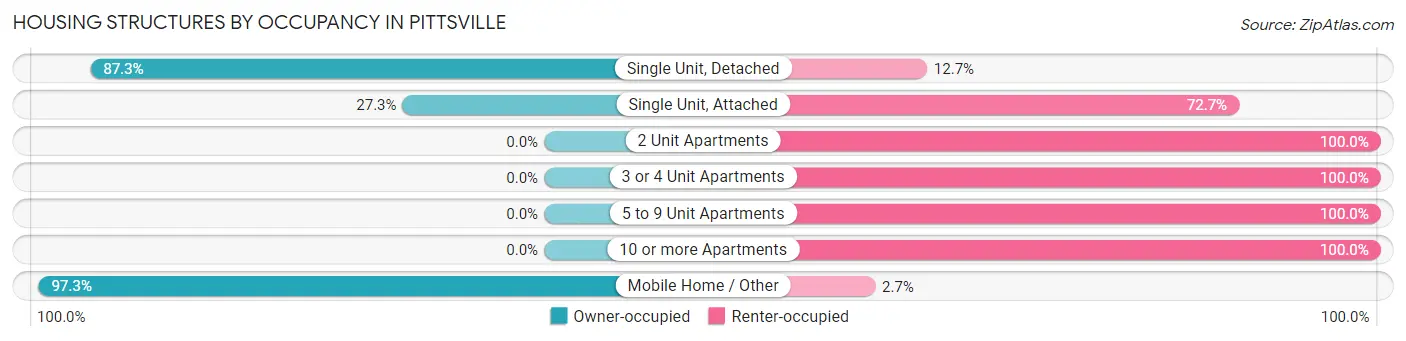
| Structure Type | Owner-occupied | Renter-occupied |
| Single Unit, Detached | 621 (87.3%) | 90 (12.7%) |
| Single Unit, Attached | 3 (27.3%) | 8 (72.7%) |
| 2 Unit Apartments | 0 (0.0%) | 6 (100.0%) |
| 3 or 4 Unit Apartments | 0 (0.0%) | 7 (100.0%) |
| 5 to 9 Unit Apartments | 0 (0.0%) | 29 (100.0%) |
| 10 or more Apartments | 0 (0.0%) | 37 (100.0%) |
| Mobile Home / Other | 109 (97.3%) | 3 (2.7%) |
| Total | 733 (80.3%) | 180 (19.7%) |
Housing Structures by Number of Rooms in Pittsville
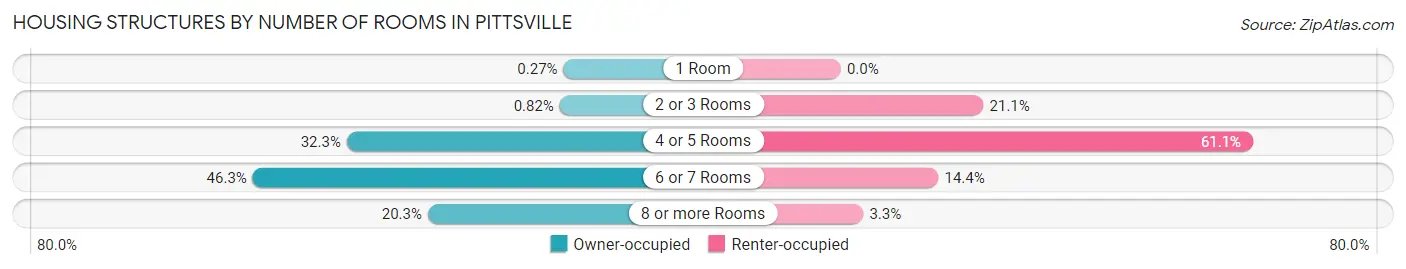
| Number of Rooms | Owner-occupied | Renter-occupied |
| 1 Room | 2 (0.3%) | 0 (0.0%) |
| 2 or 3 Rooms | 6 (0.8%) | 38 (21.1%) |
| 4 or 5 Rooms | 237 (32.3%) | 110 (61.1%) |
| 6 or 7 Rooms | 339 (46.3%) | 26 (14.4%) |
| 8 or more Rooms | 149 (20.3%) | 6 (3.3%) |
| Total | 733 (100.0%) | 180 (100.0%) |
Housing Structure by Heating Type in Pittsville
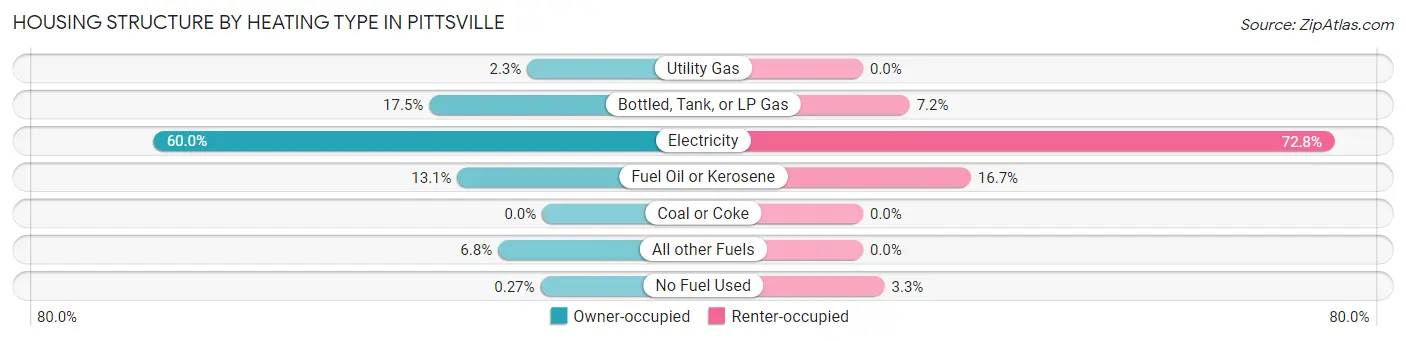
| Heating Type | Owner-occupied | Renter-occupied |
| Utility Gas | 17 (2.3%) | 0 (0.0%) |
| Bottled, Tank, or LP Gas | 128 (17.5%) | 13 (7.2%) |
| Electricity | 440 (60.0%) | 131 (72.8%) |
| Fuel Oil or Kerosene | 96 (13.1%) | 30 (16.7%) |
| Coal or Coke | 0 (0.0%) | 0 (0.0%) |
| All other Fuels | 50 (6.8%) | 0 (0.0%) |
| No Fuel Used | 2 (0.3%) | 6 (3.3%) |
| Total | 733 (100.0%) | 180 (100.0%) |
Household Vehicle Usage in Pittsville
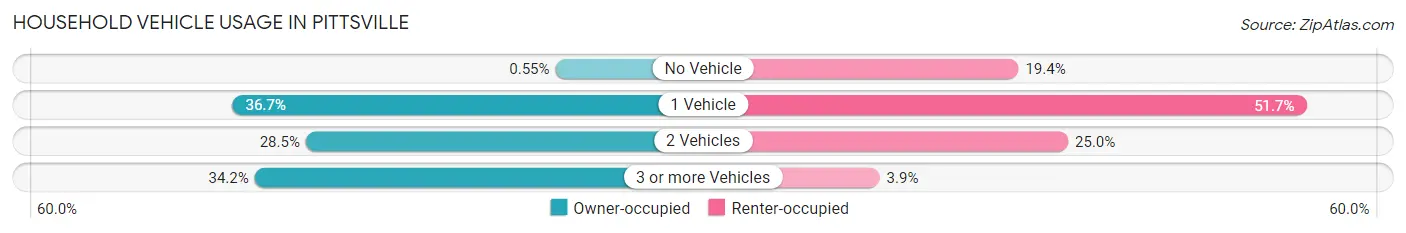
| Vehicles per Household | Owner-occupied | Renter-occupied |
| No Vehicle | 4 (0.5%) | 35 (19.4%) |
| 1 Vehicle | 269 (36.7%) | 93 (51.7%) |
| 2 Vehicles | 209 (28.5%) | 45 (25.0%) |
| 3 or more Vehicles | 251 (34.2%) | 7 (3.9%) |
| Total | 733 (100.0%) | 180 (100.0%) |
Real Estate & Mortgages in Pittsville
Real Estate and Mortgage Overview in Pittsville
| Characteristic | Without Mortgage | With Mortgage |
| Housing Units | 183 | 550 |
| Median Property Value | $118,400 | $214,000 |
| Median Household Income | $49,063 | $55 |
| Monthly Housing Costs | $701 | $19 |
| Real Estate Taxes | $1,169 | $13 |
Property Value by Mortgage Status in Pittsville
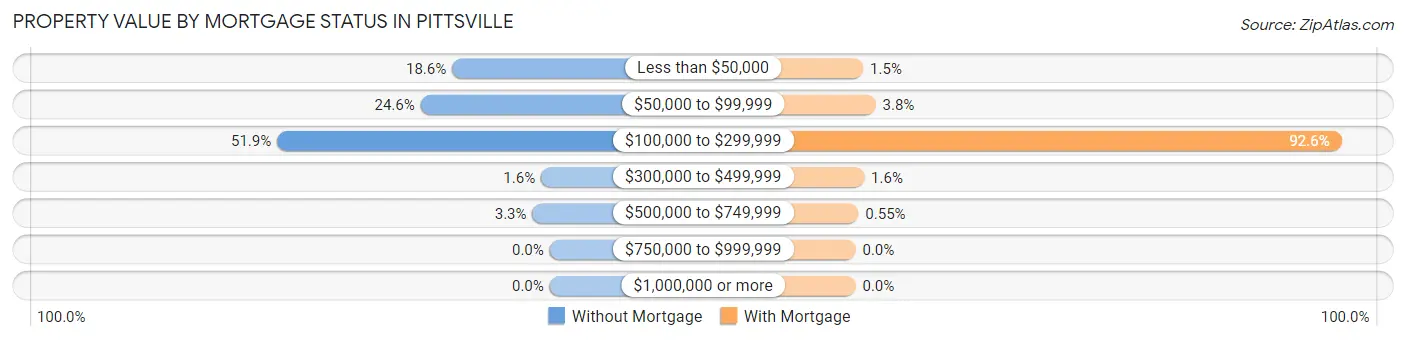
| Property Value | Without Mortgage | With Mortgage |
| Less than $50,000 | 34 (18.6%) | 8 (1.5%) |
| $50,000 to $99,999 | 45 (24.6%) | 21 (3.8%) |
| $100,000 to $299,999 | 95 (51.9%) | 509 (92.5%) |
| $300,000 to $499,999 | 3 (1.6%) | 9 (1.6%) |
| $500,000 to $749,999 | 6 (3.3%) | 3 (0.5%) |
| $750,000 to $999,999 | 0 (0.0%) | 0 (0.0%) |
| $1,000,000 or more | 0 (0.0%) | 0 (0.0%) |
| Total | 183 (100.0%) | 550 (100.0%) |
Household Income by Mortgage Status in Pittsville
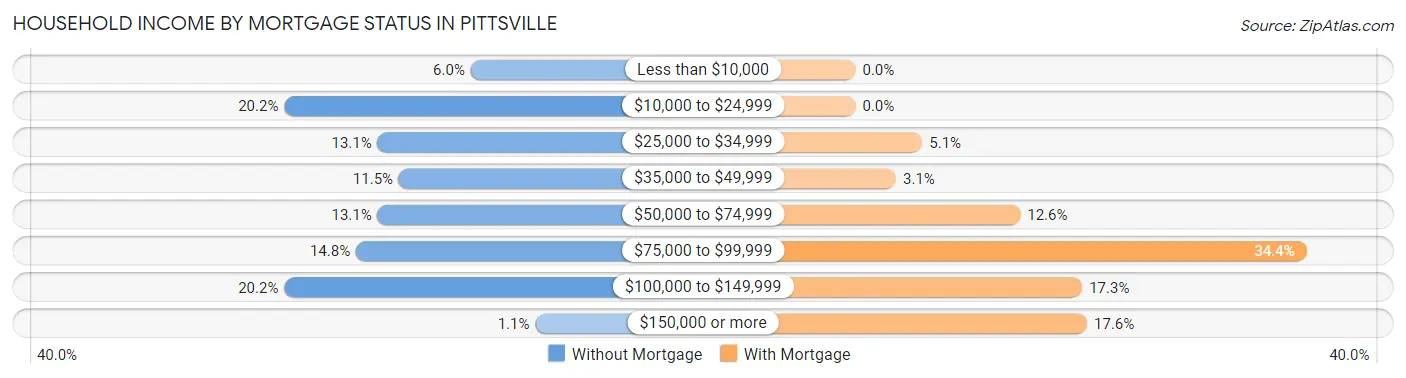
| Household Income | Without Mortgage | With Mortgage |
| Less than $10,000 | 11 (6.0%) | 0 (0.0%) |
| $10,000 to $24,999 | 37 (20.2%) | 0 (0.0%) |
| $25,000 to $34,999 | 24 (13.1%) | 28 (5.1%) |
| $35,000 to $49,999 | 21 (11.5%) | 17 (3.1%) |
| $50,000 to $74,999 | 24 (13.1%) | 69 (12.6%) |
| $75,000 to $99,999 | 27 (14.7%) | 189 (34.4%) |
| $100,000 to $149,999 | 37 (20.2%) | 95 (17.3%) |
| $150,000 or more | 2 (1.1%) | 97 (17.6%) |
| Total | 183 (100.0%) | 550 (100.0%) |
Property Value to Household Income Ratio in Pittsville
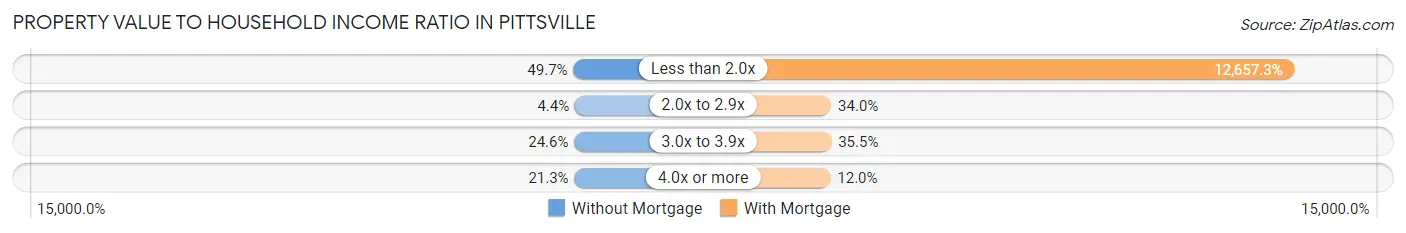
| Value-to-Income Ratio | Without Mortgage | With Mortgage |
| Less than 2.0x | 91 (49.7%) | 69,615 (12,657.3%) |
| 2.0x to 2.9x | 8 (4.4%) | 187 (34.0%) |
| 3.0x to 3.9x | 45 (24.6%) | 195 (35.4%) |
| 4.0x or more | 39 (21.3%) | 66 (12.0%) |
| Total | 183 (100.0%) | 550 (100.0%) |
Real Estate Taxes by Mortgage Status in Pittsville
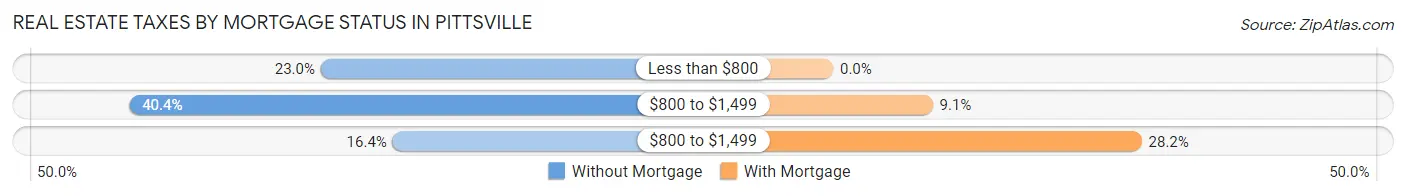
| Property Taxes | Without Mortgage | With Mortgage |
| Less than $800 | 42 (23.0%) | 0 (0.0%) |
| $800 to $1,499 | 74 (40.4%) | 50 (9.1%) |
| $800 to $1,499 | 30 (16.4%) | 155 (28.2%) |
| Total | 183 (100.0%) | 550 (100.0%) |
Health & Disability in Pittsville
Health Insurance Coverage by Age in Pittsville
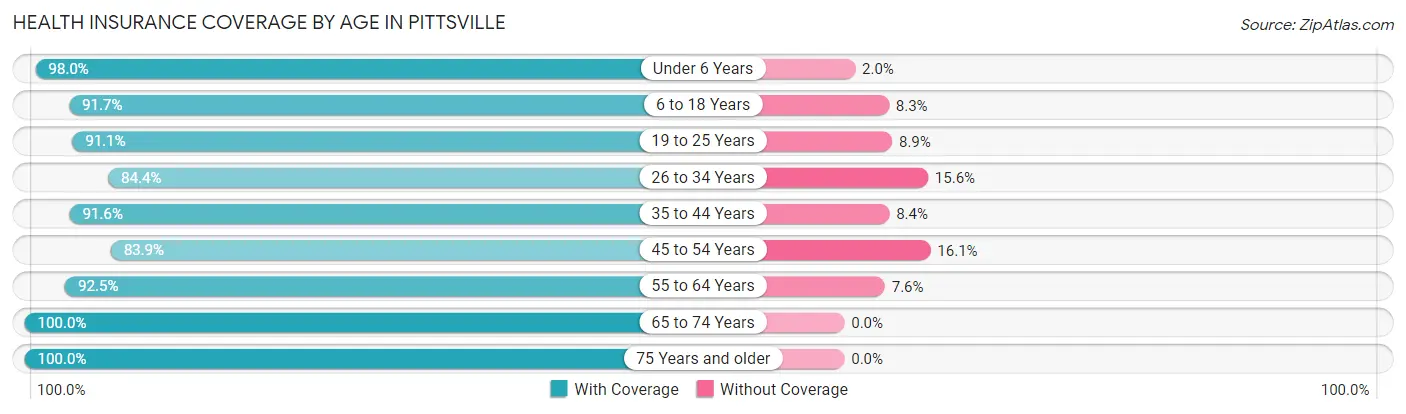
| Age Bracket | With Coverage | Without Coverage |
| Under 6 Years | 194 (98.0%) | 4 (2.0%) |
| 6 to 18 Years | 298 (91.7%) | 27 (8.3%) |
| 19 to 25 Years | 215 (91.1%) | 21 (8.9%) |
| 26 to 34 Years | 222 (84.4%) | 41 (15.6%) |
| 35 to 44 Years | 164 (91.6%) | 15 (8.4%) |
| 45 to 54 Years | 277 (83.9%) | 53 (16.1%) |
| 55 to 64 Years | 294 (92.4%) | 24 (7.5%) |
| 65 to 74 Years | 247 (100.0%) | 0 (0.0%) |
| 75 Years and older | 109 (100.0%) | 0 (0.0%) |
| Total | 2,020 (91.6%) | 185 (8.4%) |
Health Insurance Coverage by Citizenship Status in Pittsville
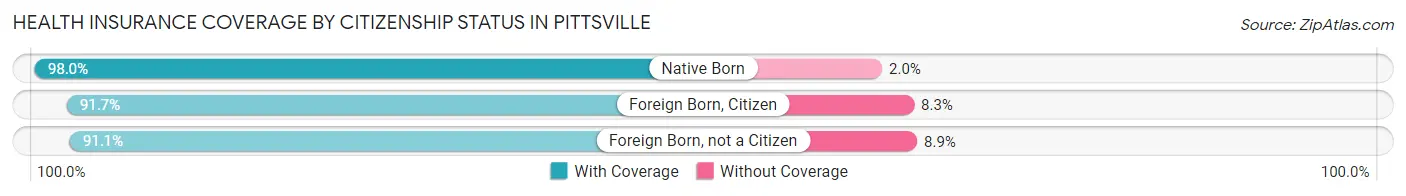
| Citizenship Status | With Coverage | Without Coverage |
| Native Born | 194 (98.0%) | 4 (2.0%) |
| Foreign Born, Citizen | 298 (91.7%) | 27 (8.3%) |
| Foreign Born, not a Citizen | 215 (91.1%) | 21 (8.9%) |
Health Insurance Coverage by Household Income in Pittsville
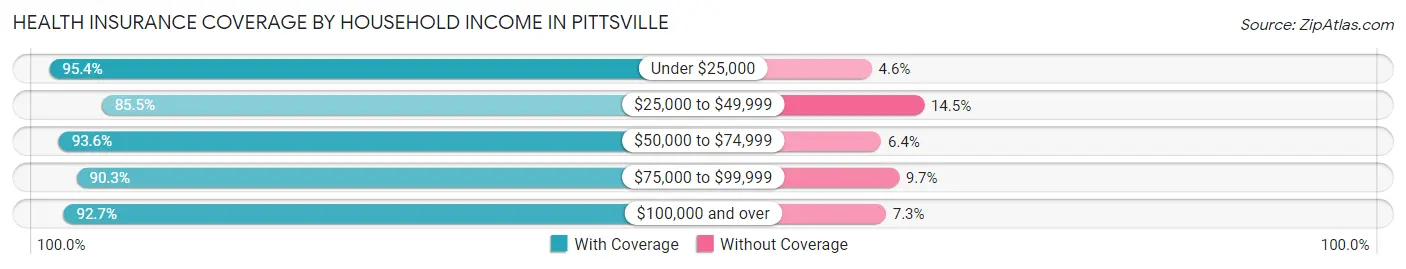
| Household Income | With Coverage | Without Coverage |
| Under $25,000 | 226 (95.4%) | 11 (4.6%) |
| $25,000 to $49,999 | 284 (85.5%) | 48 (14.5%) |
| $50,000 to $74,999 | 510 (93.6%) | 35 (6.4%) |
| $75,000 to $99,999 | 417 (90.3%) | 45 (9.7%) |
| $100,000 and over | 583 (92.7%) | 46 (7.3%) |
Public vs Private Health Insurance Coverage by Age in Pittsville
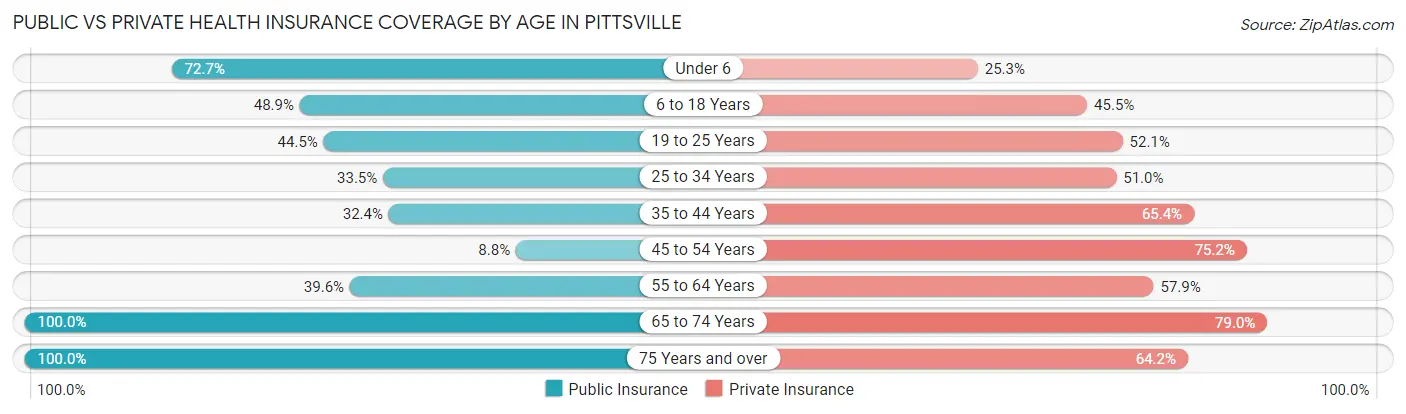
| Age Bracket | Public Insurance | Private Insurance |
| Under 6 | 144 (72.7%) | 50 (25.3%) |
| 6 to 18 Years | 159 (48.9%) | 148 (45.5%) |
| 19 to 25 Years | 105 (44.5%) | 123 (52.1%) |
| 25 to 34 Years | 88 (33.5%) | 134 (50.9%) |
| 35 to 44 Years | 58 (32.4%) | 117 (65.4%) |
| 45 to 54 Years | 29 (8.8%) | 248 (75.1%) |
| 55 to 64 Years | 126 (39.6%) | 184 (57.9%) |
| 65 to 74 Years | 247 (100.0%) | 195 (78.9%) |
| 75 Years and over | 109 (100.0%) | 70 (64.2%) |
| Total | 1,065 (48.3%) | 1,269 (57.6%) |
Disability Status by Sex by Age in Pittsville
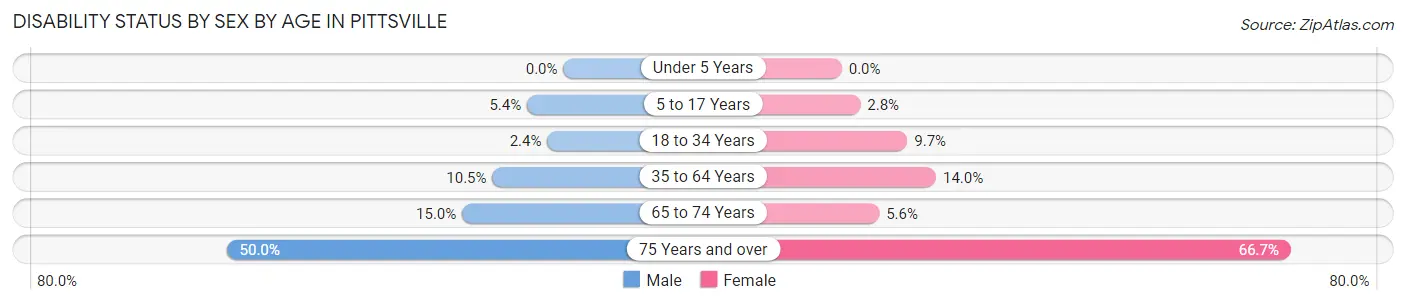
| Age Bracket | Male | Female |
| Under 5 Years | 0 (0.0%) | 0 (0.0%) |
| 5 to 17 Years | 13 (5.4%) | 3 (2.8%) |
| 18 to 34 Years | 6 (2.4%) | 25 (9.7%) |
| 35 to 64 Years | 39 (10.5%) | 64 (14.0%) |
| 65 to 74 Years | 29 (15.0%) | 3 (5.6%) |
| 75 Years and over | 20 (50.0%) | 46 (66.7%) |
Disability Class by Sex by Age in Pittsville
Disability Class: Hearing Difficulty
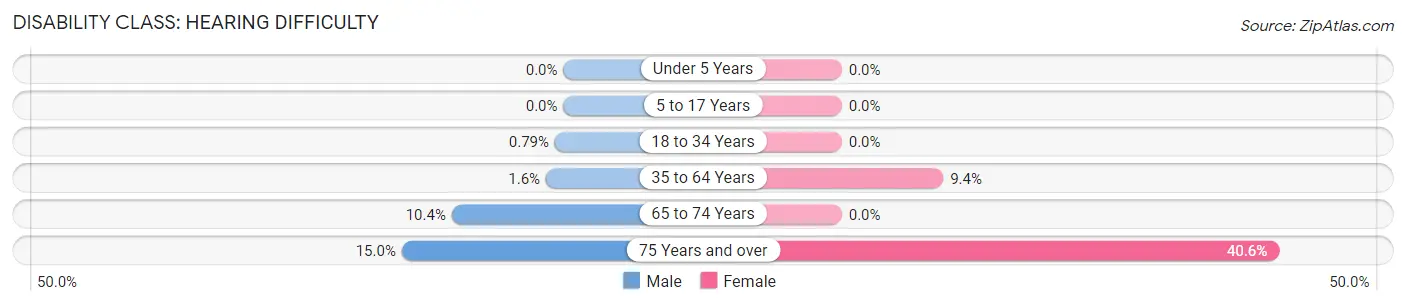
| Age Bracket | Male | Female |
| Under 5 Years | 0 (0.0%) | 0 (0.0%) |
| 5 to 17 Years | 0 (0.0%) | 0 (0.0%) |
| 18 to 34 Years | 2 (0.8%) | 0 (0.0%) |
| 35 to 64 Years | 6 (1.6%) | 43 (9.4%) |
| 65 to 74 Years | 20 (10.4%) | 0 (0.0%) |
| 75 Years and over | 6 (15.0%) | 28 (40.6%) |
Disability Class: Vision Difficulty
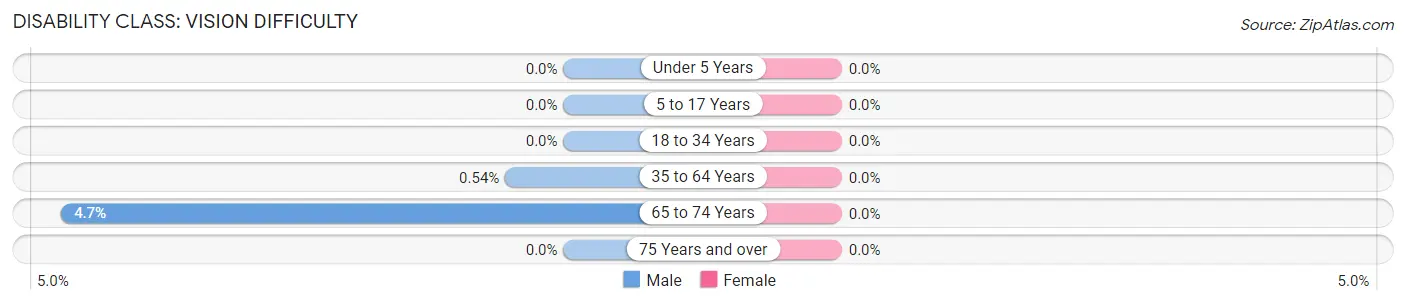
| Age Bracket | Male | Female |
| Under 5 Years | 0 (0.0%) | 0 (0.0%) |
| 5 to 17 Years | 0 (0.0%) | 0 (0.0%) |
| 18 to 34 Years | 0 (0.0%) | 0 (0.0%) |
| 35 to 64 Years | 2 (0.5%) | 0 (0.0%) |
| 65 to 74 Years | 9 (4.7%) | 0 (0.0%) |
| 75 Years and over | 0 (0.0%) | 0 (0.0%) |
Disability Class: Cognitive Difficulty
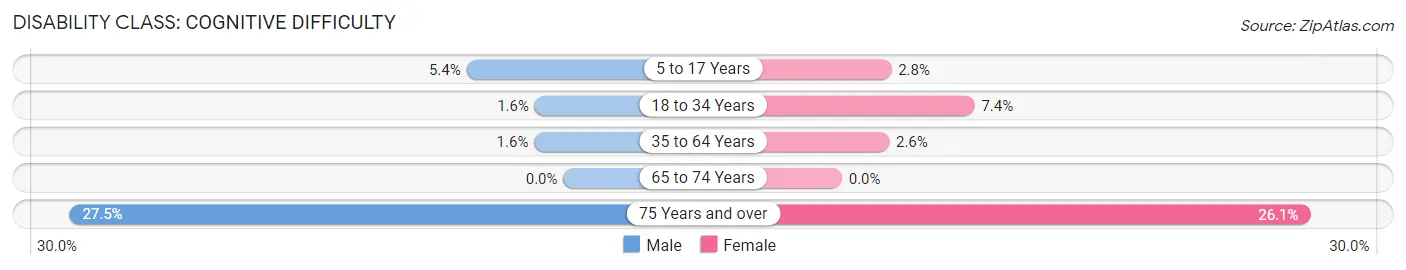
| Age Bracket | Male | Female |
| 5 to 17 Years | 13 (5.4%) | 3 (2.8%) |
| 18 to 34 Years | 4 (1.6%) | 19 (7.4%) |
| 35 to 64 Years | 6 (1.6%) | 12 (2.6%) |
| 65 to 74 Years | 0 (0.0%) | 0 (0.0%) |
| 75 Years and over | 11 (27.5%) | 18 (26.1%) |
Disability Class: Ambulatory Difficulty
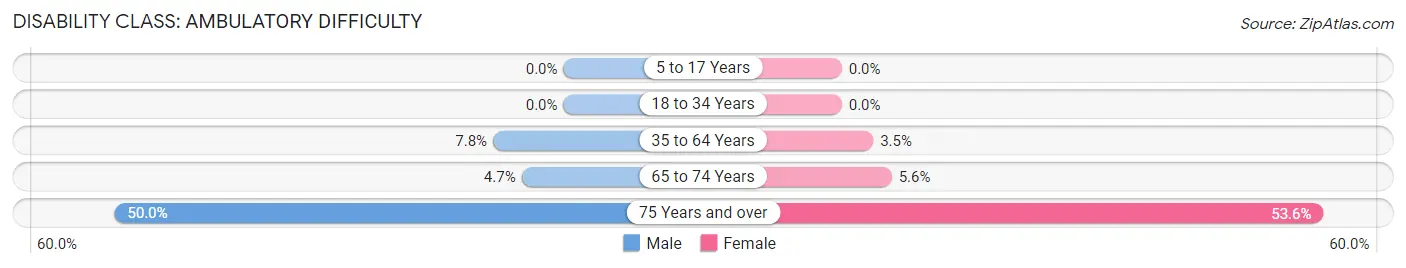
| Age Bracket | Male | Female |
| 5 to 17 Years | 0 (0.0%) | 0 (0.0%) |
| 18 to 34 Years | 0 (0.0%) | 0 (0.0%) |
| 35 to 64 Years | 29 (7.8%) | 16 (3.5%) |
| 65 to 74 Years | 9 (4.7%) | 3 (5.6%) |
| 75 Years and over | 20 (50.0%) | 37 (53.6%) |
Disability Class: Self-Care Difficulty
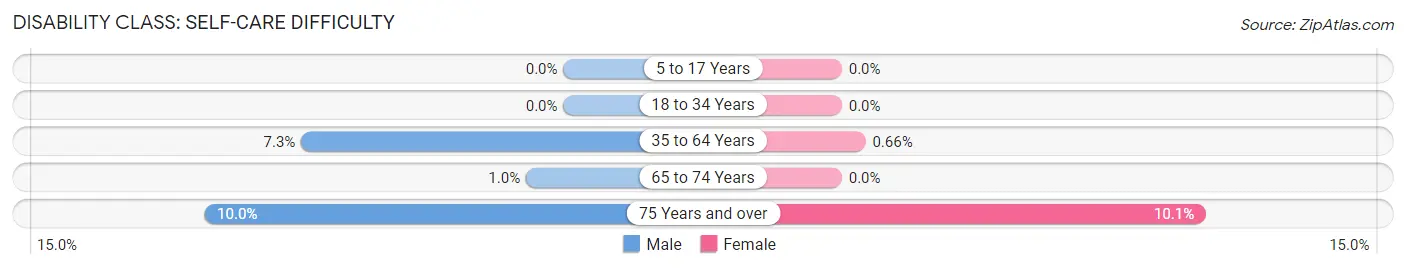
| Age Bracket | Male | Female |
| 5 to 17 Years | 0 (0.0%) | 0 (0.0%) |
| 18 to 34 Years | 0 (0.0%) | 0 (0.0%) |
| 35 to 64 Years | 27 (7.3%) | 3 (0.7%) |
| 65 to 74 Years | 2 (1.0%) | 0 (0.0%) |
| 75 Years and over | 4 (10.0%) | 7 (10.1%) |
Technology Access in Pittsville
Computing Device Access in Pittsville
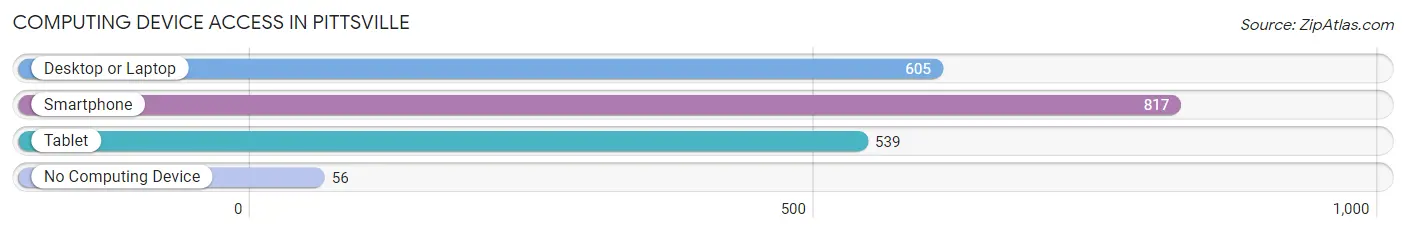
| Device Type | # Households | % Households |
| Desktop or Laptop | 605 | 66.3% |
| Smartphone | 817 | 89.5% |
| Tablet | 539 | 59.0% |
| No Computing Device | 56 | 6.1% |
| Total | 913 | 100.0% |
Internet Access in Pittsville
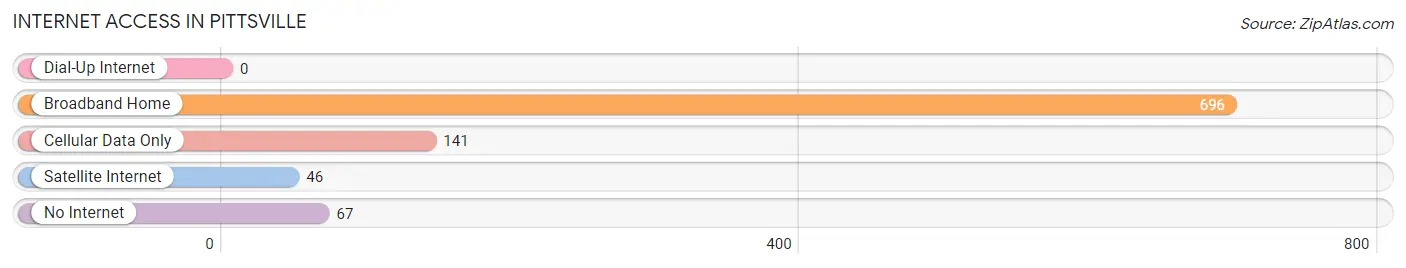
| Internet Type | # Households | % Households |
| Dial-Up Internet | 0 | 0.0% |
| Broadband Home | 696 | 76.2% |
| Cellular Data Only | 141 | 15.4% |
| Satellite Internet | 46 | 5.0% |
| No Internet | 67 | 7.3% |
| Total | 913 | 100.0% |
Pittsville Summary
Pittsville, Maryland is a small town located in Wicomico County, Maryland. It is situated on the banks of the Nanticoke River, about 10 miles south of Salisbury. The town was founded in 1867 and was named after the Pitts family, who were early settlers in the area. The population of Pittsville was 1,845 at the 2010 census.
History
The area that is now Pittsville was originally inhabited by the Nanticoke Indians. The first European settlers arrived in the area in the late 1600s. The town was founded in 1867 by the Pitts family, who were early settlers in the area. The town was named after the Pitts family, who were prominent in the area.
The town was originally a farming community, but in the late 1800s, the town began to grow and develop. The town was incorporated in 1887 and the first mayor was elected in 1888. The town was a popular destination for tourists, and the town was known for its beautiful scenery and its many attractions.
In the early 1900s, the town began to experience a decline in population. This was due to the decline of the farming industry and the lack of industry in the area. The town was also affected by the Great Depression, which caused many people to leave the area in search of work.
In the 1950s, the town began to experience a resurgence in population. This was due to the development of the nearby Salisbury-Ocean City Airport, which brought new jobs and businesses to the area. The town also experienced a growth in tourism, as people began to visit the area for its beautiful scenery and attractions.
Geography
Pittsville is located in Wicomico County, Maryland. It is situated on the banks of the Nanticoke River, about 10 miles south of Salisbury. The town is located in a rural area, and is surrounded by farmland and forests. The town is located in the Eastern Shore region of Maryland, and is part of the Delmarva Peninsula.
The town has a total area of 1.2 square miles, all of which is land. The town is located at an elevation of 28 feet above sea level. The climate in Pittsville is humid subtropical, with hot, humid summers and mild winters.
Economy
The economy of Pittsville is largely based on agriculture and tourism. The town is home to several farms, which produce a variety of crops, including corn, soybeans, wheat, and hay. The town is also home to several tourist attractions, including the Nanticoke River Museum, the Pittsville Historical Society, and the Pittsville Wildlife Refuge.
The town is also home to several businesses, including restaurants, retail stores, and service providers. The town is also home to several manufacturing companies, which produce a variety of products, including furniture, clothing, and electronics.
Demographics
As of the 2010 census, the population of Pittsville was 1,845. The racial makeup of the town was 94.3% White, 2.7% African American, 0.3% Native American, 0.7% Asian, 0.1% Pacific Islander, 0.7% from other races, and 1.2% from two or more races. Hispanic or Latino of any race were 2.2% of the population.
The median income for a household in the town was $41,250, and the median income for a family was $50,000. The per capita income for the town was $20,845. About 11.2% of families and 14.2% of the population were below the poverty line, including 18.2% of those under age 18 and 8.3% of those age 65 or over.
Common Questions
What is Per Capita Income in Pittsville?
Per Capita income in Pittsville is $29,513.
What is the Median Family Income in Pittsville?
Median Family Income in Pittsville is $81,912.
What is the Median Household income in Pittsville?
Median Household Income in Pittsville is $68,594.
What is Income or Wage Gap in Pittsville?
Income or Wage Gap in Pittsville is 33.9%.
Women in Pittsville earn 66.1 cents for every dollar earned by a man.
What is Family Income Deficit in Pittsville?
Family Income Deficit in Pittsville is $6,456.
Families that are below poverty line in Pittsville earn $6,456 less on average than the poverty threshold level.
What is Inequality or Gini Index in Pittsville?
Inequality or Gini Index in Pittsville is 0.33.
What is the Total Population of Pittsville?
Total Population of Pittsville is 2,205.
What is the Total Male Population of Pittsville?
Total Male Population of Pittsville is 1,179.
What is the Total Female Population of Pittsville?
Total Female Population of Pittsville is 1,026.
What is the Ratio of Males per 100 Females in Pittsville?
There are 114.91 Males per 100 Females in Pittsville.
What is the Ratio of Females per 100 Males in Pittsville?
There are 87.02 Females per 100 Males in Pittsville.
What is the Median Population Age in Pittsville?
Median Population Age in Pittsville is 39.2 Years.
What is the Average Family Size in Pittsville
Average Family Size in Pittsville is 3.0 People.
What is the Average Household Size in Pittsville
Average Household Size in Pittsville is 2.4 People.
How Large is the Labor Force in Pittsville?
There are 1,108 People in the Labor Forcein in Pittsville.
What is the Percentage of People in the Labor Force in Pittsville?
62.8% of People are in the Labor Force in Pittsville.
What is the Unemployment Rate in Pittsville?
Unemployment Rate in Pittsville is 3.3%.