Galesville, MD Map & Demographics
Galesville Map
Galesville Overview
$53,010
PER CAPITA INCOME
$188,194
AVG FAMILY INCOME
$188,333
AVG HOUSEHOLD INCOME
0.25
INEQUALITY / GINI INDEX
1,226
TOTAL POPULATION
576
MALE POPULATION
650
FEMALE POPULATION
88.62
MALES / 100 FEMALES
112.85
FEMALES / 100 MALES
51.7
MEDIAN AGE
3.2
AVG FAMILY SIZE
3.0
AVG HOUSEHOLD SIZE
577
LABOR FORCE [ PEOPLE ]
51.3%
PERCENT IN LABOR FORCE
2.8%
UNEMPLOYMENT RATE
Galesville Zip Codes
Galesville Area Codes
Income in Galesville
Income Overview in Galesville
Per Capita Income in Galesville is $53,010, while median incomes of families and households are $188,194 and $188,333 respectively.
| Characteristic | Number | Measure |
| Per Capita Income | 1,226 | $53,010 |
| Median Family Income | 319 | $188,194 |
| Mean Family Income | 319 | $161,223 |
| Median Household Income | 404 | $188,333 |
| Mean Household Income | 404 | $153,473 |
| Income Deficit | 319 | $0 |
| Wage / Income Gap (%) | 1,226 | 0.00% |
| Wage / Income Gap ($) | 1,226 | 100.00¢ per $1 |
| Gini / Inequality Index | 1,226 | 0.25 |
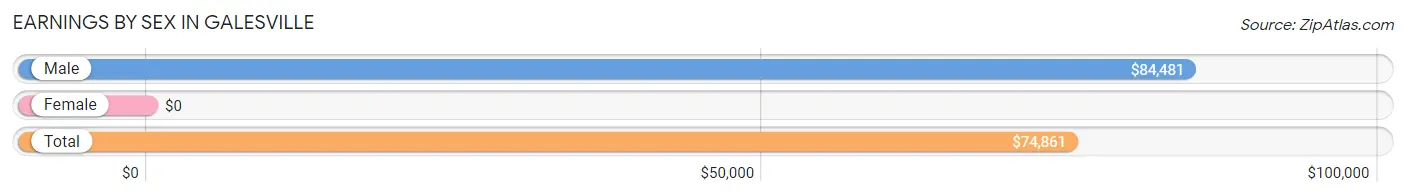
Earnings by Sex in Galesville
| Sex | Number | Average Earnings |
| Male | 380 (67.7%) | $84,481 |
| Female | 181 (32.3%) | $0 |
| Total | 561 (100.0%) | $74,861 |
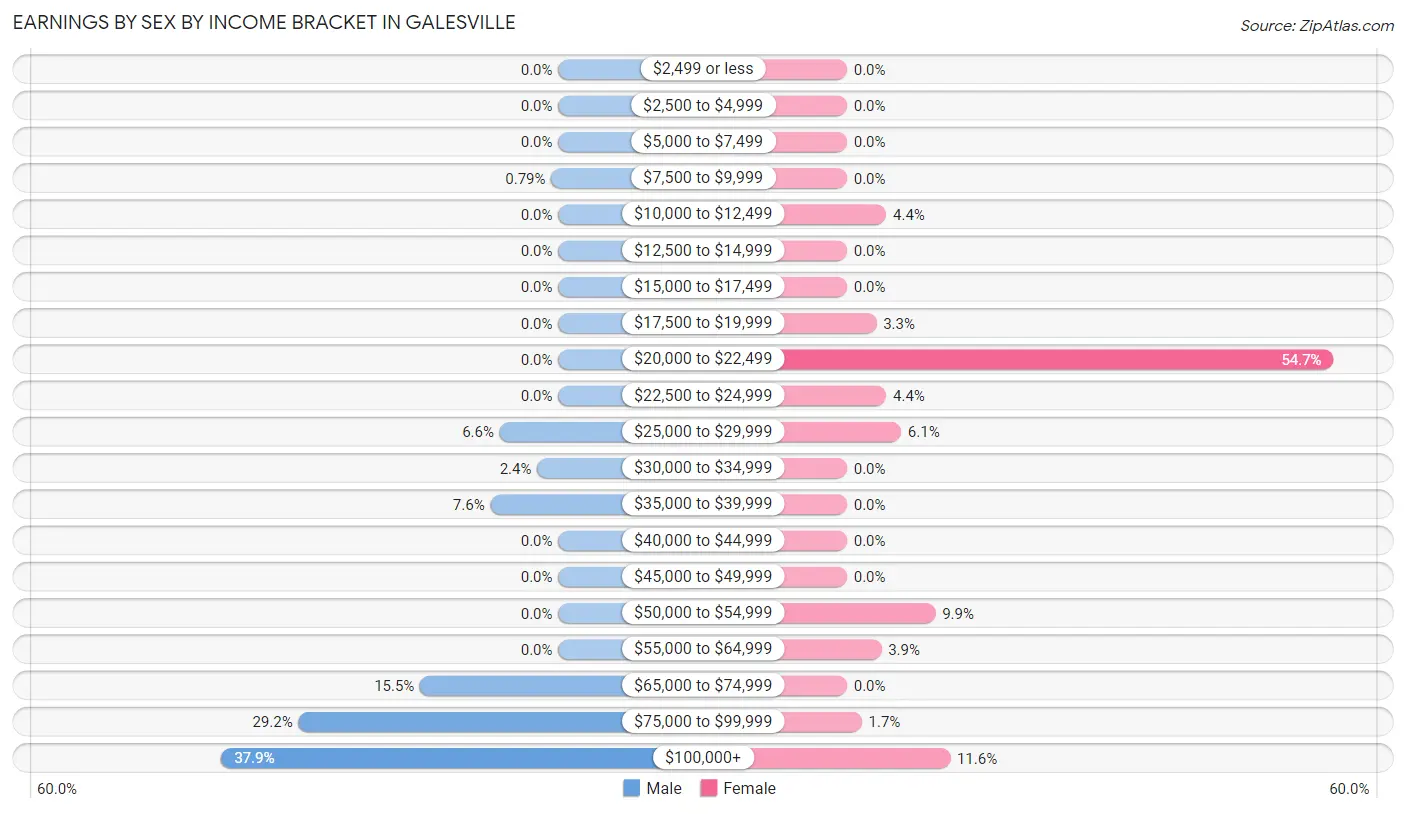
Earnings by Sex by Income Bracket in Galesville
The most common earnings brackets in Galesville are $100,000+ for men (144 | 37.9%) and $20,000 to $22,499 for women (99 | 54.7%).
| Income | Male | Female |
| $2,499 or less | 0 (0.0%) | 0 (0.0%) |
| $2,500 to $4,999 | 0 (0.0%) | 0 (0.0%) |
| $5,000 to $7,499 | 0 (0.0%) | 0 (0.0%) |
| $7,500 to $9,999 | 3 (0.8%) | 0 (0.0%) |
| $10,000 to $12,499 | 0 (0.0%) | 8 (4.4%) |
| $12,500 to $14,999 | 0 (0.0%) | 0 (0.0%) |
| $15,000 to $17,499 | 0 (0.0%) | 0 (0.0%) |
| $17,500 to $19,999 | 0 (0.0%) | 6 (3.3%) |
| $20,000 to $22,499 | 0 (0.0%) | 99 (54.7%) |
| $22,500 to $24,999 | 0 (0.0%) | 8 (4.4%) |
| $25,000 to $29,999 | 25 (6.6%) | 11 (6.1%) |
| $30,000 to $34,999 | 9 (2.4%) | 0 (0.0%) |
| $35,000 to $39,999 | 29 (7.6%) | 0 (0.0%) |
| $40,000 to $44,999 | 0 (0.0%) | 0 (0.0%) |
| $45,000 to $49,999 | 0 (0.0%) | 0 (0.0%) |
| $50,000 to $54,999 | 0 (0.0%) | 18 (9.9%) |
| $55,000 to $64,999 | 0 (0.0%) | 7 (3.9%) |
| $65,000 to $74,999 | 59 (15.5%) | 0 (0.0%) |
| $75,000 to $99,999 | 111 (29.2%) | 3 (1.7%) |
| $100,000+ | 144 (37.9%) | 21 (11.6%) |
| Total | 380 (100.0%) | 181 (100.0%) |
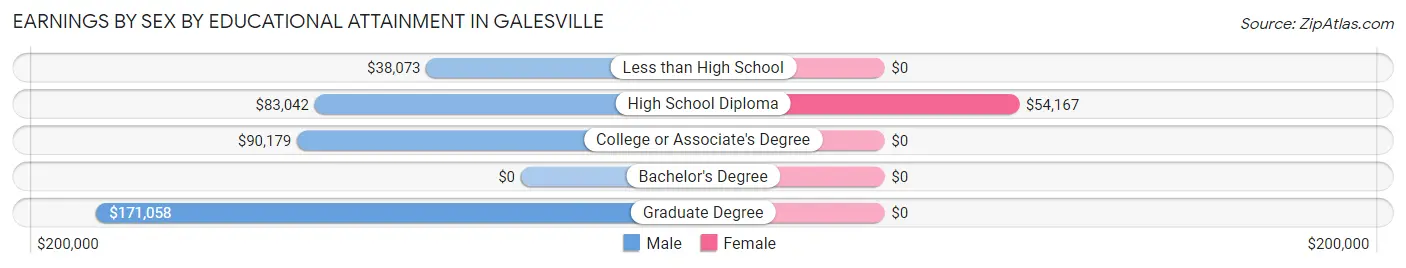
Earnings by Sex by Educational Attainment in Galesville
| Educational Attainment | Male Income | Female Income |
| Less than High School | $38,073 | $0 |
| High School Diploma | $83,042 | $54,167 |
| College or Associate's Degree | $90,179 | $0 |
| Bachelor's Degree | - | - |
| Graduate Degree | $171,058 | $0 |
| Total | $84,599 | $0 |
Family Income in Galesville
Family Income Brackets in Galesville
According to the Galesville family income data, there are 182 families falling into the $150,000 to $199,999 income range, which is the most common income bracket and makes up 57.1% of all families.
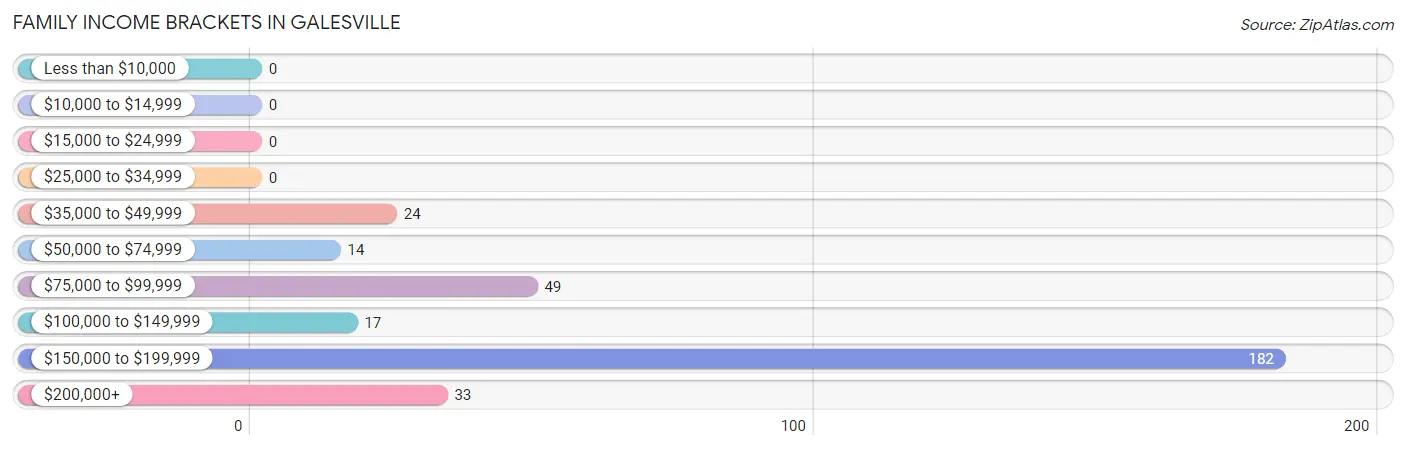
| Income Bracket | # Families | % Families |
| Less than $10,000 | 0 | 0.0% |
| $10,000 to $14,999 | 0 | 0.0% |
| $15,000 to $24,999 | 0 | 0.0% |
| $25,000 to $34,999 | 0 | 0.0% |
| $35,000 to $49,999 | 24 | 7.5% |
| $50,000 to $74,999 | 14 | 4.4% |
| $75,000 to $99,999 | 49 | 15.4% |
| $100,000 to $149,999 | 17 | 5.3% |
| $150,000 to $199,999 | 182 | 57.1% |
| $200,000+ | 33 | 10.3% |
Family Income by Famaliy Size in Galesville
4-person families (172 | 53.9%) account for the highest median family income in Galesville with $190,433 per family, while 4-person families (172 | 53.9%) have the highest median income of $47,608 per family member.
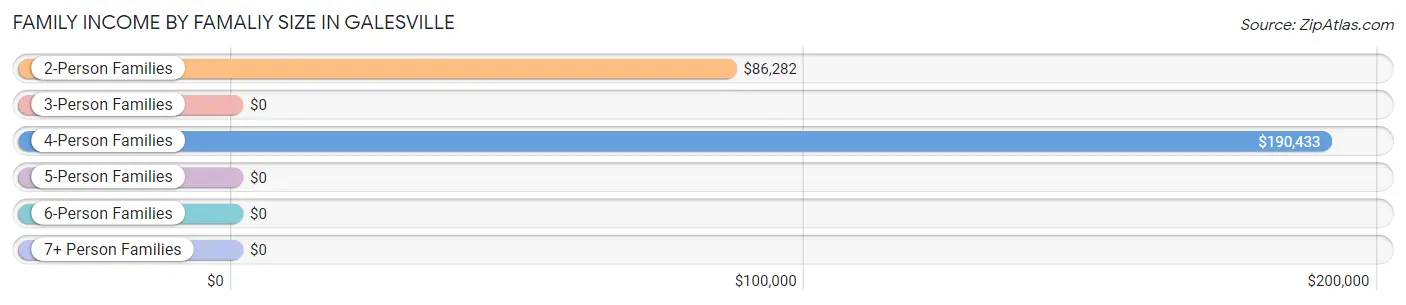
| Income Bracket | # Families | Median Income |
| 2-Person Families | 116 (36.4%) | $86,282 |
| 3-Person Families | 25 (7.8%) | $0 |
| 4-Person Families | 172 (53.9%) | $190,433 |
| 5-Person Families | 0 (0.0%) | $0 |
| 6-Person Families | 6 (1.9%) | $0 |
| 7+ Person Families | 0 (0.0%) | $0 |
| Total | 319 (100.0%) | $188,194 |
Family Income by Number of Earners in Galesville
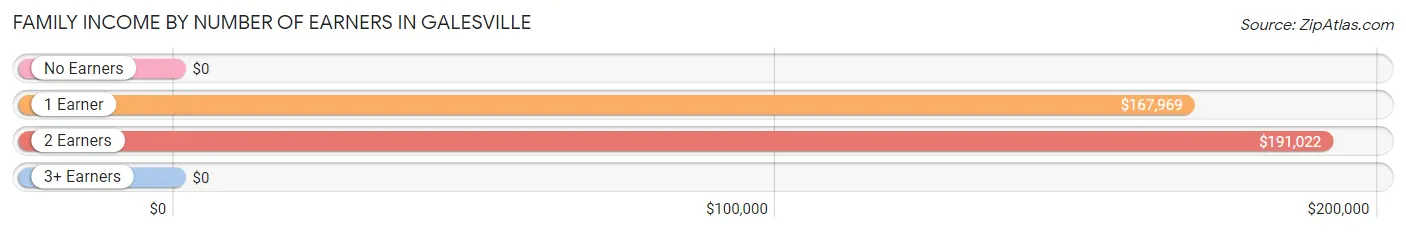
| Number of Earners | # Families | Median Income |
| No Earners | 16 (5.0%) | $0 |
| 1 Earner | 150 (47.0%) | $167,969 |
| 2 Earners | 143 (44.8%) | $191,022 |
| 3+ Earners | 10 (3.1%) | $0 |
| Total | 319 (100.0%) | $188,194 |
Household Income in Galesville
Household Income Brackets in Galesville
With 216 households falling in the category, the $150,000 to $199,999 income range is the most frequent in Galesville, accounting for 53.5% of all households.
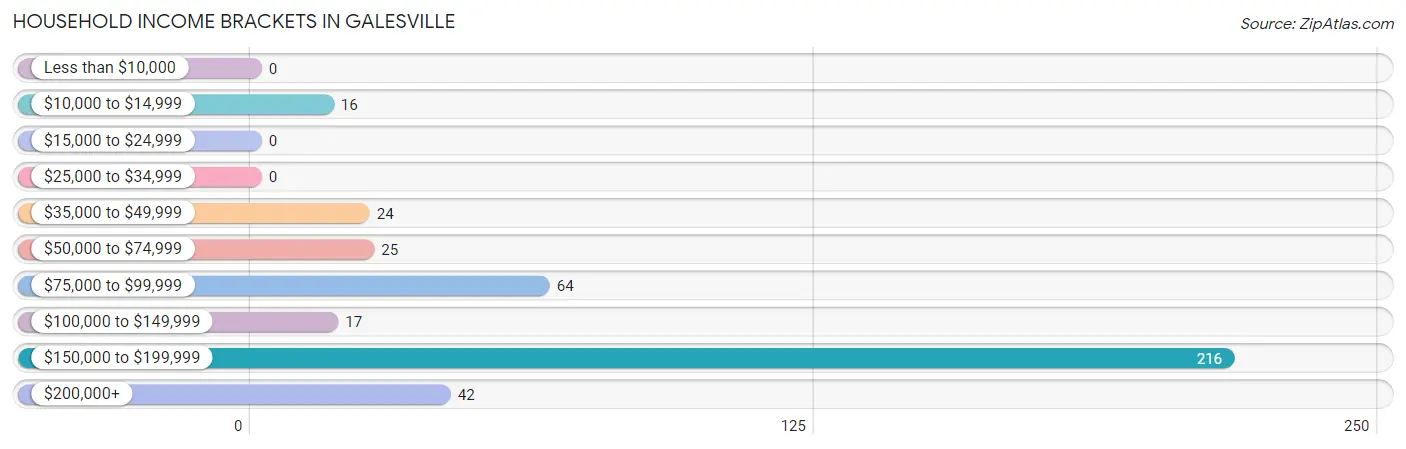
| Income Bracket | # Households | % Households |
| Less than $10,000 | 0 | 0.0% |
| $10,000 to $14,999 | 16 | 4.0% |
| $15,000 to $24,999 | 0 | 0.0% |
| $25,000 to $34,999 | 0 | 0.0% |
| $35,000 to $49,999 | 24 | 5.9% |
| $50,000 to $74,999 | 25 | 6.2% |
| $75,000 to $99,999 | 64 | 15.8% |
| $100,000 to $149,999 | 17 | 4.2% |
| $150,000 to $199,999 | 216 | 53.5% |
| $200,000+ | 42 | 10.4% |
Household Income by Householder Age in Galesville
The median household income in Galesville is $188,333, with the highest median household income of $190,120 found in the 45 to 64 years age bracket for the primary householder. A total of 198 households (49.0%) fall into this category.
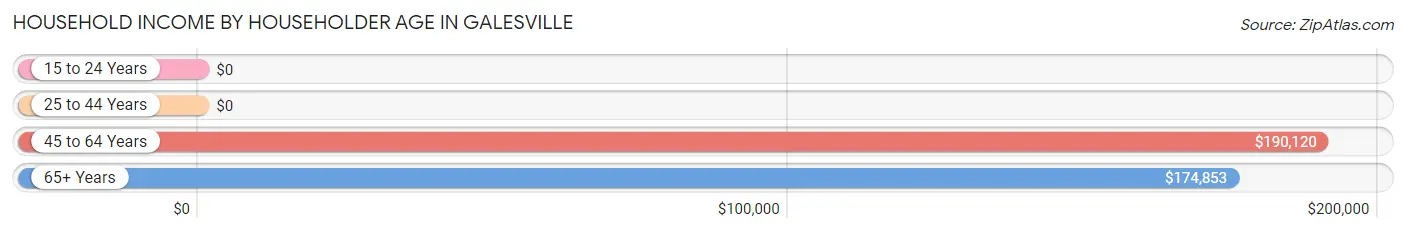
| Income Bracket | # Households | Median Income |
| 15 to 24 Years | 0 (0.0%) | $0 |
| 25 to 44 Years | 14 (3.5%) | $0 |
| 45 to 64 Years | 198 (49.0%) | $190,120 |
| 65+ Years | 192 (47.5%) | $174,853 |
| Total | 404 (100.0%) | $188,333 |
Poverty in Galesville
Income Below Poverty by Sex and Age in Galesville
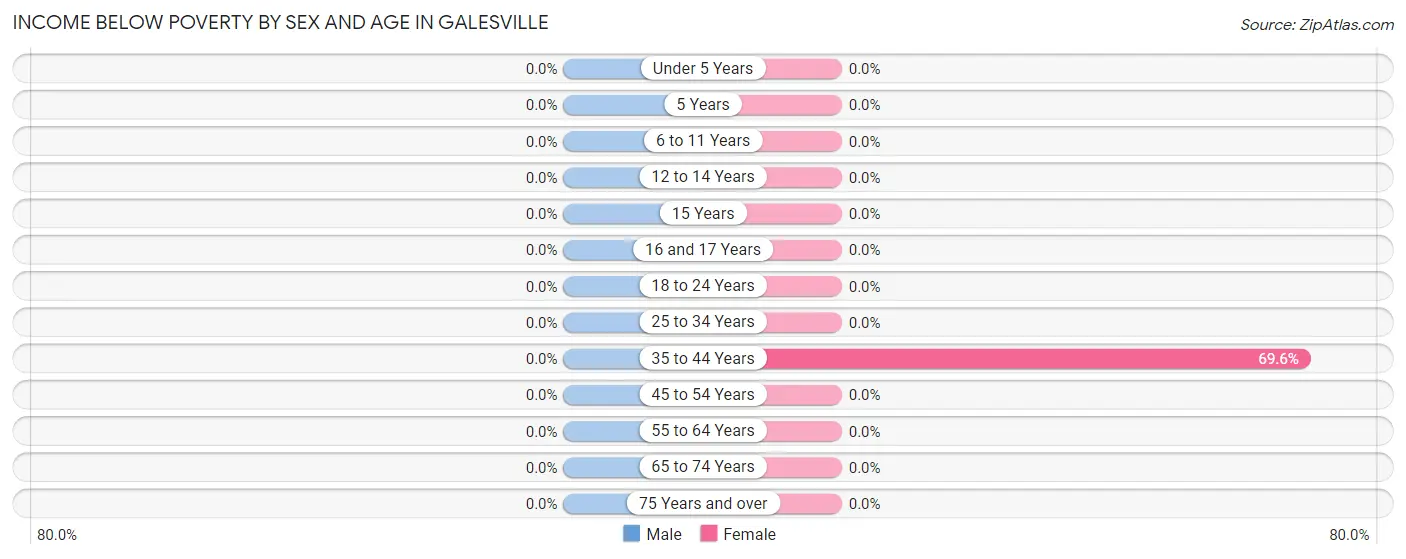
| Age Bracket | Male | Female |
| Under 5 Years | 0 (0.0%) | 0 (0.0%) |
| 5 Years | 0 (0.0%) | 0 (0.0%) |
| 6 to 11 Years | 0 (0.0%) | 0 (0.0%) |
| 12 to 14 Years | 0 (0.0%) | 0 (0.0%) |
| 15 Years | 0 (0.0%) | 0 (0.0%) |
| 16 and 17 Years | 0 (0.0%) | 0 (0.0%) |
| 18 to 24 Years | 0 (0.0%) | 0 (0.0%) |
| 25 to 34 Years | 0 (0.0%) | 0 (0.0%) |
| 35 to 44 Years | 0 (0.0%) | 55 (69.6%) |
| 45 to 54 Years | 0 (0.0%) | 0 (0.0%) |
| 55 to 64 Years | 0 (0.0%) | 0 (0.0%) |
| 65 to 74 Years | 0 (0.0%) | 0 (0.0%) |
| 75 Years and over | 0 (0.0%) | 0 (0.0%) |
| Total | 0 (0.0%) | 55 (8.5%) |
Income Above Poverty by Sex and Age in Galesville
According to the poverty statistics in Galesville, males aged under 5 years and females aged under 5 years are the age groups that are most secure financially, with 100.0% of males and 100.0% of females in these age groups living above the poverty line.
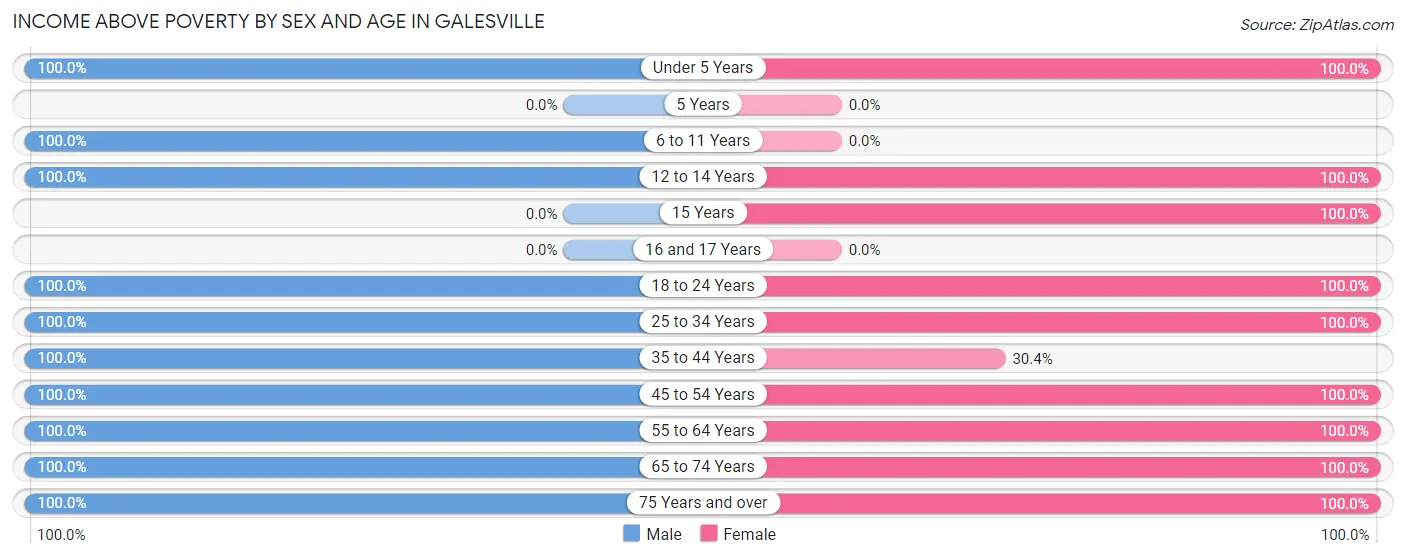
| Age Bracket | Male | Female |
| Under 5 Years | 7 (100.0%) | 12 (100.0%) |
| 5 Years | 0 (0.0%) | 0 (0.0%) |
| 6 to 11 Years | 59 (100.0%) | 0 (0.0%) |
| 12 to 14 Years | 10 (100.0%) | 7 (100.0%) |
| 15 Years | 0 (0.0%) | 7 (100.0%) |
| 16 and 17 Years | 0 (0.0%) | 0 (0.0%) |
| 18 to 24 Years | 5 (100.0%) | 168 (100.0%) |
| 25 to 34 Years | 11 (100.0%) | 18 (100.0%) |
| 35 to 44 Years | 46 (100.0%) | 24 (30.4%) |
| 45 to 54 Years | 181 (100.0%) | 164 (100.0%) |
| 55 to 64 Years | 86 (100.0%) | 37 (100.0%) |
| 65 to 74 Years | 122 (100.0%) | 118 (100.0%) |
| 75 Years and over | 49 (100.0%) | 40 (100.0%) |
| Total | 576 (100.0%) | 595 (91.5%) |
Income Below Poverty Among Married-Couple Families in Galesville
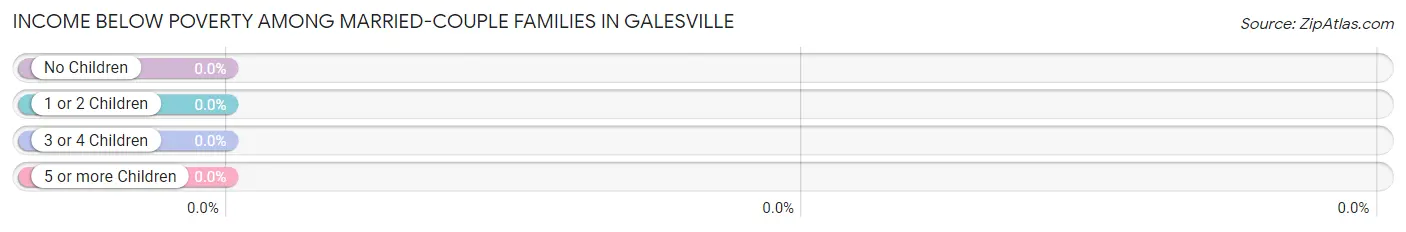
| Children | Above Poverty | Below Poverty |
| No Children | 182 (100.0%) | 0 (0.0%) |
| 1 or 2 Children | 34 (100.0%) | 0 (0.0%) |
| 3 or 4 Children | 6 (100.0%) | 0 (0.0%) |
| 5 or more Children | 0 (0.0%) | 0 (0.0%) |
| Total | 222 (100.0%) | 0 (0.0%) |
Income Below Poverty Among Single-Parent Households in Galesville
| Children | Single Father | Single Mother |
| No Children | 0 (0.0%) | 0 (0.0%) |
| 1 or 2 Children | 0 (0.0%) | 0 (0.0%) |
| 3 or 4 Children | 0 (0.0%) | 0 (0.0%) |
| 5 or more Children | 0 (0.0%) | 0 (0.0%) |
| Total | 0 (0.0%) | 0 (0.0%) |
Income Below Poverty Among Married-Couple vs Single-Parent Households in Galesville
| Children | Married-Couple Families | Single-Parent Households |
| No Children | 0 (0.0%) | 0 (0.0%) |
| 1 or 2 Children | 0 (0.0%) | 0 (0.0%) |
| 3 or 4 Children | 0 (0.0%) | 0 (0.0%) |
| 5 or more Children | 0 (0.0%) | 0 (0.0%) |
| Total | 0 (0.0%) | 0 (0.0%) |
Race in Galesville
The most populous races in Galesville are White / Caucasian (1,020 | 83.2%), Black / African American (196 | 16.0%), and Two or more Races (10 | 0.8%).
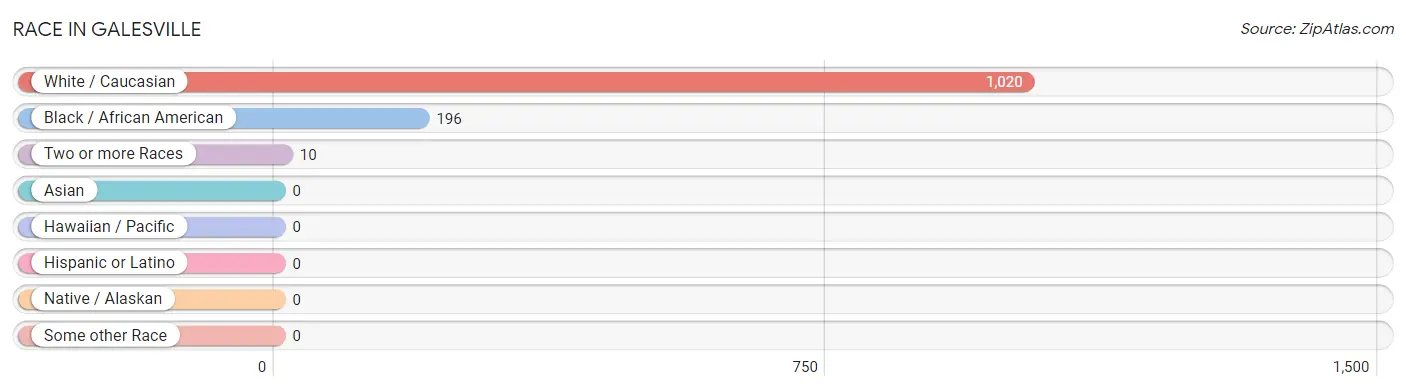
| Race | # Population | % Population |
| Asian | 0 | 0.0% |
| Black / African American | 196 | 16.0% |
| Hawaiian / Pacific | 0 | 0.0% |
| Hispanic or Latino | 0 | 0.0% |
| Native / Alaskan | 0 | 0.0% |
| White / Caucasian | 1,020 | 83.2% |
| Two or more Races | 10 | 0.8% |
| Some other Race | 0 | 0.0% |
| Total | 1,226 | 100.0% |
Ancestry in Galesville
The most populous ancestries reported in Galesville are English (217 | 17.7%), Irish (108 | 8.8%), Scottish (101 | 8.2%), Scandinavian (68 | 5.6%), and German (54 | 4.4%), together accounting for 44.7% of all Galesville residents.
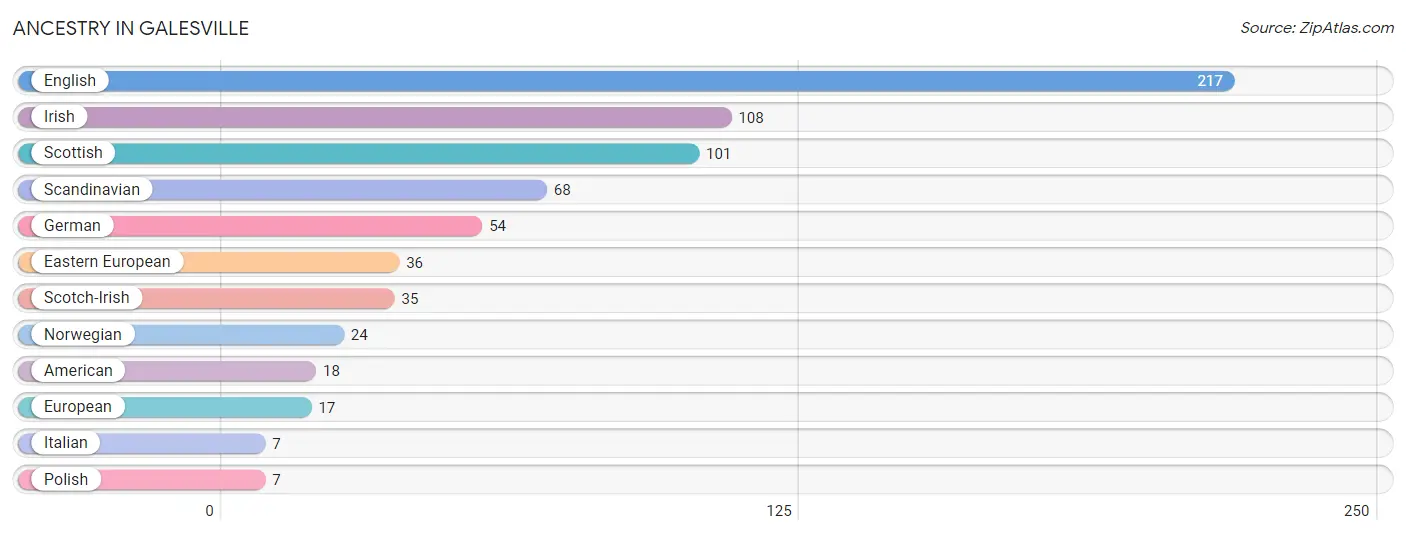
| Ancestry | # Population | % Population |
| American | 18 | 1.5% |
| Eastern European | 36 | 2.9% |
| English | 217 | 17.7% |
| European | 17 | 1.4% |
| German | 54 | 4.4% |
| Irish | 108 | 8.8% |
| Italian | 7 | 0.6% |
| Norwegian | 24 | 2.0% |
| Polish | 7 | 0.6% |
| Scandinavian | 68 | 5.6% |
| Scotch-Irish | 35 | 2.9% |
| Scottish | 101 | 8.2% | View All 12 Rows |
Immigrants in Galesville

| Immigration Origin | # Population | % Population | View All 0 Rows |
Sex and Age in Galesville
Sex and Age in Galesville
The most populous age groups in Galesville are 50 to 54 Years (172 | 29.9%) for men and 15 to 19 Years (175 | 26.9%) for women.
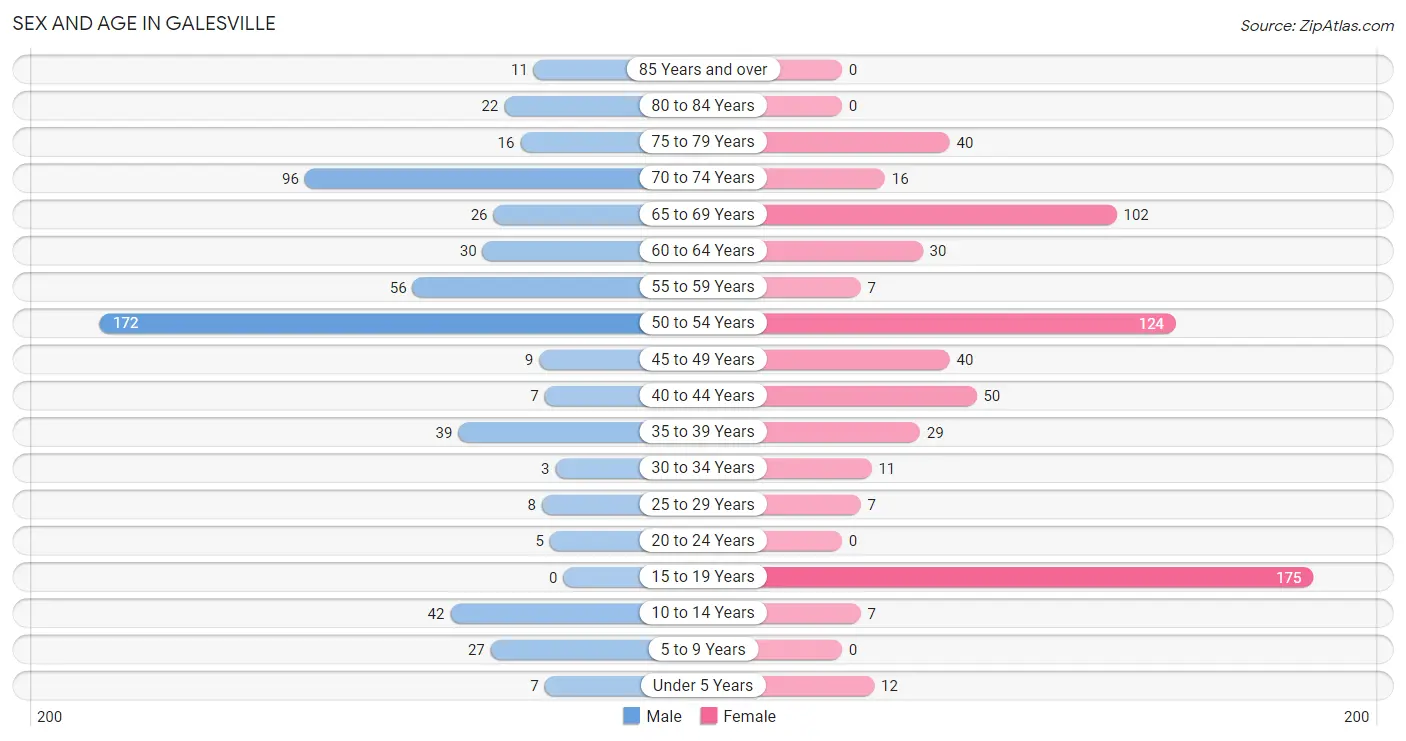
| Age Bracket | Male | Female |
| Under 5 Years | 7 (1.2%) | 12 (1.8%) |
| 5 to 9 Years | 27 (4.7%) | 0 (0.0%) |
| 10 to 14 Years | 42 (7.3%) | 7 (1.1%) |
| 15 to 19 Years | 0 (0.0%) | 175 (26.9%) |
| 20 to 24 Years | 5 (0.9%) | 0 (0.0%) |
| 25 to 29 Years | 8 (1.4%) | 7 (1.1%) |
| 30 to 34 Years | 3 (0.5%) | 11 (1.7%) |
| 35 to 39 Years | 39 (6.8%) | 29 (4.5%) |
| 40 to 44 Years | 7 (1.2%) | 50 (7.7%) |
| 45 to 49 Years | 9 (1.6%) | 40 (6.1%) |
| 50 to 54 Years | 172 (29.9%) | 124 (19.1%) |
| 55 to 59 Years | 56 (9.7%) | 7 (1.1%) |
| 60 to 64 Years | 30 (5.2%) | 30 (4.6%) |
| 65 to 69 Years | 26 (4.5%) | 102 (15.7%) |
| 70 to 74 Years | 96 (16.7%) | 16 (2.5%) |
| 75 to 79 Years | 16 (2.8%) | 40 (6.1%) |
| 80 to 84 Years | 22 (3.8%) | 0 (0.0%) |
| 85 Years and over | 11 (1.9%) | 0 (0.0%) |
| Total | 576 (100.0%) | 650 (100.0%) |
Families and Households in Galesville
Median Family Size in Galesville
The median family size in Galesville is 3.23 persons per family, with married-couple families (222 | 69.6%) accounting for the largest median family size of 3.43 persons per family. On the other hand, single female/mother families (63 | 19.8%) represent the smallest median family size with 2.75 persons per family.
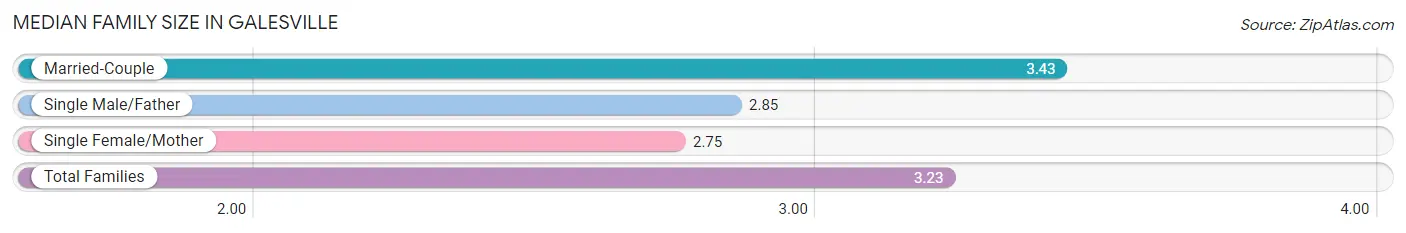
| Family Type | # Families | Family Size |
| Married-Couple | 222 (69.6%) | 3.43 |
| Single Male/Father | 34 (10.7%) | 2.85 |
| Single Female/Mother | 63 (19.8%) | 2.75 |
| Total Families | 319 (100.0%) | 3.23 |
Median Household Size in Galesville
The median household size in Galesville is 3.03 persons per household, with single male/father households (34 | 8.4%) accounting for the largest median household size of 3.62 persons per household. non-family households (85 | 21.0%) represent the smallest median household size with 1.65 persons per household.
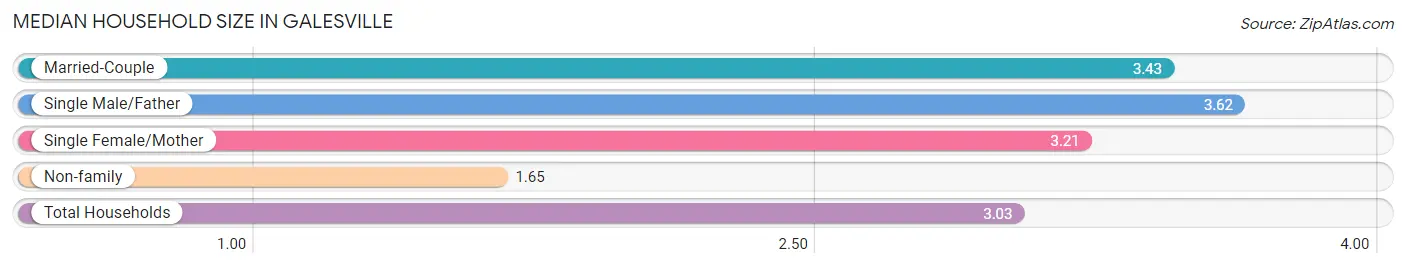
| Household Type | # Households | Household Size |
| Married-Couple | 222 (54.9%) | 3.43 |
| Single Male/Father | 34 (8.4%) | 3.62 |
| Single Female/Mother | 63 (15.6%) | 3.21 |
| Non-family | 85 (21.0%) | 1.65 |
| Total Households | 404 (100.0%) | 3.03 |
Household Size by Marriage Status in Galesville
Out of a total of 404 households in Galesville, 319 (79.0%) are family households, while 85 (21.0%) are nonfamily households. The most numerous type of family households are 4-person households, comprising 189, and the most common type of nonfamily households are 1-person households, comprising 42.
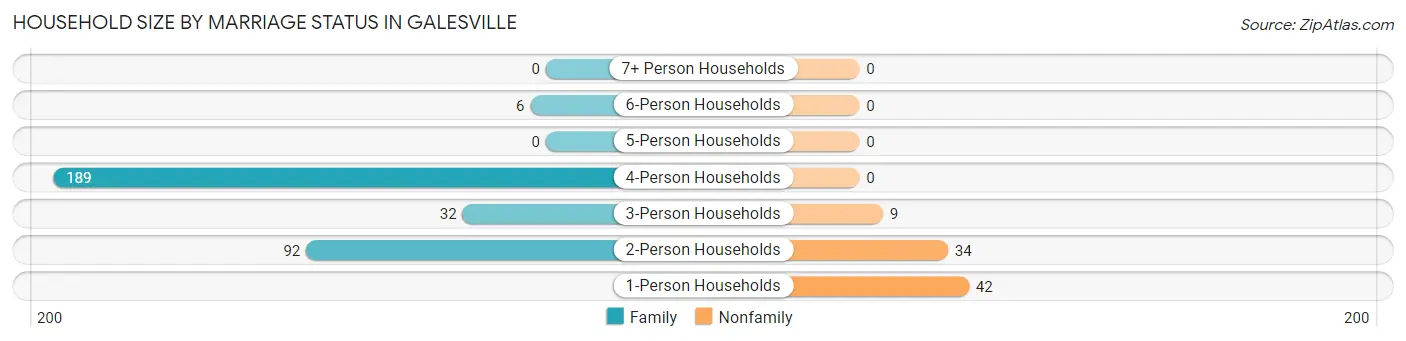
| Household Size | Family Households | Nonfamily Households |
| 1-Person Households | - | 42 (10.4%) |
| 2-Person Households | 92 (22.8%) | 34 (8.4%) |
| 3-Person Households | 32 (7.9%) | 9 (2.2%) |
| 4-Person Households | 189 (46.8%) | 0 (0.0%) |
| 5-Person Households | 0 (0.0%) | 0 (0.0%) |
| 6-Person Households | 6 (1.5%) | 0 (0.0%) |
| 7+ Person Households | 0 (0.0%) | 0 (0.0%) |
| Total | 319 (79.0%) | 85 (21.0%) |
Female Fertility in Galesville
Fertility by Age in Galesville
| Age Bracket | Women with Births | Births / 1,000 Women |
| 15 to 19 years | 0 (0.0%) | 0.0 |
| 20 to 34 years | 0 (0.0%) | 0.0 |
| 35 to 50 years | 0 (0.0%) | 0.0 |
| Total | 0 (0.0%) | 0.0 |
Fertility by Age by Marriage Status in Galesville
| Age Bracket | Married | Unmarried |
| 15 to 19 years | 0 (0.0%) | 0 (0.0%) |
| 20 to 34 years | 0 (0.0%) | 0 (0.0%) |
| 35 to 50 years | 0 (0.0%) | 0 (0.0%) |
| Total | 0 (0.0%) | 0 (0.0%) |
Fertility by Education in Galesville
| Educational Attainment | Women with Births | Births / 1,000 Women |
| Less than High School | 0 (0.0%) | 0.0 |
| High School Diploma | 0 (0.0%) | 0.0 |
| College or Associate's Degree | 0 (0.0%) | 0.0 |
| Bachelor's Degree | 0 (0.0%) | 0.0 |
| Graduate Degree | 0 (0.0%) | 0.0 |
| Total | 0 (0.0%) | 0.0 |
Fertility by Education by Marriage Status in Galesville
| Educational Attainment | Married | Unmarried |
| Less than High School | 0 (0.0%) | 0 (0.0%) |
| High School Diploma | 0 (0.0%) | 0 (0.0%) |
| College or Associate's Degree | 0 (0.0%) | 0 (0.0%) |
| Bachelor's Degree | 0 (0.0%) | 0 (0.0%) |
| Graduate Degree | 0 (0.0%) | 0 (0.0%) |
| Total | 0 (0.0%) | 0 (0.0%) |
Employment Characteristics in Galesville
Employment by Class of Employer in Galesville
Among the 561 employed individuals in Galesville, private company employees (368 | 65.6%), self-employed (incorporated) (111 | 19.8%), and local government employees (37 | 6.6%) make up the most common classes of employment.
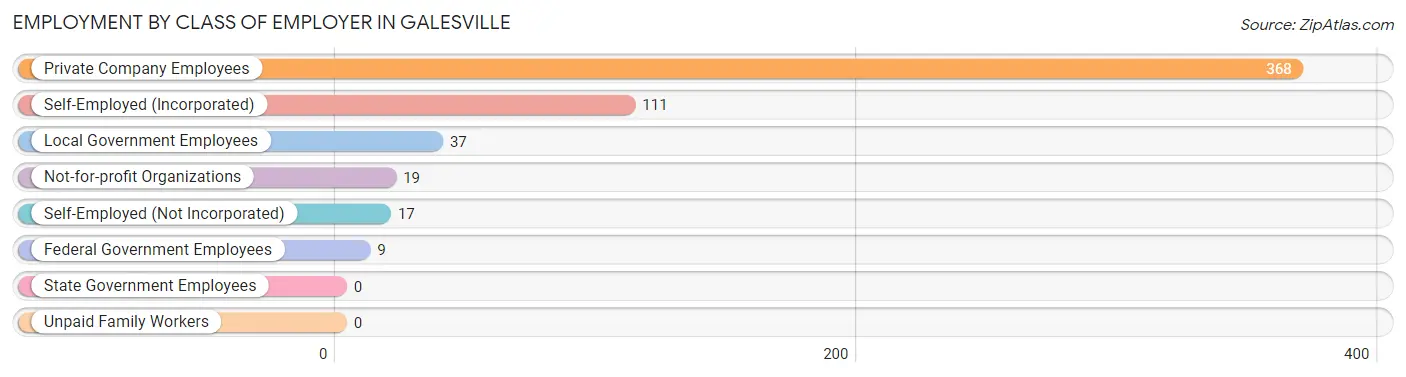
| Employer Class | # Employees | % Employees |
| Private Company Employees | 368 | 65.6% |
| Self-Employed (Incorporated) | 111 | 19.8% |
| Self-Employed (Not Incorporated) | 17 | 3.0% |
| Not-for-profit Organizations | 19 | 3.4% |
| Local Government Employees | 37 | 6.6% |
| State Government Employees | 0 | 0.0% |
| Federal Government Employees | 9 | 1.6% |
| Unpaid Family Workers | 0 | 0.0% |
| Total | 561 | 100.0% |
Employment Status by Age in Galesville
According to the labor force statistics for Galesville, out of the total population over 16 years of age (1,124), 51.3% or 577 individuals are in the labor force, with 2.8% or 16 of them unemployed. The age group with the highest labor force participation rate is 20 to 24 years, with 100.0% or 5 individuals in the labor force. Within the labor force, the 75 years and over age range has the highest percentage of unemployed individuals, with 72.7% or 16 of them being unemployed.
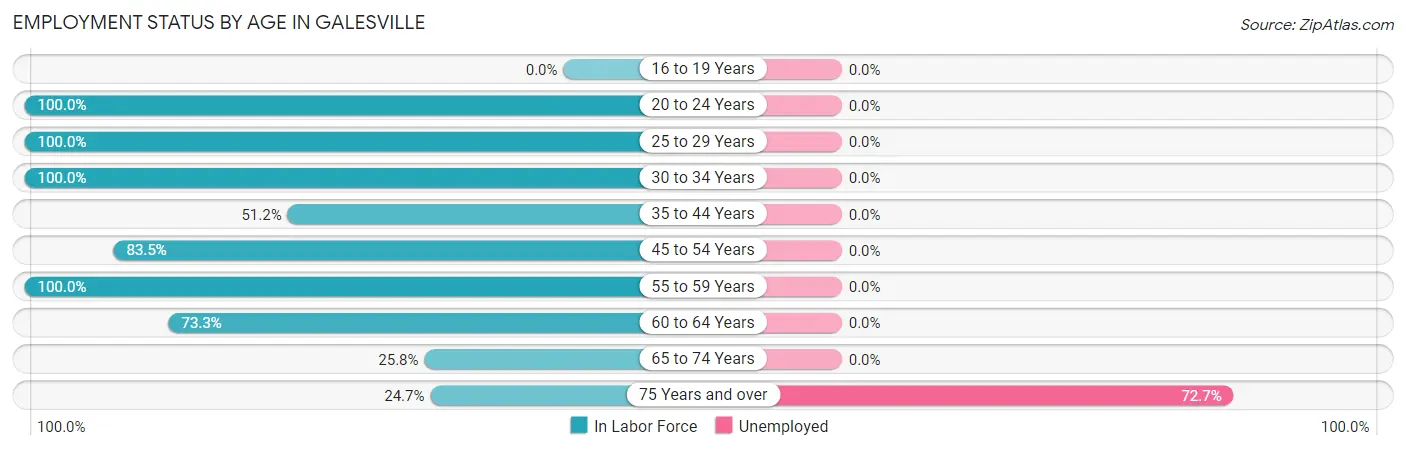
| Age Bracket | In Labor Force | Unemployed |
| 16 to 19 Years | 0 (0.0%) | 0 (0.0%) |
| 20 to 24 Years | 5 (100.0%) | 0 (0.0%) |
| 25 to 29 Years | 15 (100.0%) | 0 (0.0%) |
| 30 to 34 Years | 14 (100.0%) | 0 (0.0%) |
| 35 to 44 Years | 64 (51.2%) | 0 (0.0%) |
| 45 to 54 Years | 288 (83.5%) | 0 (0.0%) |
| 55 to 59 Years | 63 (100.0%) | 0 (0.0%) |
| 60 to 64 Years | 44 (73.3%) | 0 (0.0%) |
| 65 to 74 Years | 62 (25.8%) | 0 (0.0%) |
| 75 Years and over | 22 (24.7%) | 16 (72.7%) |
| Total | 577 (51.3%) | 16 (2.8%) |
Employment Status by Educational Attainment in Galesville
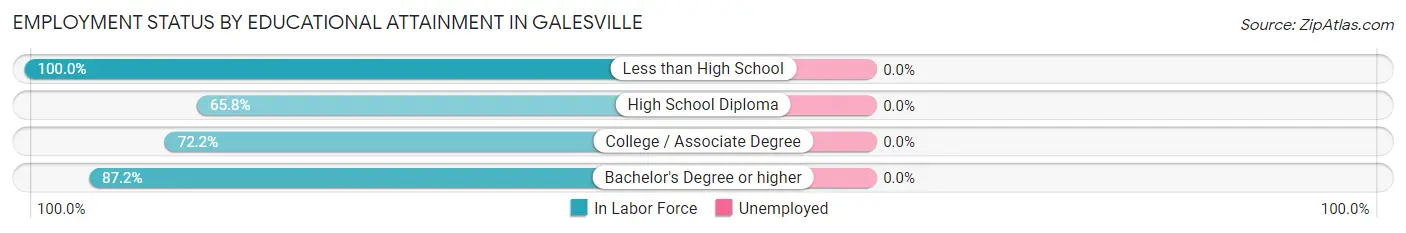
| Educational Attainment | In Labor Force | Unemployed |
| Less than High School | 37 (100.0%) | 0 (0.0%) |
| High School Diploma | 129 (65.8%) | 0 (0.0%) |
| College / Associate Degree | 83 (72.2%) | 0 (0.0%) |
| Bachelor's Degree or higher | 239 (87.2%) | 0 (0.0%) |
| Total | 488 (78.5%) | 0 (0.0%) |
Employment Occupations by Sex in Galesville
Management, Business, Science and Arts Occupations
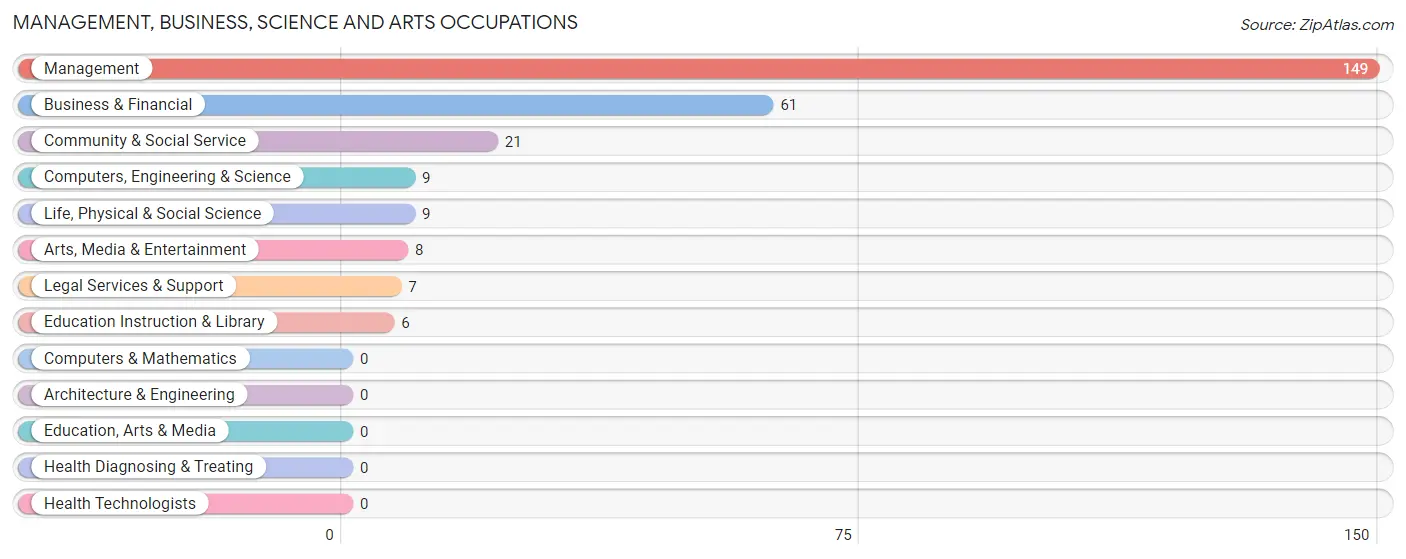
The most common Management, Business, Science and Arts occupations in Galesville are Management (149 | 26.8%), Business & Financial (61 | 11.0%), Community & Social Service (21 | 3.8%), Computers, Engineering & Science (9 | 1.6%), and Life, Physical & Social Science (9 | 1.6%).
Management, Business, Science and Arts Occupations by Sex
Within the Management, Business, Science and Arts occupations in Galesville, the most male-oriented occupations are Business & Financial (100.0%), Computers, Engineering & Science (100.0%), and Life, Physical & Social Science (100.0%), while the most female-oriented occupations are Education Instruction & Library (100.0%), Arts, Media & Entertainment (100.0%), and Community & Social Service (66.7%).
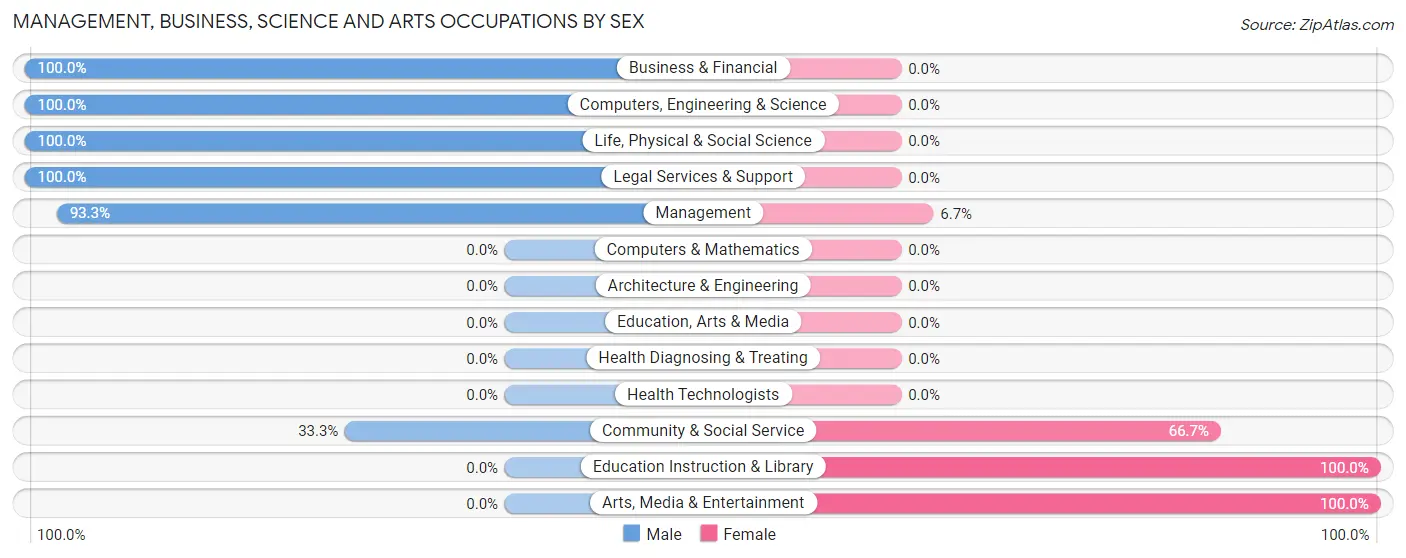
| Occupation | Male | Female |
| Management | 139 (93.3%) | 10 (6.7%) |
| Business & Financial | 61 (100.0%) | 0 (0.0%) |
| Computers, Engineering & Science | 9 (100.0%) | 0 (0.0%) |
| Computers & Mathematics | 0 (0.0%) | 0 (0.0%) |
| Architecture & Engineering | 0 (0.0%) | 0 (0.0%) |
| Life, Physical & Social Science | 9 (100.0%) | 0 (0.0%) |
| Community & Social Service | 7 (33.3%) | 14 (66.7%) |
| Education, Arts & Media | 0 (0.0%) | 0 (0.0%) |
| Legal Services & Support | 7 (100.0%) | 0 (0.0%) |
| Education Instruction & Library | 0 (0.0%) | 6 (100.0%) |
| Arts, Media & Entertainment | 0 (0.0%) | 8 (100.0%) |
| Health Diagnosing & Treating | 0 (0.0%) | 0 (0.0%) |
| Health Technologists | 0 (0.0%) | 0 (0.0%) |
| Total (Category) | 216 (90.0%) | 24 (10.0%) |
| Total (Overall) | 375 (67.4%) | 181 (32.6%) |
Services Occupations
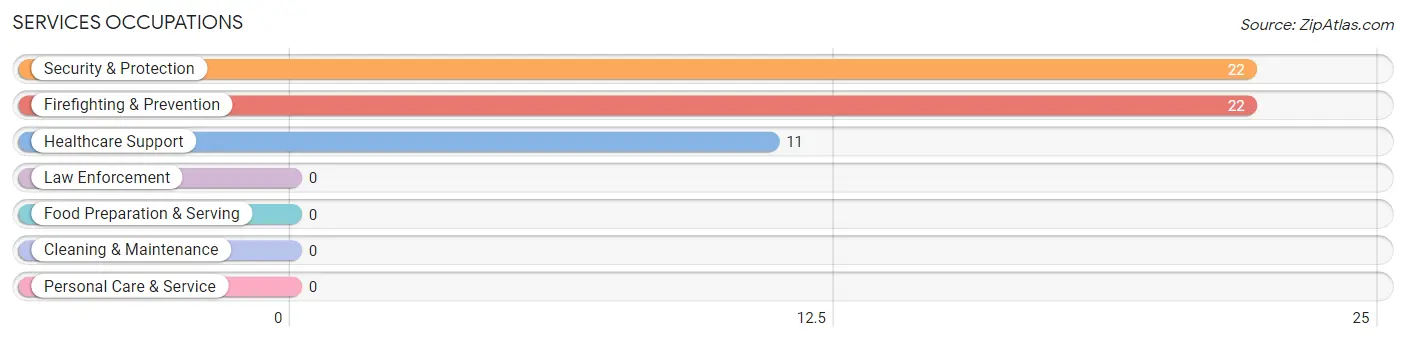
The most common Services occupations in Galesville are Security & Protection (22 | 4.0%), Firefighting & Prevention (22 | 4.0%), and Healthcare Support (11 | 2.0%).
Services Occupations by Sex
Within the Services occupations in Galesville, the most male-oriented occupations are Security & Protection (68.2%), and Firefighting & Prevention (68.2%), while the most female-oriented occupations are Healthcare Support (100.0%), Security & Protection (31.8%), and Firefighting & Prevention (31.8%).
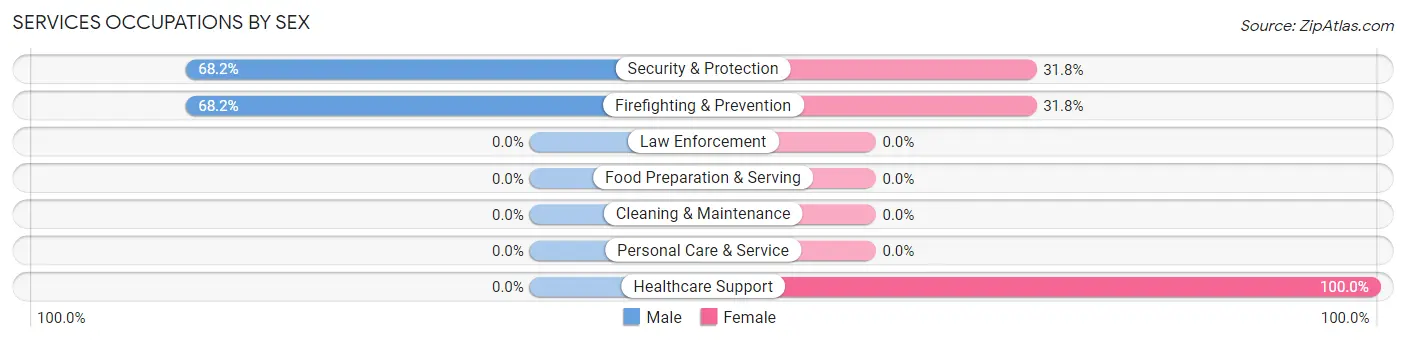
| Occupation | Male | Female |
| Healthcare Support | 0 (0.0%) | 11 (100.0%) |
| Security & Protection | 15 (68.2%) | 7 (31.8%) |
| Firefighting & Prevention | 15 (68.2%) | 7 (31.8%) |
| Law Enforcement | 0 (0.0%) | 0 (0.0%) |
| Food Preparation & Serving | 0 (0.0%) | 0 (0.0%) |
| Cleaning & Maintenance | 0 (0.0%) | 0 (0.0%) |
| Personal Care & Service | 0 (0.0%) | 0 (0.0%) |
| Total (Category) | 15 (45.5%) | 18 (54.5%) |
| Total (Overall) | 375 (67.4%) | 181 (32.6%) |
Sales and Office Occupations
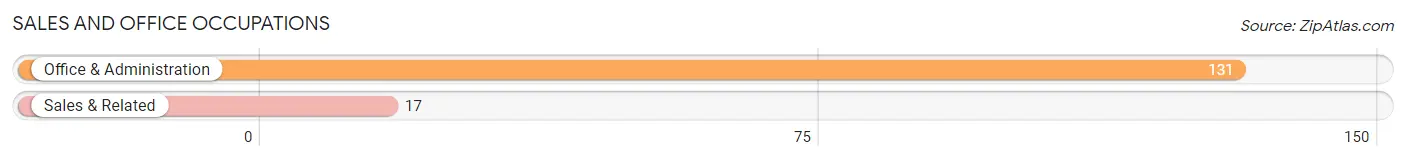
The most common Sales and Office occupations in Galesville are Office & Administration (131 | 23.6%), and Sales & Related (17 | 3.1%).
Sales and Office Occupations by Sex

| Occupation | Male | Female |
| Sales & Related | 9 (52.9%) | 8 (47.1%) |
| Office & Administration | 0 (0.0%) | 131 (100.0%) |
| Total (Category) | 9 (6.1%) | 139 (93.9%) |
| Total (Overall) | 375 (67.4%) | 181 (32.6%) |
Natural Resources, Construction and Maintenance Occupations
The most common Natural Resources, Construction and Maintenance occupations in Galesville are Installation, Maintenance & Repair (91 | 16.4%), and Construction & Extraction (41 | 7.4%).

Natural Resources, Construction and Maintenance Occupations by Sex

| Occupation | Male | Female |
| Farming, Fishing & Forestry | 0 (0.0%) | 0 (0.0%) |
| Construction & Extraction | 41 (100.0%) | 0 (0.0%) |
| Installation, Maintenance & Repair | 91 (100.0%) | 0 (0.0%) |
| Total (Category) | 132 (100.0%) | 0 (0.0%) |
| Total (Overall) | 375 (67.4%) | 181 (32.6%) |
Production, Transportation and Moving Occupations
The most common Production, Transportation and Moving occupations in Galesville are , and Material Moving (3 | 0.5%).
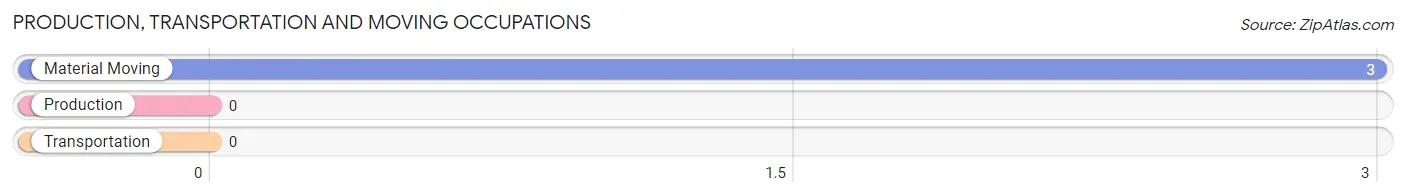
Production, Transportation and Moving Occupations by Sex
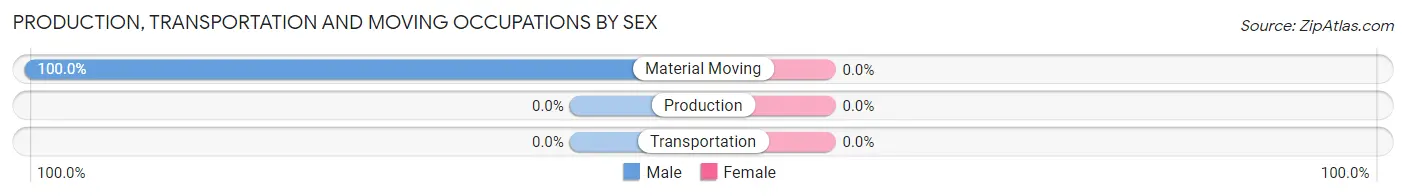
| Occupation | Male | Female |
| Production | 0 (0.0%) | 0 (0.0%) |
| Transportation | 0 (0.0%) | 0 (0.0%) |
| Material Moving | 3 (100.0%) | 0 (0.0%) |
| Total (Category) | 3 (100.0%) | 0 (0.0%) |
| Total (Overall) | 375 (67.4%) | 181 (32.6%) |
Employment Industries by Sex in Galesville
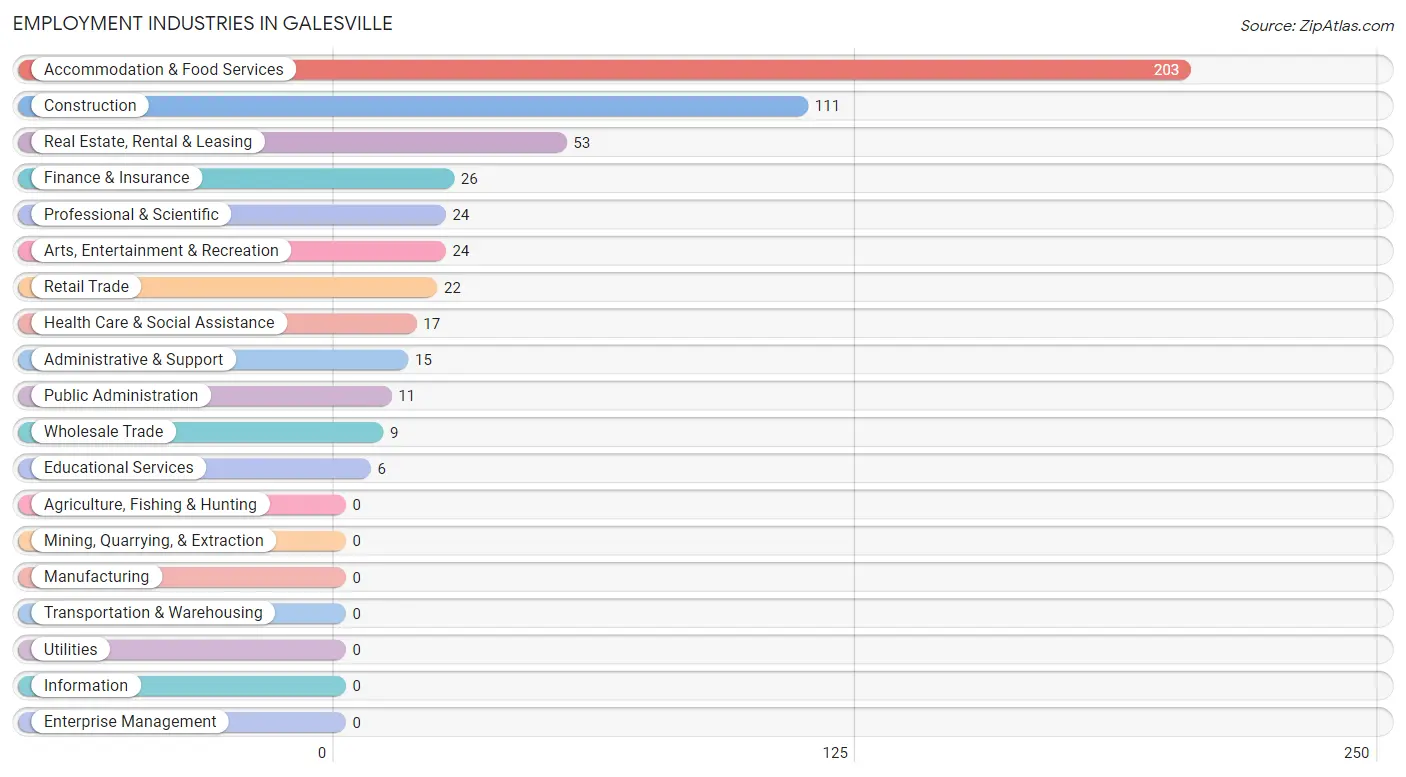
Employment Industries in Galesville
The major employment industries in Galesville include Accommodation & Food Services (203 | 36.5%), Construction (111 | 20.0%), Real Estate, Rental & Leasing (53 | 9.5%), Finance & Insurance (26 | 4.7%), and Professional & Scientific (24 | 4.3%).
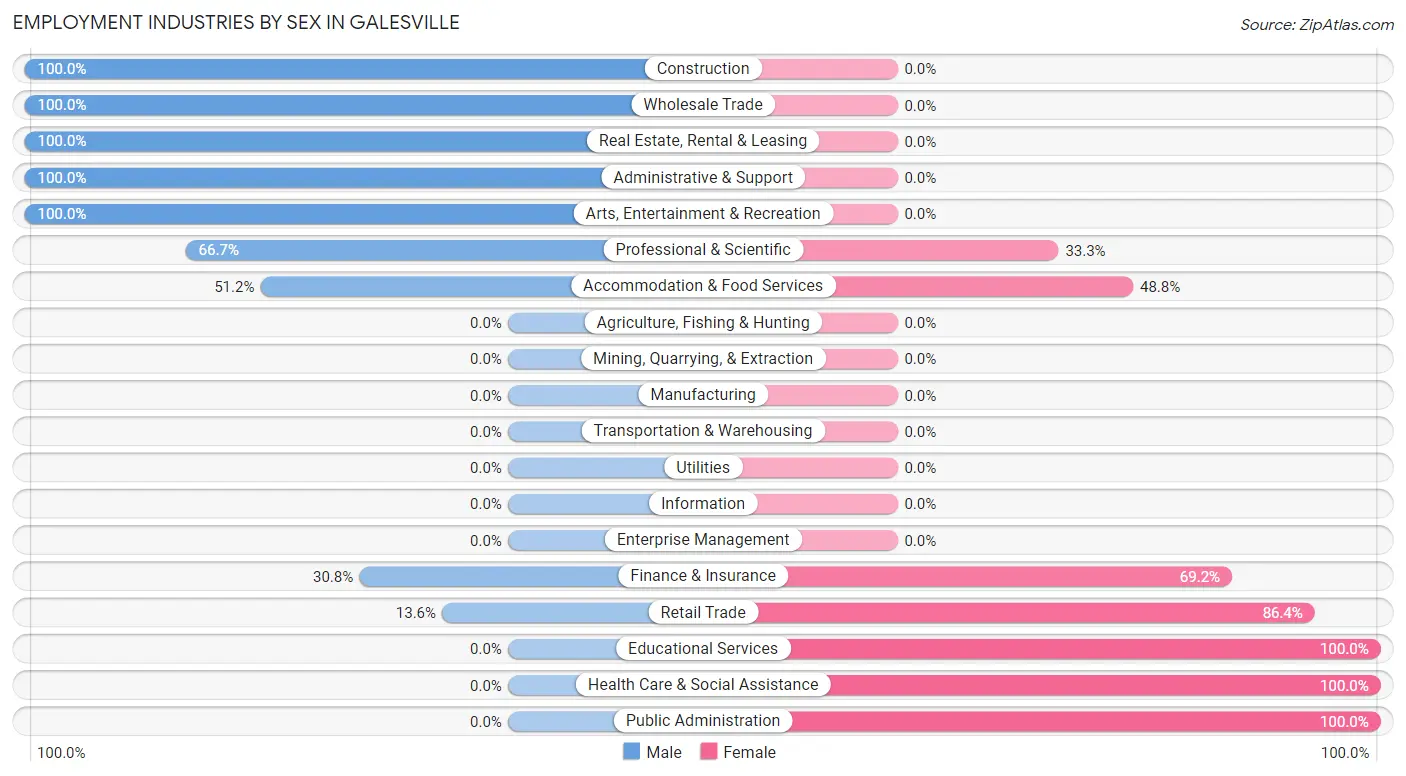
Employment Industries by Sex in Galesville
The Galesville industries that see more men than women are Construction (100.0%), Wholesale Trade (100.0%), and Real Estate, Rental & Leasing (100.0%), whereas the industries that tend to have a higher number of women are Educational Services (100.0%), Health Care & Social Assistance (100.0%), and Public Administration (100.0%).
| Industry | Male | Female |
| Agriculture, Fishing & Hunting | 0 (0.0%) | 0 (0.0%) |
| Mining, Quarrying, & Extraction | 0 (0.0%) | 0 (0.0%) |
| Construction | 111 (100.0%) | 0 (0.0%) |
| Manufacturing | 0 (0.0%) | 0 (0.0%) |
| Wholesale Trade | 9 (100.0%) | 0 (0.0%) |
| Retail Trade | 3 (13.6%) | 19 (86.4%) |
| Transportation & Warehousing | 0 (0.0%) | 0 (0.0%) |
| Utilities | 0 (0.0%) | 0 (0.0%) |
| Information | 0 (0.0%) | 0 (0.0%) |
| Finance & Insurance | 8 (30.8%) | 18 (69.2%) |
| Real Estate, Rental & Leasing | 53 (100.0%) | 0 (0.0%) |
| Professional & Scientific | 16 (66.7%) | 8 (33.3%) |
| Enterprise Management | 0 (0.0%) | 0 (0.0%) |
| Administrative & Support | 15 (100.0%) | 0 (0.0%) |
| Educational Services | 0 (0.0%) | 6 (100.0%) |
| Health Care & Social Assistance | 0 (0.0%) | 17 (100.0%) |
| Arts, Entertainment & Recreation | 24 (100.0%) | 0 (0.0%) |
| Accommodation & Food Services | 104 (51.2%) | 99 (48.8%) |
| Public Administration | 0 (0.0%) | 11 (100.0%) |
| Total | 375 (67.4%) | 181 (32.6%) |
Education in Galesville
School Enrollment in Galesville
The most common levels of schooling among the 302 students in Galesville are college / undergraduate (168 | 55.6%), middle school (49 | 16.2%), and graduate / professional (45 | 14.9%).
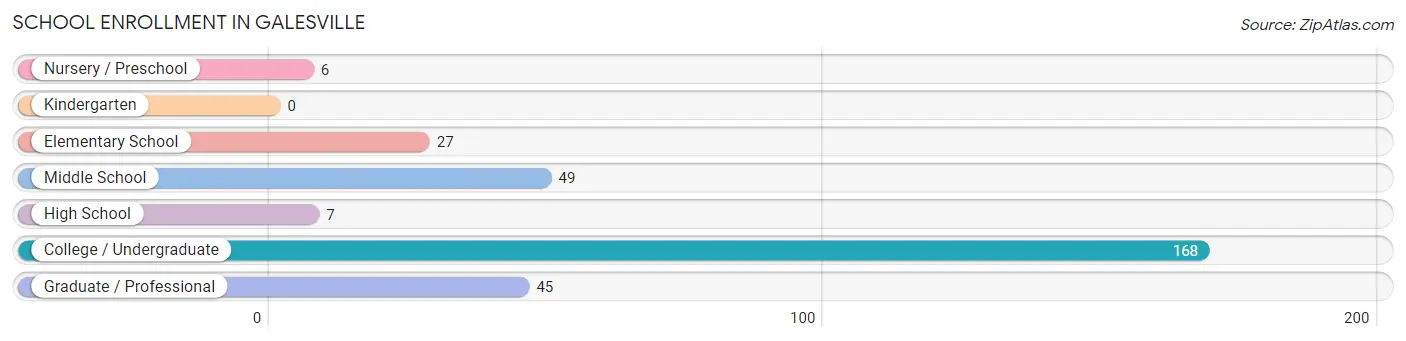
| School Level | # Students | % Students |
| Nursery / Preschool | 6 | 2.0% |
| Kindergarten | 0 | 0.0% |
| Elementary School | 27 | 8.9% |
| Middle School | 49 | 16.2% |
| High School | 7 | 2.3% |
| College / Undergraduate | 168 | 55.6% |
| Graduate / Professional | 45 | 14.9% |
| Total | 302 | 100.0% |
School Enrollment by Age by Funding Source in Galesville
Out of a total of 302 students who are enrolled in schools in Galesville, 129 (42.7%) attend a private institution, while the remaining 173 (57.3%) are enrolled in public schools. The age group of 35 years and over has the highest likelihood of being enrolled in private schools, with 29 (64.4% in the age bracket) enrolled. Conversely, the age group of 3 to 4 year olds has the lowest likelihood of being enrolled in a private school, with 6 (100.0% in the age bracket) attending a public institution.
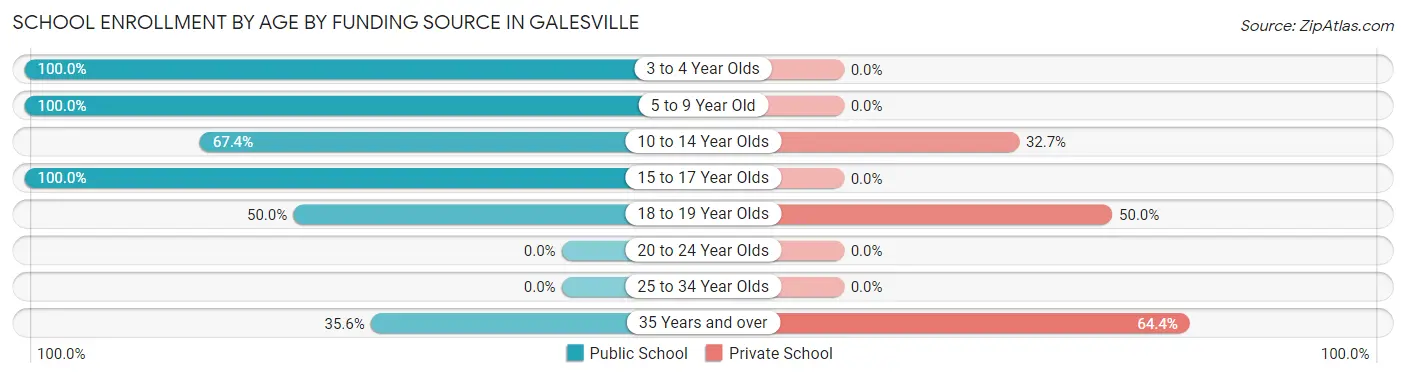
| Age Bracket | Public School | Private School |
| 3 to 4 Year Olds | 6 (100.0%) | 0 (0.0%) |
| 5 to 9 Year Old | 27 (100.0%) | 0 (0.0%) |
| 10 to 14 Year Olds | 33 (67.3%) | 16 (32.7%) |
| 15 to 17 Year Olds | 7 (100.0%) | 0 (0.0%) |
| 18 to 19 Year Olds | 84 (50.0%) | 84 (50.0%) |
| 20 to 24 Year Olds | 0 (0.0%) | 0 (0.0%) |
| 25 to 34 Year Olds | 0 (0.0%) | 0 (0.0%) |
| 35 Years and over | 16 (35.6%) | 29 (64.4%) |
| Total | 173 (57.3%) | 129 (42.7%) |
Educational Attainment by Field of Study in Galesville
Business (141 | 32.1%), arts & humanities (120 | 27.3%), science & technology (63 | 14.3%), literature & languages (37 | 8.4%), and bio, nature & agricultural (16 | 3.6%) are the most common fields of study among 440 individuals in Galesville who have obtained a bachelor's degree or higher.
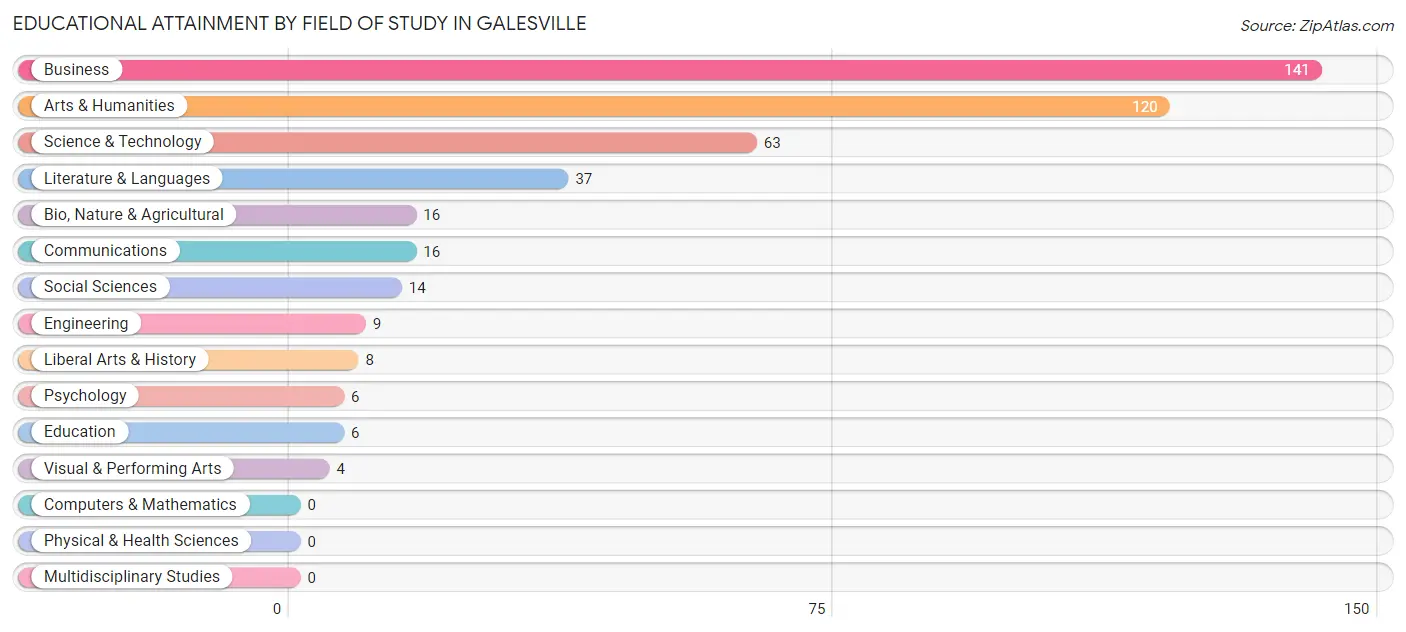
| Field of Study | # Graduates | % Graduates |
| Computers & Mathematics | 0 | 0.0% |
| Bio, Nature & Agricultural | 16 | 3.6% |
| Physical & Health Sciences | 0 | 0.0% |
| Psychology | 6 | 1.4% |
| Social Sciences | 14 | 3.2% |
| Engineering | 9 | 2.1% |
| Multidisciplinary Studies | 0 | 0.0% |
| Science & Technology | 63 | 14.3% |
| Business | 141 | 32.1% |
| Education | 6 | 1.4% |
| Literature & Languages | 37 | 8.4% |
| Liberal Arts & History | 8 | 1.8% |
| Visual & Performing Arts | 4 | 0.9% |
| Communications | 16 | 3.6% |
| Arts & Humanities | 120 | 27.3% |
| Total | 440 | 100.0% |
Transportation & Commute in Galesville
Vehicle Availability by Sex in Galesville
The most prevalent vehicle ownership categories in Galesville are males with 4 vehicles (183, accounting for 48.2%) and females with 4 vehicles (99, making up 101.1%).
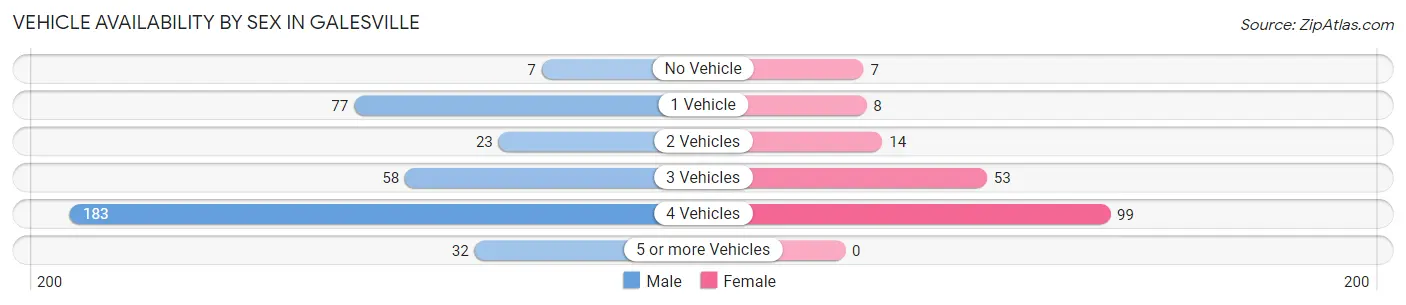
| Vehicles Available | Male | Female |
| No Vehicle | 7 (1.8%) | 7 (3.9%) |
| 1 Vehicle | 77 (20.3%) | 8 (4.4%) |
| 2 Vehicles | 23 (6.0%) | 14 (7.7%) |
| 3 Vehicles | 58 (15.3%) | 53 (29.3%) |
| 4 Vehicles | 183 (48.2%) | 99 (54.7%) |
| 5 or more Vehicles | 32 (8.4%) | 0 (0.0%) |
| Total | 380 (100.0%) | 181 (100.0%) |
Commute Time in Galesville
The most frequently occuring commute durations in Galesville are 60 to 89 minutes (89 commuters, 27.8%), 35 to 39 minutes (58 commuters, 18.1%), and 30 to 34 minutes (46 commuters, 14.4%).
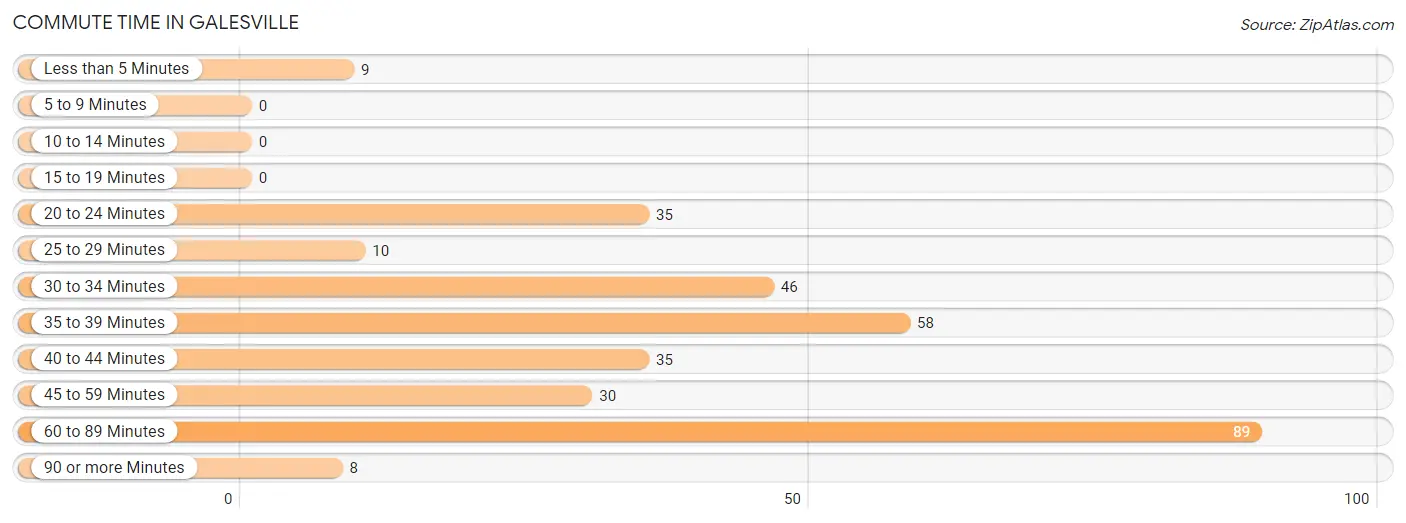
| Commute Time | # Commuters | % Commuters |
| Less than 5 Minutes | 9 | 2.8% |
| 5 to 9 Minutes | 0 | 0.0% |
| 10 to 14 Minutes | 0 | 0.0% |
| 15 to 19 Minutes | 0 | 0.0% |
| 20 to 24 Minutes | 35 | 10.9% |
| 25 to 29 Minutes | 10 | 3.1% |
| 30 to 34 Minutes | 46 | 14.4% |
| 35 to 39 Minutes | 58 | 18.1% |
| 40 to 44 Minutes | 35 | 10.9% |
| 45 to 59 Minutes | 30 | 9.4% |
| 60 to 89 Minutes | 89 | 27.8% |
| 90 or more Minutes | 8 | 2.5% |
Commute Time by Sex in Galesville
The most common commute times in Galesville are 60 to 89 minutes (78 commuters, 30.8%) for males and 35 to 39 minutes (26 commuters, 38.8%) for females.
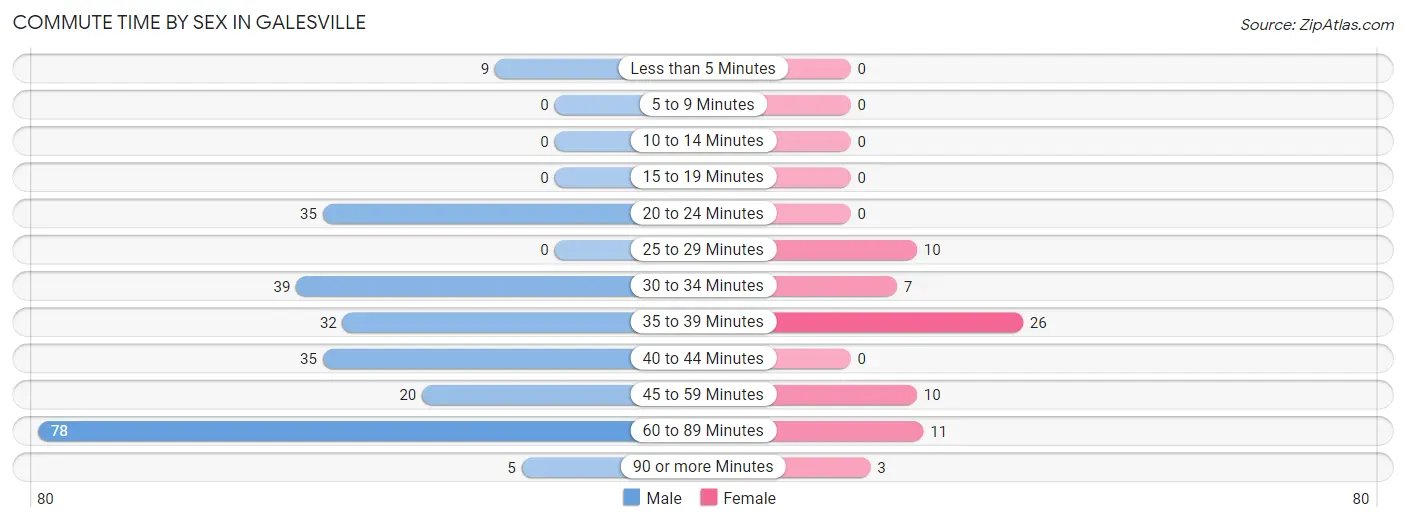
| Commute Time | Male | Female |
| Less than 5 Minutes | 9 (3.6%) | 0 (0.0%) |
| 5 to 9 Minutes | 0 (0.0%) | 0 (0.0%) |
| 10 to 14 Minutes | 0 (0.0%) | 0 (0.0%) |
| 15 to 19 Minutes | 0 (0.0%) | 0 (0.0%) |
| 20 to 24 Minutes | 35 (13.8%) | 0 (0.0%) |
| 25 to 29 Minutes | 0 (0.0%) | 10 (14.9%) |
| 30 to 34 Minutes | 39 (15.4%) | 7 (10.4%) |
| 35 to 39 Minutes | 32 (12.7%) | 26 (38.8%) |
| 40 to 44 Minutes | 35 (13.8%) | 0 (0.0%) |
| 45 to 59 Minutes | 20 (7.9%) | 10 (14.9%) |
| 60 to 89 Minutes | 78 (30.8%) | 11 (16.4%) |
| 90 or more Minutes | 5 (2.0%) | 3 (4.5%) |
Time of Departure to Work by Sex in Galesville
The most frequent times of departure to work in Galesville are 8:00 AM to 8:29 AM (59, 23.3%) for males and 6:00 AM to 6:29 AM (36, 53.7%) for females.
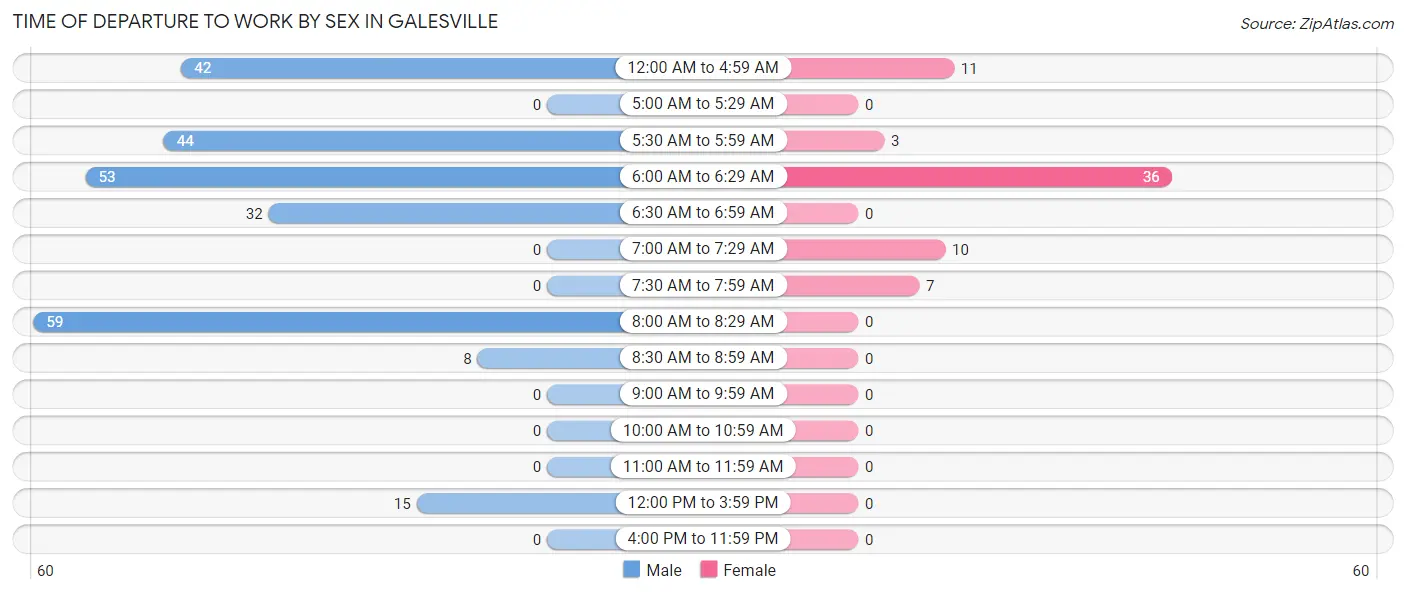
| Time of Departure | Male | Female |
| 12:00 AM to 4:59 AM | 42 (16.6%) | 11 (16.4%) |
| 5:00 AM to 5:29 AM | 0 (0.0%) | 0 (0.0%) |
| 5:30 AM to 5:59 AM | 44 (17.4%) | 3 (4.5%) |
| 6:00 AM to 6:29 AM | 53 (20.9%) | 36 (53.7%) |
| 6:30 AM to 6:59 AM | 32 (12.7%) | 0 (0.0%) |
| 7:00 AM to 7:29 AM | 0 (0.0%) | 10 (14.9%) |
| 7:30 AM to 7:59 AM | 0 (0.0%) | 7 (10.4%) |
| 8:00 AM to 8:29 AM | 59 (23.3%) | 0 (0.0%) |
| 8:30 AM to 8:59 AM | 8 (3.2%) | 0 (0.0%) |
| 9:00 AM to 9:59 AM | 0 (0.0%) | 0 (0.0%) |
| 10:00 AM to 10:59 AM | 0 (0.0%) | 0 (0.0%) |
| 11:00 AM to 11:59 AM | 0 (0.0%) | 0 (0.0%) |
| 12:00 PM to 3:59 PM | 15 (5.9%) | 0 (0.0%) |
| 4:00 PM to 11:59 PM | 0 (0.0%) | 0 (0.0%) |
| Total | 253 (100.0%) | 67 (100.0%) |
Housing Occupancy in Galesville
Occupancy by Ownership in Galesville
Of the total 404 dwellings in Galesville, owner-occupied units account for 373 (92.3%), while renter-occupied units make up 31 (7.7%).
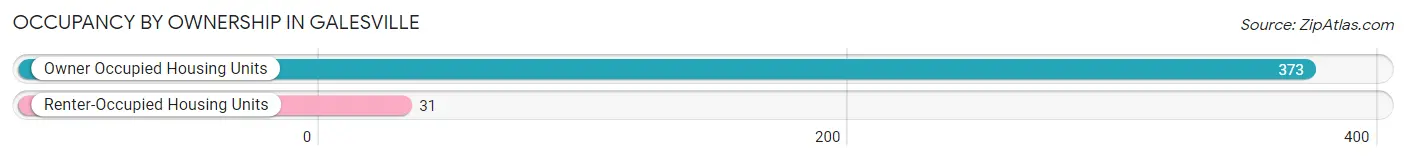
| Occupancy | # Housing Units | % Housing Units |
| Owner Occupied Housing Units | 373 | 92.3% |
| Renter-Occupied Housing Units | 31 | 7.7% |
| Total Occupied Housing Units | 404 | 100.0% |
Occupancy by Household Size in Galesville
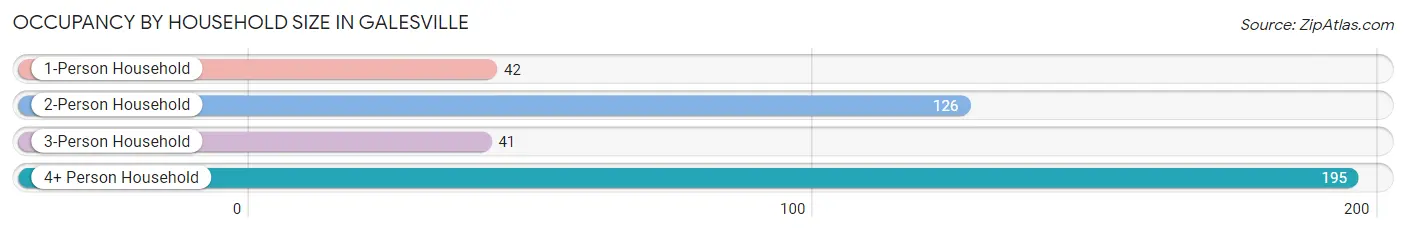
| Household Size | # Housing Units | % Housing Units |
| 1-Person Household | 42 | 10.4% |
| 2-Person Household | 126 | 31.2% |
| 3-Person Household | 41 | 10.2% |
| 4+ Person Household | 195 | 48.3% |
| Total Housing Units | 404 | 100.0% |
Occupancy by Ownership by Household Size in Galesville
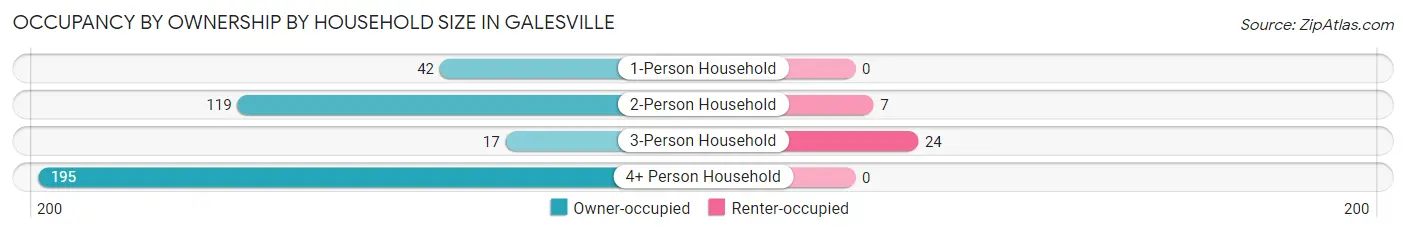
| Household Size | Owner-occupied | Renter-occupied |
| 1-Person Household | 42 (100.0%) | 0 (0.0%) |
| 2-Person Household | 119 (94.4%) | 7 (5.6%) |
| 3-Person Household | 17 (41.5%) | 24 (58.5%) |
| 4+ Person Household | 195 (100.0%) | 0 (0.0%) |
| Total Housing Units | 373 (92.3%) | 31 (7.7%) |
Occupancy by Educational Attainment in Galesville
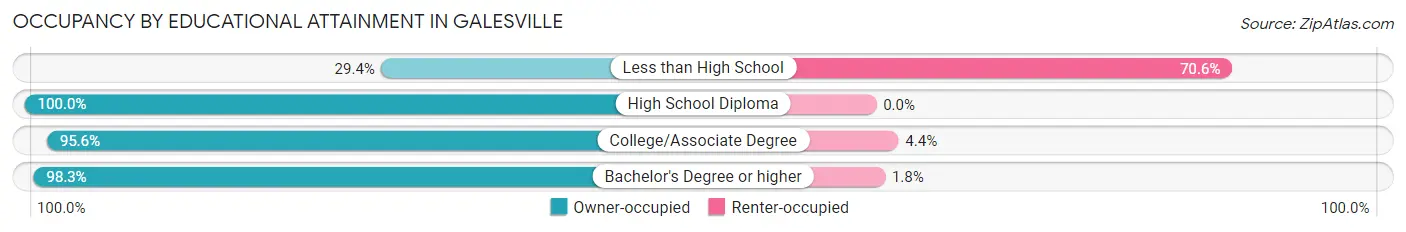
| Household Size | Owner-occupied | Renter-occupied |
| Less than High School | 10 (29.4%) | 24 (70.6%) |
| High School Diploma | 74 (100.0%) | 0 (0.0%) |
| College/Associate Degree | 65 (95.6%) | 3 (4.4%) |
| Bachelor's Degree or higher | 224 (98.3%) | 4 (1.8%) |
Occupancy by Age of Householder in Galesville
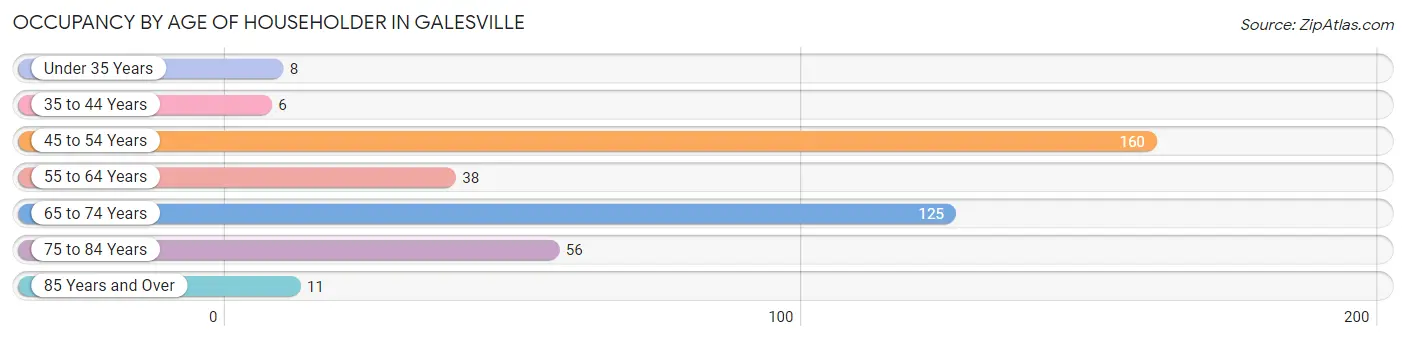
| Age Bracket | # Households | % Households |
| Under 35 Years | 8 | 2.0% |
| 35 to 44 Years | 6 | 1.5% |
| 45 to 54 Years | 160 | 39.6% |
| 55 to 64 Years | 38 | 9.4% |
| 65 to 74 Years | 125 | 30.9% |
| 75 to 84 Years | 56 | 13.9% |
| 85 Years and Over | 11 | 2.7% |
| Total | 404 | 100.0% |
Housing Finances in Galesville
Median Income by Occupancy in Galesville
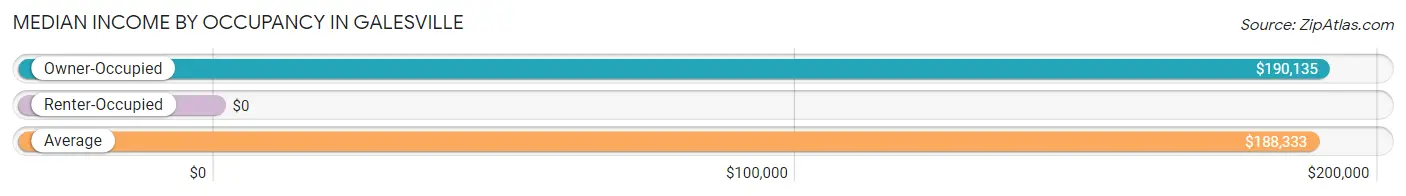
| Occupancy Type | # Households | Median Income |
| Owner-Occupied | 373 (92.3%) | $190,135 |
| Renter-Occupied | 31 (7.7%) | $0 |
| Average | 404 (100.0%) | $188,333 |
Occupancy by Householder Income Bracket in Galesville
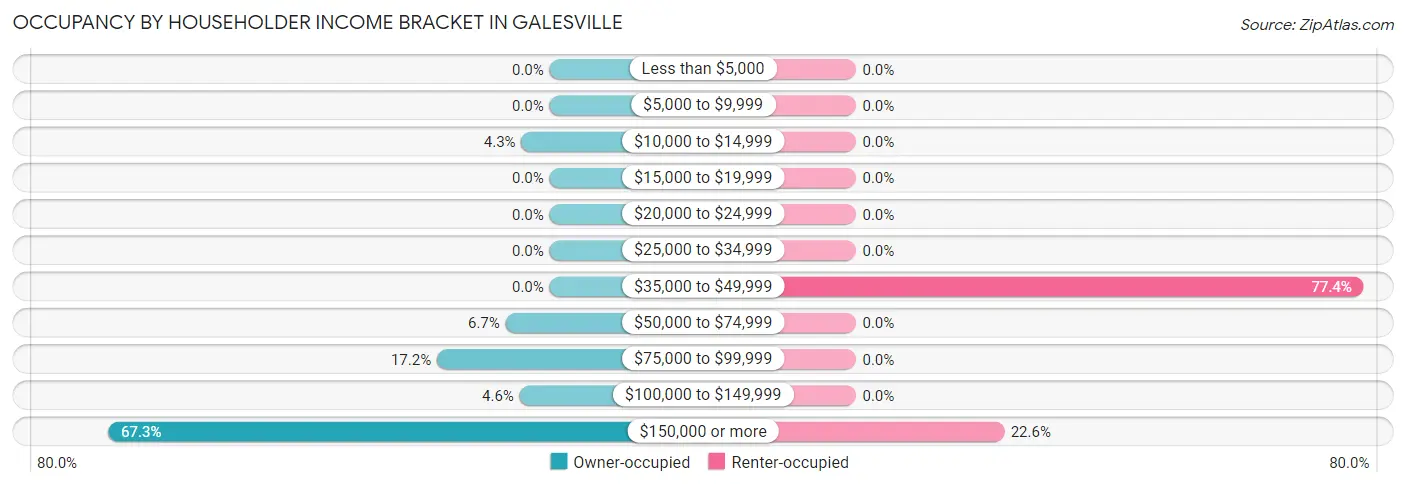
| Income Bracket | Owner-occupied | Renter-occupied |
| Less than $5,000 | 0 (0.0%) | 0 (0.0%) |
| $5,000 to $9,999 | 0 (0.0%) | 0 (0.0%) |
| $10,000 to $14,999 | 16 (4.3%) | 0 (0.0%) |
| $15,000 to $19,999 | 0 (0.0%) | 0 (0.0%) |
| $20,000 to $24,999 | 0 (0.0%) | 0 (0.0%) |
| $25,000 to $34,999 | 0 (0.0%) | 0 (0.0%) |
| $35,000 to $49,999 | 0 (0.0%) | 24 (77.4%) |
| $50,000 to $74,999 | 25 (6.7%) | 0 (0.0%) |
| $75,000 to $99,999 | 64 (17.2%) | 0 (0.0%) |
| $100,000 to $149,999 | 17 (4.6%) | 0 (0.0%) |
| $150,000 or more | 251 (67.3%) | 7 (22.6%) |
| Total | 373 (100.0%) | 31 (100.0%) |
Monthly Housing Cost Tiers in Galesville
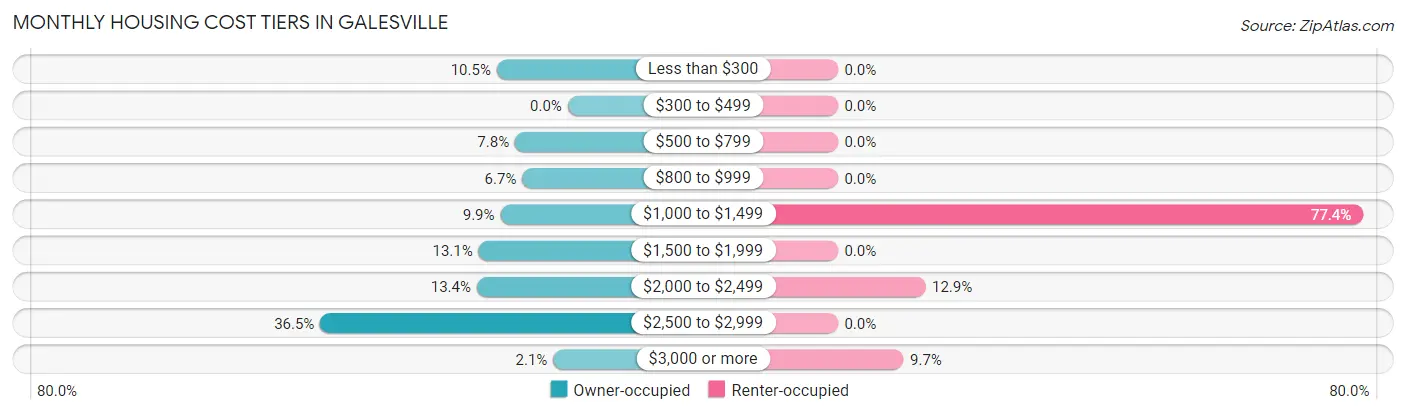
| Monthly Cost | Owner-occupied | Renter-occupied |
| Less than $300 | 39 (10.5%) | 0 (0.0%) |
| $300 to $499 | 0 (0.0%) | 0 (0.0%) |
| $500 to $799 | 29 (7.8%) | 0 (0.0%) |
| $800 to $999 | 25 (6.7%) | 0 (0.0%) |
| $1,000 to $1,499 | 37 (9.9%) | 24 (77.4%) |
| $1,500 to $1,999 | 49 (13.1%) | 0 (0.0%) |
| $2,000 to $2,499 | 50 (13.4%) | 4 (12.9%) |
| $2,500 to $2,999 | 136 (36.5%) | 0 (0.0%) |
| $3,000 or more | 8 (2.1%) | 3 (9.7%) |
| Total | 373 (100.0%) | 31 (100.0%) |
Physical Housing Characteristics in Galesville
Housing Structures in Galesville
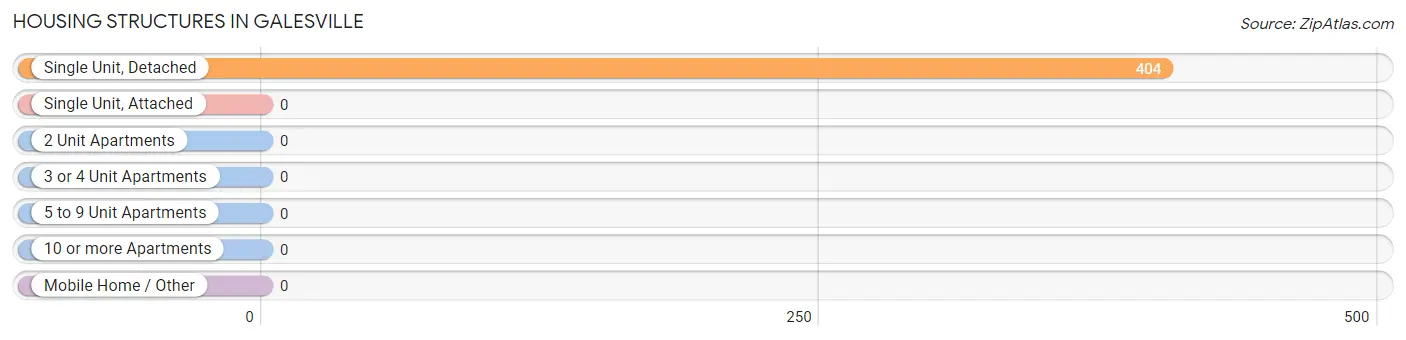
| Structure Type | # Housing Units | % Housing Units |
| Single Unit, Detached | 404 | 100.0% |
| Single Unit, Attached | 0 | 0.0% |
| 2 Unit Apartments | 0 | 0.0% |
| 3 or 4 Unit Apartments | 0 | 0.0% |
| 5 to 9 Unit Apartments | 0 | 0.0% |
| 10 or more Apartments | 0 | 0.0% |
| Mobile Home / Other | 0 | 0.0% |
| Total | 404 | 100.0% |
Housing Structures by Occupancy in Galesville
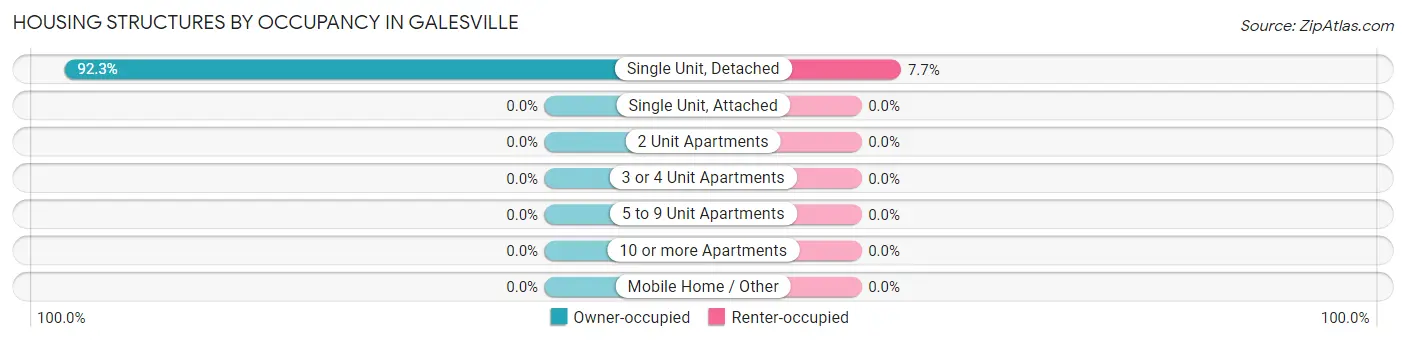
| Structure Type | Owner-occupied | Renter-occupied |
| Single Unit, Detached | 373 (92.3%) | 31 (7.7%) |
| Single Unit, Attached | 0 (0.0%) | 0 (0.0%) |
| 2 Unit Apartments | 0 (0.0%) | 0 (0.0%) |
| 3 or 4 Unit Apartments | 0 (0.0%) | 0 (0.0%) |
| 5 to 9 Unit Apartments | 0 (0.0%) | 0 (0.0%) |
| 10 or more Apartments | 0 (0.0%) | 0 (0.0%) |
| Mobile Home / Other | 0 (0.0%) | 0 (0.0%) |
| Total | 373 (92.3%) | 31 (7.7%) |
Housing Structures by Number of Rooms in Galesville
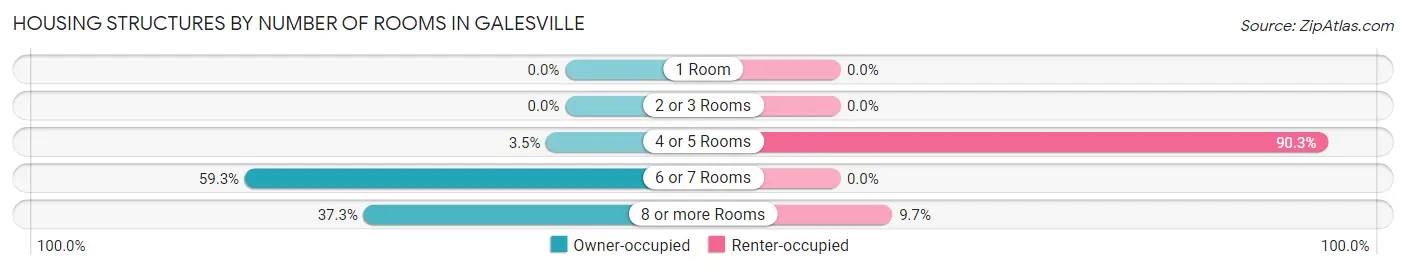
| Number of Rooms | Owner-occupied | Renter-occupied |
| 1 Room | 0 (0.0%) | 0 (0.0%) |
| 2 or 3 Rooms | 0 (0.0%) | 0 (0.0%) |
| 4 or 5 Rooms | 13 (3.5%) | 28 (90.3%) |
| 6 or 7 Rooms | 221 (59.3%) | 0 (0.0%) |
| 8 or more Rooms | 139 (37.3%) | 3 (9.7%) |
| Total | 373 (100.0%) | 31 (100.0%) |
Housing Structure by Heating Type in Galesville
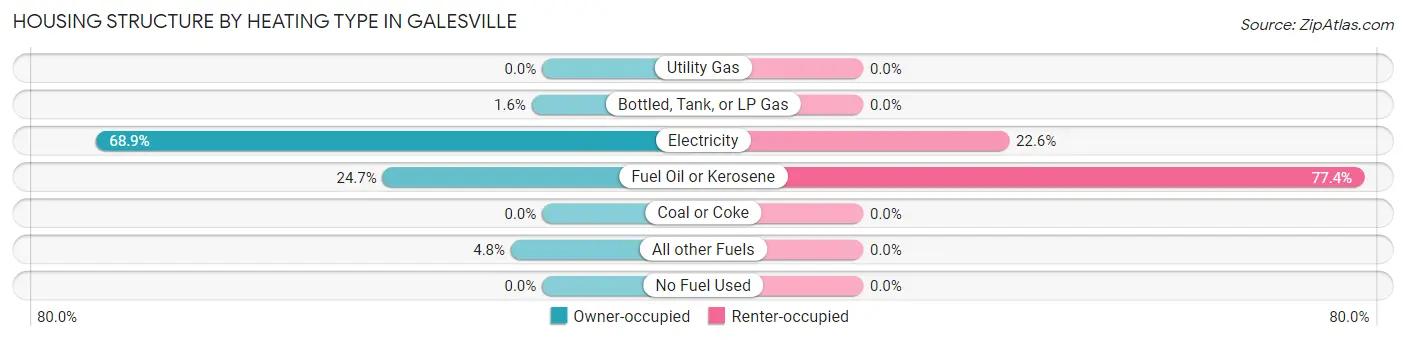
| Heating Type | Owner-occupied | Renter-occupied |
| Utility Gas | 0 (0.0%) | 0 (0.0%) |
| Bottled, Tank, or LP Gas | 6 (1.6%) | 0 (0.0%) |
| Electricity | 257 (68.9%) | 7 (22.6%) |
| Fuel Oil or Kerosene | 92 (24.7%) | 24 (77.4%) |
| Coal or Coke | 0 (0.0%) | 0 (0.0%) |
| All other Fuels | 18 (4.8%) | 0 (0.0%) |
| No Fuel Used | 0 (0.0%) | 0 (0.0%) |
| Total | 373 (100.0%) | 31 (100.0%) |
Household Vehicle Usage in Galesville
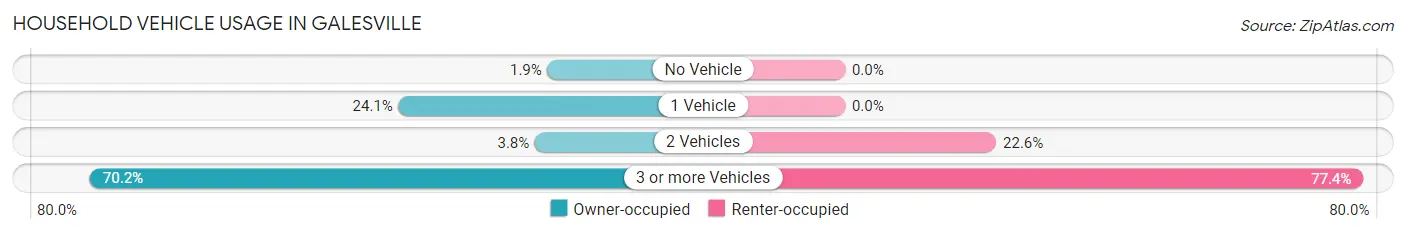
| Vehicles per Household | Owner-occupied | Renter-occupied |
| No Vehicle | 7 (1.9%) | 0 (0.0%) |
| 1 Vehicle | 90 (24.1%) | 0 (0.0%) |
| 2 Vehicles | 14 (3.7%) | 7 (22.6%) |
| 3 or more Vehicles | 262 (70.2%) | 24 (77.4%) |
| Total | 373 (100.0%) | 31 (100.0%) |
Real Estate & Mortgages in Galesville
Real Estate and Mortgage Overview in Galesville
| Characteristic | Without Mortgage | With Mortgage |
| Housing Units | 227 | 146 |
| Median Property Value | $819,300 | $428,100 |
| Median Household Income | $190,733 | $107 |
| Monthly Housing Costs | $1,501 | $8 |
| Real Estate Taxes | $10,001 | $16 |
Property Value by Mortgage Status in Galesville
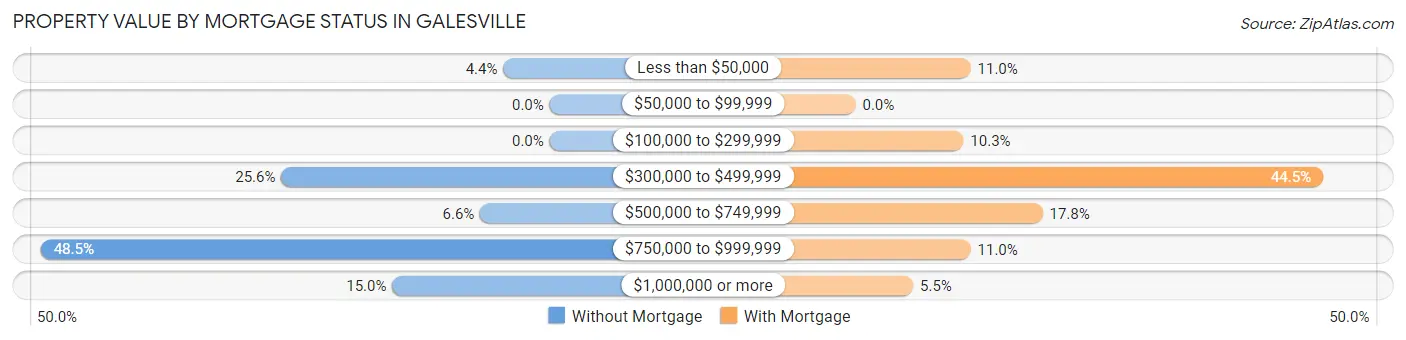
| Property Value | Without Mortgage | With Mortgage |
| Less than $50,000 | 10 (4.4%) | 16 (11.0%) |
| $50,000 to $99,999 | 0 (0.0%) | 0 (0.0%) |
| $100,000 to $299,999 | 0 (0.0%) | 15 (10.3%) |
| $300,000 to $499,999 | 58 (25.6%) | 65 (44.5%) |
| $500,000 to $749,999 | 15 (6.6%) | 26 (17.8%) |
| $750,000 to $999,999 | 110 (48.5%) | 16 (11.0%) |
| $1,000,000 or more | 34 (15.0%) | 8 (5.5%) |
| Total | 227 (100.0%) | 146 (100.0%) |
Household Income by Mortgage Status in Galesville
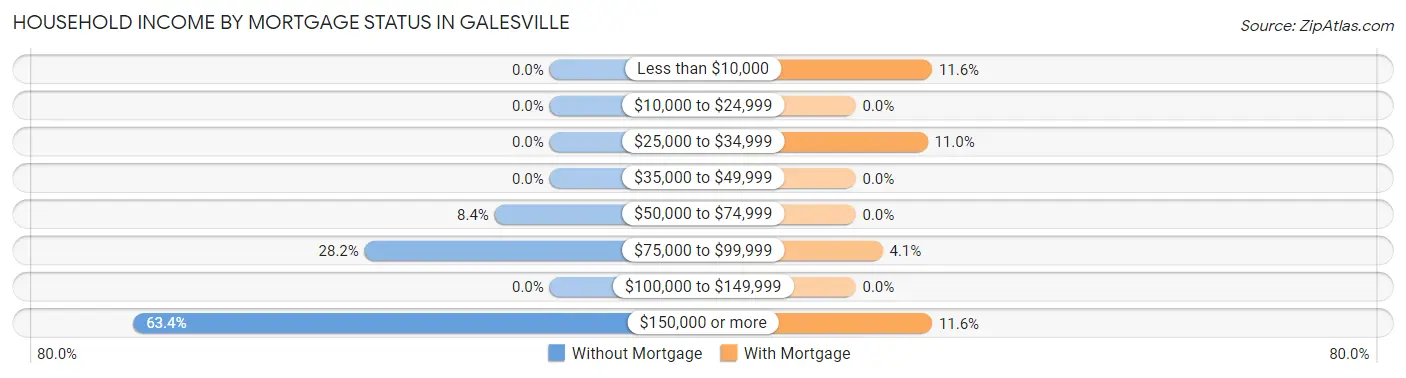
| Household Income | Without Mortgage | With Mortgage |
| Less than $10,000 | 0 (0.0%) | 17 (11.6%) |
| $10,000 to $24,999 | 0 (0.0%) | 0 (0.0%) |
| $25,000 to $34,999 | 0 (0.0%) | 16 (11.0%) |
| $35,000 to $49,999 | 0 (0.0%) | 0 (0.0%) |
| $50,000 to $74,999 | 19 (8.4%) | 0 (0.0%) |
| $75,000 to $99,999 | 64 (28.2%) | 6 (4.1%) |
| $100,000 to $149,999 | 0 (0.0%) | 0 (0.0%) |
| $150,000 or more | 144 (63.4%) | 17 (11.6%) |
| Total | 227 (100.0%) | 146 (100.0%) |
Property Value to Household Income Ratio in Galesville
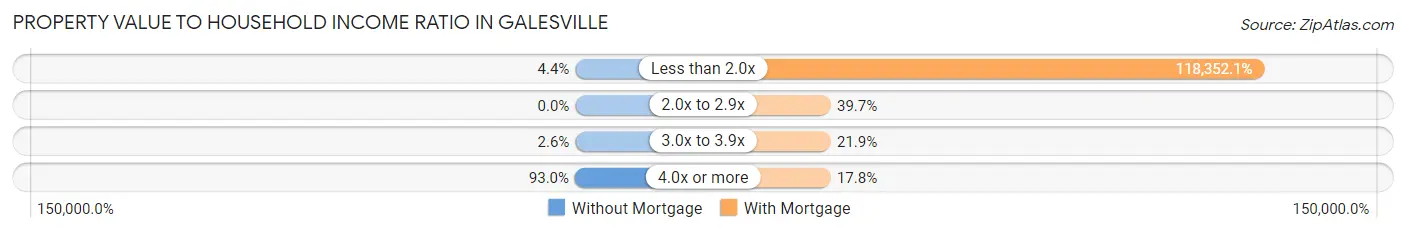
| Value-to-Income Ratio | Without Mortgage | With Mortgage |
| Less than 2.0x | 10 (4.4%) | 172,794 (118,352.1%) |
| 2.0x to 2.9x | 0 (0.0%) | 58 (39.7%) |
| 3.0x to 3.9x | 6 (2.6%) | 32 (21.9%) |
| 4.0x or more | 211 (92.9%) | 26 (17.8%) |
| Total | 227 (100.0%) | 146 (100.0%) |
Real Estate Taxes by Mortgage Status in Galesville

| Property Taxes | Without Mortgage | With Mortgage |
| Less than $800 | 0 (0.0%) | 0 (0.0%) |
| $800 to $1,499 | 0 (0.0%) | 0 (0.0%) |
| $800 to $1,499 | 188 (82.8%) | 0 (0.0%) |
| Total | 227 (100.0%) | 146 (100.0%) |
Health & Disability in Galesville
Health Insurance Coverage by Age in Galesville
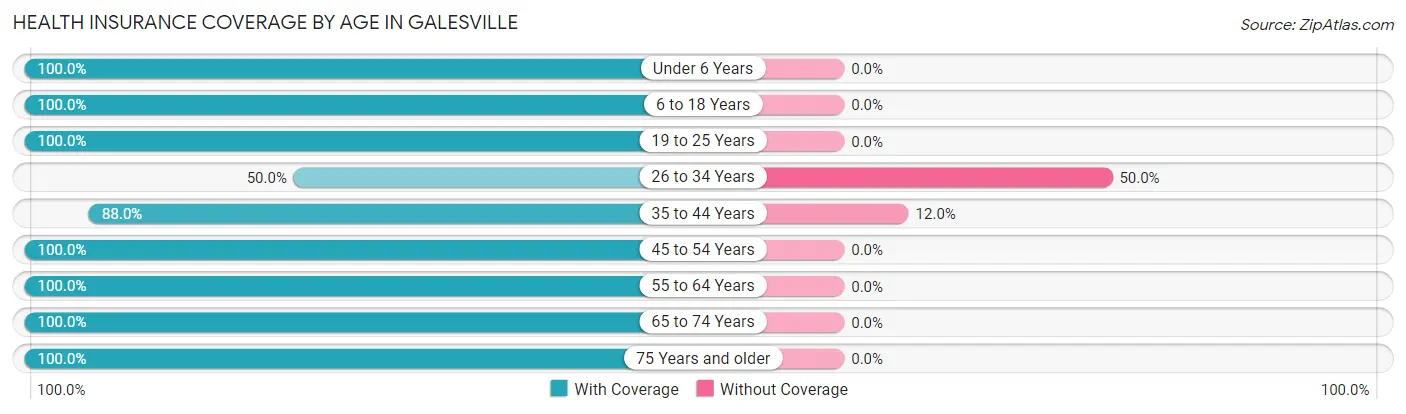
| Age Bracket | With Coverage | Without Coverage |
| Under 6 Years | 19 (100.0%) | 0 (0.0%) |
| 6 to 18 Years | 251 (100.0%) | 0 (0.0%) |
| 19 to 25 Years | 7 (100.0%) | 0 (0.0%) |
| 26 to 34 Years | 11 (50.0%) | 11 (50.0%) |
| 35 to 44 Years | 110 (88.0%) | 15 (12.0%) |
| 45 to 54 Years | 345 (100.0%) | 0 (0.0%) |
| 55 to 64 Years | 123 (100.0%) | 0 (0.0%) |
| 65 to 74 Years | 240 (100.0%) | 0 (0.0%) |
| 75 Years and older | 89 (100.0%) | 0 (0.0%) |
| Total | 1,195 (97.9%) | 26 (2.1%) |
Health Insurance Coverage by Citizenship Status in Galesville

| Citizenship Status | With Coverage | Without Coverage |
| Native Born | 19 (100.0%) | 0 (0.0%) |
| Foreign Born, Citizen | 251 (100.0%) | 0 (0.0%) |
| Foreign Born, not a Citizen | 7 (100.0%) | 0 (0.0%) |
Health Insurance Coverage by Household Income in Galesville
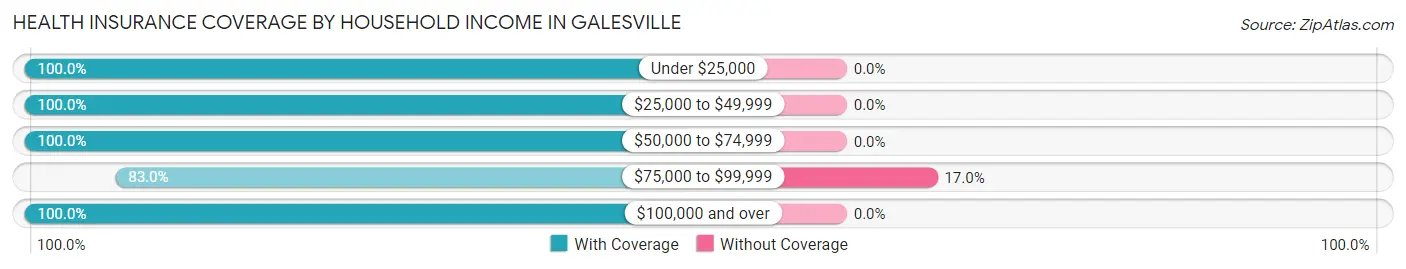
| Household Income | With Coverage | Without Coverage |
| Under $25,000 | 16 (100.0%) | 0 (0.0%) |
| $25,000 to $49,999 | 77 (100.0%) | 0 (0.0%) |
| $50,000 to $74,999 | 40 (100.0%) | 0 (0.0%) |
| $75,000 to $99,999 | 127 (83.0%) | 26 (17.0%) |
| $100,000 and over | 935 (100.0%) | 0 (0.0%) |
Public vs Private Health Insurance Coverage by Age in Galesville
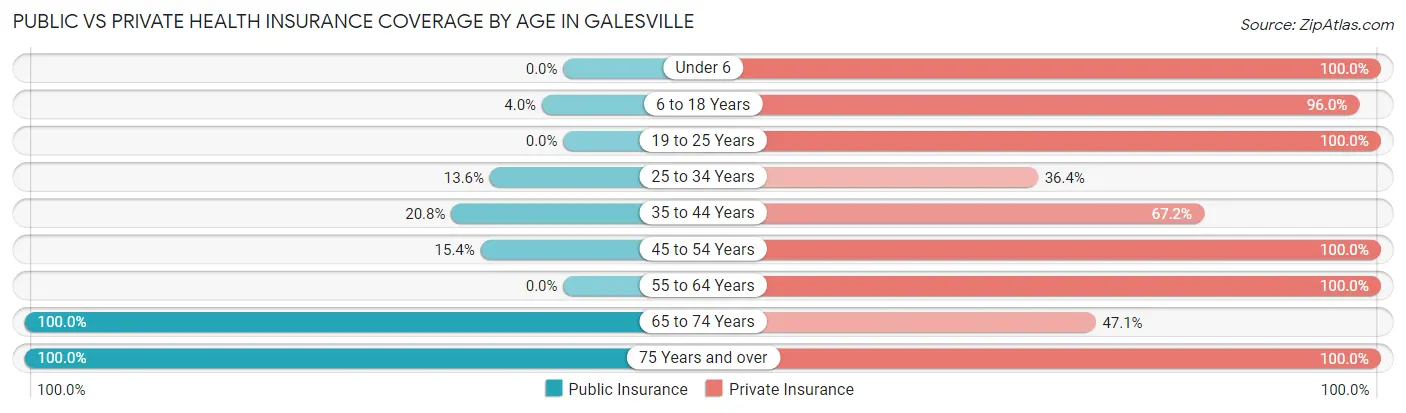
| Age Bracket | Public Insurance | Private Insurance |
| Under 6 | 0 (0.0%) | 19 (100.0%) |
| 6 to 18 Years | 10 (4.0%) | 241 (96.0%) |
| 19 to 25 Years | 0 (0.0%) | 7 (100.0%) |
| 25 to 34 Years | 3 (13.6%) | 8 (36.4%) |
| 35 to 44 Years | 26 (20.8%) | 84 (67.2%) |
| 45 to 54 Years | 53 (15.4%) | 345 (100.0%) |
| 55 to 64 Years | 0 (0.0%) | 123 (100.0%) |
| 65 to 74 Years | 240 (100.0%) | 113 (47.1%) |
| 75 Years and over | 89 (100.0%) | 89 (100.0%) |
| Total | 421 (34.5%) | 1,029 (84.3%) |
Disability Status by Sex by Age in Galesville
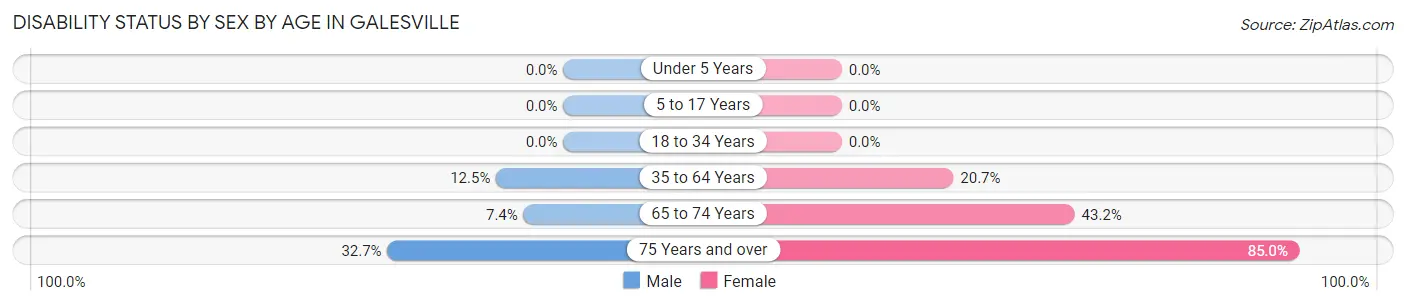
| Age Bracket | Male | Female |
| Under 5 Years | 0 (0.0%) | 0 (0.0%) |
| 5 to 17 Years | 0 (0.0%) | 0 (0.0%) |
| 18 to 34 Years | 0 (0.0%) | 0 (0.0%) |
| 35 to 64 Years | 39 (12.5%) | 58 (20.7%) |
| 65 to 74 Years | 9 (7.4%) | 51 (43.2%) |
| 75 Years and over | 16 (32.7%) | 34 (85.0%) |
Disability Class by Sex by Age in Galesville
Disability Class: Hearing Difficulty
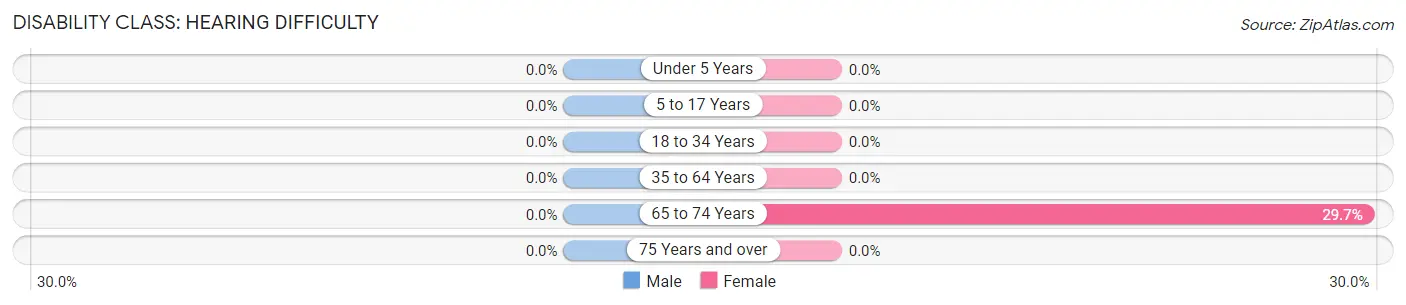
| Age Bracket | Male | Female |
| Under 5 Years | 0 (0.0%) | 0 (0.0%) |
| 5 to 17 Years | 0 (0.0%) | 0 (0.0%) |
| 18 to 34 Years | 0 (0.0%) | 0 (0.0%) |
| 35 to 64 Years | 0 (0.0%) | 0 (0.0%) |
| 65 to 74 Years | 0 (0.0%) | 35 (29.7%) |
| 75 Years and over | 0 (0.0%) | 0 (0.0%) |
Disability Class: Vision Difficulty
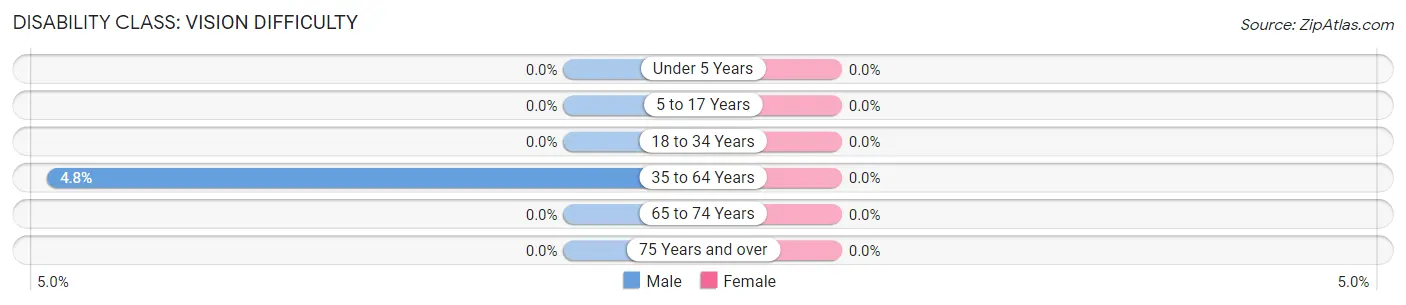
| Age Bracket | Male | Female |
| Under 5 Years | 0 (0.0%) | 0 (0.0%) |
| 5 to 17 Years | 0 (0.0%) | 0 (0.0%) |
| 18 to 34 Years | 0 (0.0%) | 0 (0.0%) |
| 35 to 64 Years | 15 (4.8%) | 0 (0.0%) |
| 65 to 74 Years | 0 (0.0%) | 0 (0.0%) |
| 75 Years and over | 0 (0.0%) | 0 (0.0%) |
Disability Class: Cognitive Difficulty
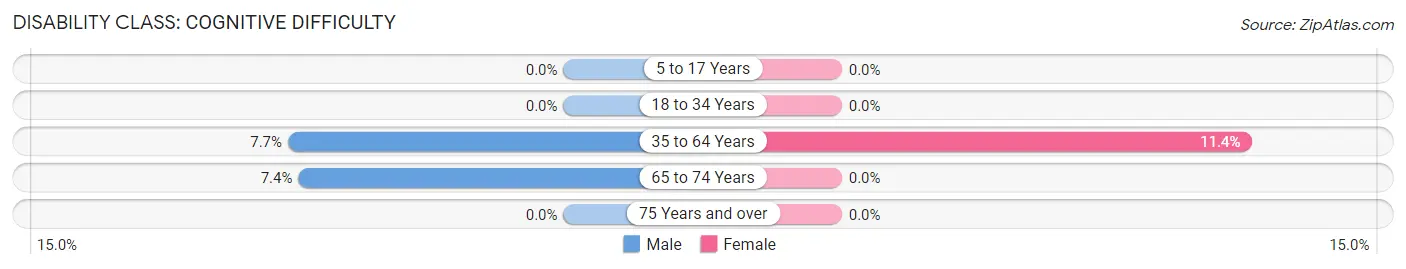
| Age Bracket | Male | Female |
| 5 to 17 Years | 0 (0.0%) | 0 (0.0%) |
| 18 to 34 Years | 0 (0.0%) | 0 (0.0%) |
| 35 to 64 Years | 24 (7.7%) | 32 (11.4%) |
| 65 to 74 Years | 9 (7.4%) | 0 (0.0%) |
| 75 Years and over | 0 (0.0%) | 0 (0.0%) |
Disability Class: Ambulatory Difficulty
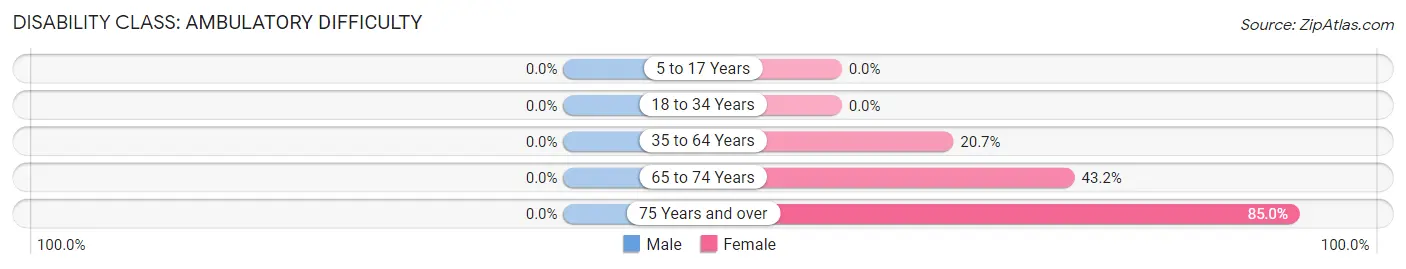
| Age Bracket | Male | Female |
| 5 to 17 Years | 0 (0.0%) | 0 (0.0%) |
| 18 to 34 Years | 0 (0.0%) | 0 (0.0%) |
| 35 to 64 Years | 0 (0.0%) | 58 (20.7%) |
| 65 to 74 Years | 0 (0.0%) | 51 (43.2%) |
| 75 Years and over | 0 (0.0%) | 34 (85.0%) |
Disability Class: Self-Care Difficulty
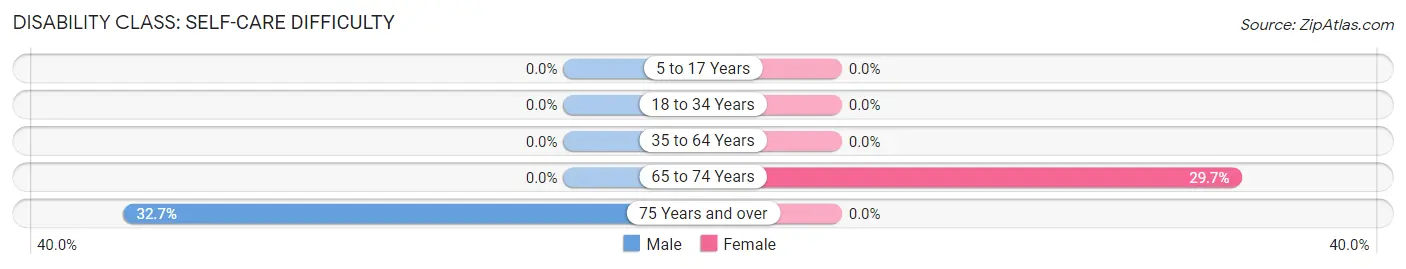
| Age Bracket | Male | Female |
| 5 to 17 Years | 0 (0.0%) | 0 (0.0%) |
| 18 to 34 Years | 0 (0.0%) | 0 (0.0%) |
| 35 to 64 Years | 0 (0.0%) | 0 (0.0%) |
| 65 to 74 Years | 0 (0.0%) | 35 (29.7%) |
| 75 Years and over | 16 (32.7%) | 0 (0.0%) |
Technology Access in Galesville
Computing Device Access in Galesville
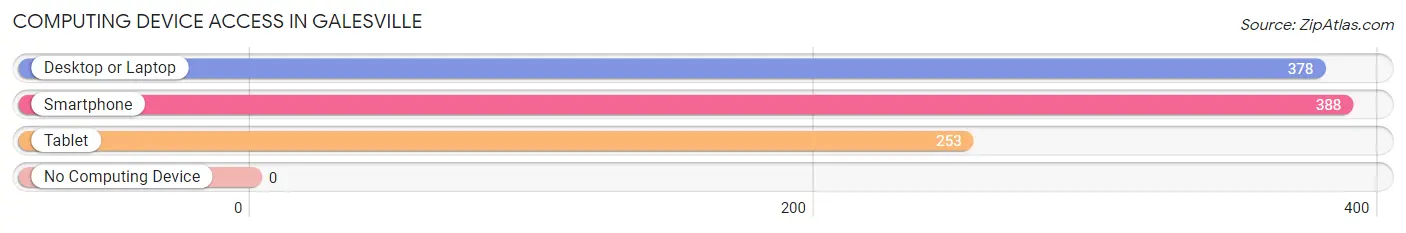
| Device Type | # Households | % Households |
| Desktop or Laptop | 378 | 93.6% |
| Smartphone | 388 | 96.0% |
| Tablet | 253 | 62.6% |
| No Computing Device | 0 | 0.0% |
| Total | 404 | 100.0% |
Internet Access in Galesville
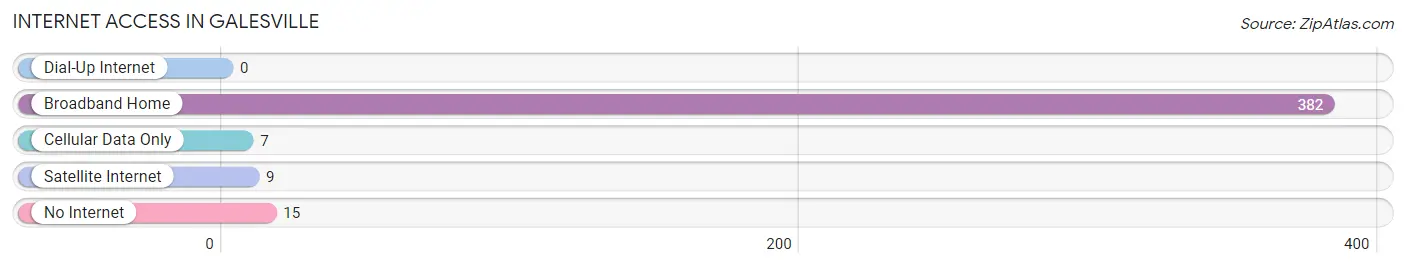
| Internet Type | # Households | % Households |
| Dial-Up Internet | 0 | 0.0% |
| Broadband Home | 382 | 94.6% |
| Cellular Data Only | 7 | 1.7% |
| Satellite Internet | 9 | 2.2% |
| No Internet | 15 | 3.7% |
| Total | 404 | 100.0% |
Galesville Summary
Galesville, Maryland is a small unincorporated community located in Anne Arundel County, Maryland. It is situated on the West River, a tributary of the Chesapeake Bay. The community is located approximately 10 miles south of Annapolis, the state capital. Galesville is a rural community with a population of approximately 1,000 people.
History
Galesville was first settled in the early 1700s by English settlers. The community was named after the Gales family, who were among the first settlers. The Gales family owned a large tract of land in the area, which was used for farming and fishing. The community grew slowly over the years, and by the mid-1800s, it had become a thriving agricultural and fishing community.
In the late 1800s, Galesville became a popular summer resort destination for wealthy Baltimoreans. The community was known for its beautiful scenery and its proximity to the Chesapeake Bay. The Galesville Hotel was built in the late 1800s and was a popular destination for visitors.
In the early 1900s, Galesville became a popular destination for boaters and fishermen. The community was home to several marinas and boatyards, and it was a popular spot for recreational fishing.
Geography
Galesville is located in Anne Arundel County, Maryland. It is situated on the West River, a tributary of the Chesapeake Bay. The community is located approximately 10 miles south of Annapolis, the state capital.
The community is located in a rural area, and it is surrounded by farmland and woodlands. The West River forms the eastern boundary of the community, and the Galesville Reservoir is located to the north. The community is located in a hilly area, and the highest point in the area is located at the Galesville Reservoir.
Economy
Galesville is a small, rural community with a population of approximately 1,000 people. The economy of the community is largely based on agriculture and fishing. The community is home to several farms, and the surrounding area is used for growing crops such as corn, soybeans, and wheat.
The community is also home to several marinas and boatyards, and it is a popular spot for recreational fishing. The community is also home to several small businesses, including restaurants, shops, and a grocery store.
Demographics
As of the 2010 census, the population of Galesville was 1,000 people. The racial makeup of the community was 94.2% White, 2.2% African American, 0.7% Asian, 0.3% Native American, and 2.6% from other races. The median household income in the community was $60,000, and the median home value was $250,000.
Conclusion
Galesville, Maryland is a small unincorporated community located in Anne Arundel County, Maryland. It is situated on the West River, a tributary of the Chesapeake Bay. The community was first settled in the early 1700s by English settlers, and it has grown slowly over the years. Today, Galesville is a rural community with a population of approximately 1,000 people. The economy of the community is largely based on agriculture and fishing, and it is also home to several small businesses. The racial makeup of the community is 94.2% White, 2.2% African American, 0.7% Asian, 0.3% Native American, and 2.6% from other races. The median household income in the community is $60,000, and the median home value is $250,000.
Common Questions
What is Per Capita Income in Galesville?
Per Capita income in Galesville is $53,010.
What is the Median Family Income in Galesville?
Median Family Income in Galesville is $188,194.
What is the Median Household income in Galesville?
Median Household Income in Galesville is $188,333.
What is Inequality or Gini Index in Galesville?
Inequality or Gini Index in Galesville is 0.25.
What is the Total Population of Galesville?
Total Population of Galesville is 1,226.
What is the Total Male Population of Galesville?
Total Male Population of Galesville is 576.
What is the Total Female Population of Galesville?
Total Female Population of Galesville is 650.
What is the Ratio of Males per 100 Females in Galesville?
There are 88.62 Males per 100 Females in Galesville.
What is the Ratio of Females per 100 Males in Galesville?
There are 112.85 Females per 100 Males in Galesville.
What is the Median Population Age in Galesville?
Median Population Age in Galesville is 51.7 Years.
What is the Average Family Size in Galesville
Average Family Size in Galesville is 3.2 People.
What is the Average Household Size in Galesville
Average Household Size in Galesville is 3.0 People.
How Large is the Labor Force in Galesville?
There are 577 People in the Labor Forcein in Galesville.
What is the Percentage of People in the Labor Force in Galesville?
51.3% of People are in the Labor Force in Galesville.
What is the Unemployment Rate in Galesville?
Unemployment Rate in Galesville is 2.8%.