Cities with the Highest Percentage of Households Heated by Utility Gas in Maryland
RELATED REPORTS & OPTIONS
Utility Gas Heating
Maryland
Compare Cities
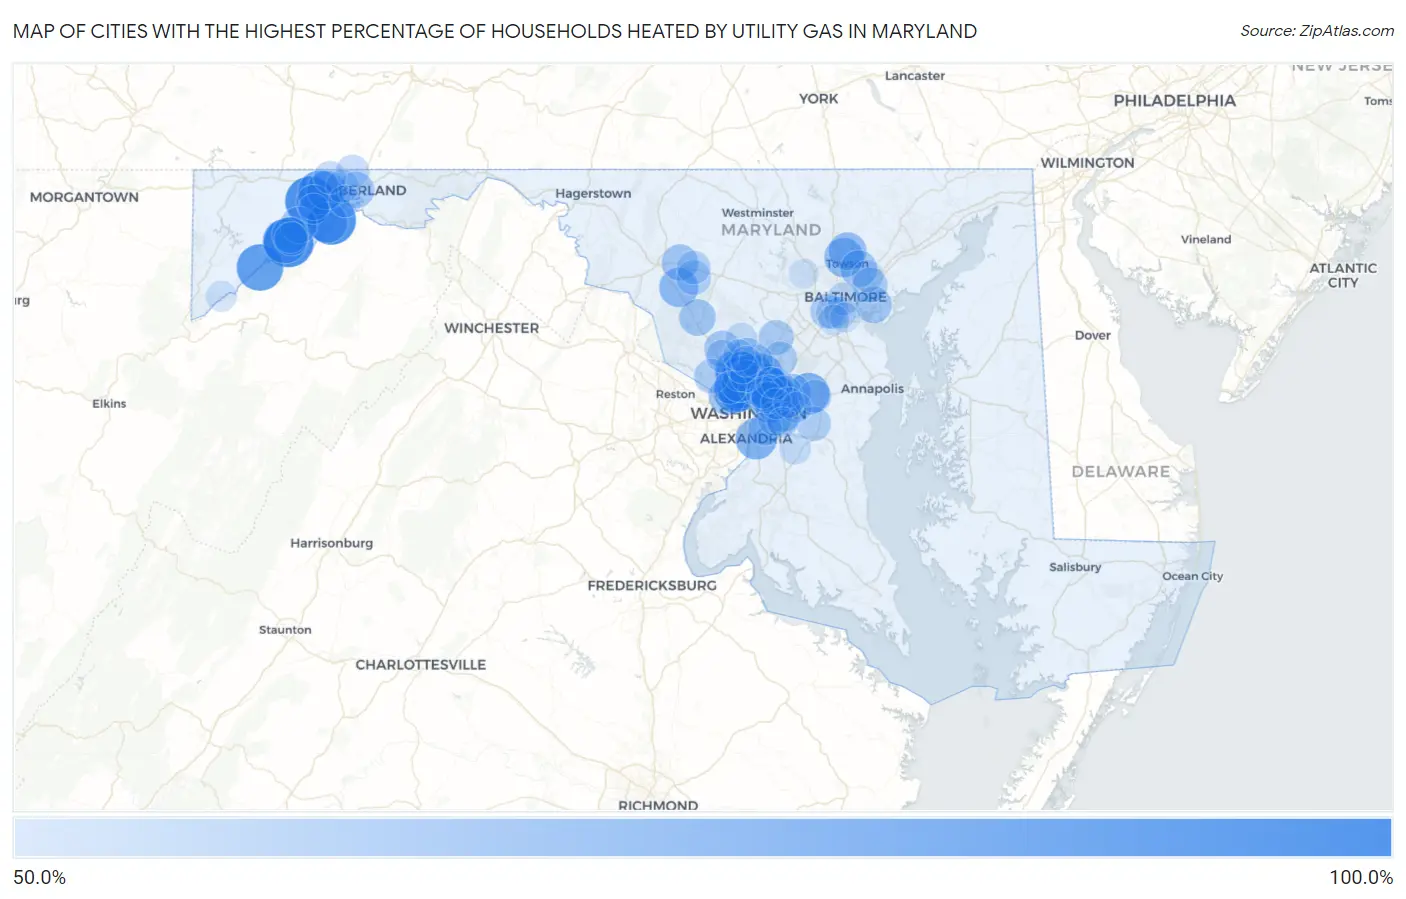
Map of Cities with the Highest Percentage of Households Heated by Utility Gas in Maryland
0.0%
100.0%
Cities with the Highest Percentage of Households Heated by Utility Gas in Maryland
| City | Utility Gas Heating | vs State | vs National | |
| 1. | Klondike | 100.0% | 43.3%(+56.7)#1 | 47.1%(+52.9)#76 |
| 2. | Bier | 100.0% | 43.3%(+56.7)#2 | 47.1%(+52.9)#81 |
| 3. | Luke | 100.0% | 43.3%(+56.7)#3 | 47.1%(+52.9)#154 |
| 4. | Kitzmiller | 93.2% | 43.3%(+49.9)#4 | 47.1%(+46.1)#697 |
| 5. | Chevy Chase View | 90.7% | 43.3%(+47.4)#5 | 47.1%(+43.6)#1,140 |
| 6. | University Park | 90.6% | 43.3%(+47.3)#6 | 47.1%(+43.5)#1,155 |
| 7. | Chevy Chase Section Five | 88.6% | 43.3%(+45.3)#7 | 47.1%(+41.5)#1,627 |
| 8. | Chevy Chase Section Three | 88.2% | 43.3%(+44.9)#8 | 47.1%(+41.1)#1,727 |
| 9. | Grahamtown | 87.9% | 43.3%(+44.6)#9 | 47.1%(+40.8)#1,809 |
| 10. | Bloomington | 87.9% | 43.3%(+44.6)#10 | 47.1%(+40.8)#1,813 |
| 11. | Woodlawn Cdp Prince George S County | 86.8% | 43.3%(+43.5)#11 | 47.1%(+39.7)#2,095 |
| 12. | Somerset | 85.3% | 43.3%(+42.0)#12 | 47.1%(+38.2)#2,620 |
| 13. | Garrett Park | 84.0% | 43.3%(+40.7)#13 | 47.1%(+36.9)#3,078 |
| 14. | Langley Park | 83.1% | 43.3%(+39.8)#14 | 47.1%(+36.0)#3,345 |
| 15. | Fairwood | 82.8% | 43.3%(+39.5)#15 | 47.1%(+35.7)#3,462 |
| 16. | Martin S Additions | 82.0% | 43.3%(+38.7)#16 | 47.1%(+34.9)#3,763 |
| 17. | Hillandale | 81.9% | 43.3%(+38.6)#17 | 47.1%(+34.8)#3,790 |
| 18. | Forest Heights | 81.6% | 43.3%(+38.3)#18 | 47.1%(+34.5)#3,916 |
| 19. | Landover Hills | 81.6% | 43.3%(+38.3)#19 | 47.1%(+34.5)#3,920 |
| 20. | Chevy Chase Village | 81.2% | 43.3%(+37.9)#20 | 47.1%(+34.1)#4,089 |
| 21. | North Chevy Chase | 80.5% | 43.3%(+37.2)#21 | 47.1%(+33.4)#4,343 |
| 22. | Colmar Manor | 80.0% | 43.3%(+36.7)#22 | 47.1%(+32.9)#4,543 |
| 23. | Rawlings | 79.7% | 43.3%(+36.4)#23 | 47.1%(+32.6)#4,677 |
| 24. | South Kensington | 76.9% | 43.3%(+33.6)#24 | 47.1%(+29.8)#5,707 |
| 25. | Urbana | 76.8% | 43.3%(+33.5)#25 | 47.1%(+29.7)#5,746 |
| 26. | Lutherville | 76.7% | 43.3%(+33.4)#26 | 47.1%(+29.6)#5,786 |
| 27. | Four Corners | 75.8% | 43.3%(+32.5)#27 | 47.1%(+28.7)#6,174 |
| 28. | Eckhart Mines | 75.8% | 43.3%(+32.5)#28 | 47.1%(+28.7)#6,199 |
| 29. | Adelphi | 75.4% | 43.3%(+32.1)#29 | 47.1%(+28.3)#6,330 |
| 30. | Peppermill Village | 75.1% | 43.3%(+31.8)#30 | 47.1%(+28.0)#6,433 |
| 31. | North Kensington | 74.9% | 43.3%(+31.6)#31 | 47.1%(+27.8)#6,511 |
| 32. | Timonium | 74.0% | 43.3%(+30.7)#32 | 47.1%(+26.9)#6,878 |
| 33. | Brookmont | 73.7% | 43.3%(+30.4)#33 | 47.1%(+26.6)#6,979 |
| 34. | Kemp Mill | 73.5% | 43.3%(+30.2)#34 | 47.1%(+26.4)#7,055 |
| 35. | North Brentwood | 73.1% | 43.3%(+29.8)#35 | 47.1%(+26.0)#7,217 |
| 36. | Lanham | 72.5% | 43.3%(+29.2)#36 | 47.1%(+25.4)#7,415 |
| 37. | Chevy Chase | 72.0% | 43.3%(+28.7)#37 | 47.1%(+24.9)#7,604 |
| 38. | East Riverdale | 71.9% | 43.3%(+28.6)#38 | 47.1%(+24.8)#7,638 |
| 39. | Parkville | 71.7% | 43.3%(+28.4)#39 | 47.1%(+24.6)#7,695 |
| 40. | Barton | 71.1% | 43.3%(+27.8)#40 | 47.1%(+24.0)#7,933 |
| 41. | Clarksburg | 70.9% | 43.3%(+27.6)#41 | 47.1%(+23.8)#7,971 |
| 42. | Spring Ridge | 70.5% | 43.3%(+27.2)#42 | 47.1%(+23.4)#8,107 |
| 43. | Dundalk | 70.4% | 43.3%(+27.1)#43 | 47.1%(+23.3)#8,127 |
| 44. | Layhill | 70.4% | 43.3%(+27.1)#44 | 47.1%(+23.3)#8,141 |
| 45. | Cumberland | 70.3% | 43.3%(+27.0)#45 | 47.1%(+23.2)#8,177 |
| 46. | Derwood | 70.3% | 43.3%(+27.0)#46 | 47.1%(+23.2)#8,195 |
| 47. | Franklin | 69.9% | 43.3%(+26.6)#47 | 47.1%(+22.8)#8,338 |
| 48. | Riverdale Park | 69.5% | 43.3%(+26.2)#48 | 47.1%(+22.4)#8,427 |
| 49. | Edmonston | 69.5% | 43.3%(+26.2)#49 | 47.1%(+22.4)#8,435 |
| 50. | Takoma Park | 69.2% | 43.3%(+25.9)#50 | 47.1%(+22.1)#8,512 |
| 51. | Kensington | 68.4% | 43.3%(+25.1)#51 | 47.1%(+21.3)#8,783 |
| 52. | Cottage City | 68.2% | 43.3%(+24.9)#52 | 47.1%(+21.1)#8,851 |
| 53. | Woodland | 68.2% | 43.3%(+24.9)#53 | 47.1%(+21.1)#8,861 |
| 54. | Hyattsville | 68.0% | 43.3%(+24.7)#54 | 47.1%(+20.9)#8,893 |
| 55. | Fulton | 67.6% | 43.3%(+24.3)#55 | 47.1%(+20.5)#9,038 |
| 56. | Rosedale | 67.5% | 43.3%(+24.2)#56 | 47.1%(+20.4)#9,064 |
| 57. | Potomac | 66.7% | 43.3%(+23.4)#57 | 47.1%(+19.6)#9,309 |
| 58. | Monrovia | 66.7% | 43.3%(+23.4)#58 | 47.1%(+19.6)#9,322 |
| 59. | Arbutus | 66.6% | 43.3%(+23.3)#59 | 47.1%(+19.5)#9,370 |
| 60. | Konterra | 66.6% | 43.3%(+23.3)#60 | 47.1%(+19.5)#9,384 |
| 61. | Brock Hall | 66.4% | 43.3%(+23.1)#61 | 47.1%(+19.3)#9,421 |
| 62. | Walker Mill | 65.2% | 43.3%(+21.9)#62 | 47.1%(+18.1)#9,788 |
| 63. | Honeygo | 65.1% | 43.3%(+21.8)#63 | 47.1%(+18.0)#9,819 |
| 64. | New Carrollton | 65.0% | 43.3%(+21.7)#64 | 47.1%(+17.9)#9,845 |
| 65. | Coral Hills | 64.6% | 43.3%(+21.3)#65 | 47.1%(+17.5)#9,958 |
| 66. | Hillcrest Heights | 64.5% | 43.3%(+21.2)#66 | 47.1%(+17.4)#9,986 |
| 67. | Westernport | 64.4% | 43.3%(+21.1)#67 | 47.1%(+17.3)#10,018 |
| 68. | Colesville | 64.3% | 43.3%(+21.0)#68 | 47.1%(+17.2)#10,033 |
| 69. | New Market | 64.3% | 43.3%(+21.0)#69 | 47.1%(+17.2)#10,046 |
| 70. | Rockville | 63.3% | 43.3%(+20.0)#70 | 47.1%(+16.2)#10,330 |
| 71. | Lansdowne | 63.3% | 43.3%(+20.0)#71 | 47.1%(+16.2)#10,340 |
| 72. | Bowie | 63.0% | 43.3%(+19.7)#72 | 47.1%(+15.9)#10,421 |
| 73. | La Vale | 63.0% | 43.3%(+19.7)#73 | 47.1%(+15.9)#10,434 |
| 74. | Baltimore | 62.8% | 43.3%(+19.5)#74 | 47.1%(+15.7)#10,468 |
| 75. | Ellerslie | 62.8% | 43.3%(+19.5)#75 | 47.1%(+15.7)#10,489 |
| 76. | Mount Savage | 62.6% | 43.3%(+19.3)#76 | 47.1%(+15.5)#10,552 |
| 77. | Bethesda | 62.0% | 43.3%(+18.7)#77 | 47.1%(+14.9)#10,696 |
| 78. | Chillum | 61.2% | 43.3%(+17.9)#78 | 47.1%(+14.1)#10,882 |
| 79. | Overlea | 61.0% | 43.3%(+17.7)#79 | 47.1%(+13.9)#10,933 |
| 80. | Baltimore Highlands | 61.0% | 43.3%(+17.7)#80 | 47.1%(+13.9)#10,934 |
| 81. | Forest Glen | 61.0% | 43.3%(+17.7)#81 | 47.1%(+13.9)#10,935 |
| 82. | Potomac Park | 61.0% | 43.3%(+17.7)#82 | 47.1%(+13.9)#10,943 |
| 83. | Olney | 60.9% | 43.3%(+17.6)#83 | 47.1%(+13.8)#10,952 |
| 84. | Brentwood | 60.9% | 43.3%(+17.6)#84 | 47.1%(+13.8)#10,958 |
| 85. | Wheaton | 60.8% | 43.3%(+17.5)#85 | 47.1%(+13.7)#10,968 |
| 86. | Burnt Mills | 60.5% | 43.3%(+17.2)#86 | 47.1%(+13.4)#11,041 |
| 87. | Rosaryville | 60.1% | 43.3%(+16.8)#87 | 47.1%(+13.0)#11,125 |
| 88. | Berwyn Heights | 59.9% | 43.3%(+16.6)#88 | 47.1%(+12.8)#11,208 |
| 89. | Aspen Hill | 59.7% | 43.3%(+16.4)#89 | 47.1%(+12.6)#11,245 |
| 90. | College Park | 58.8% | 43.3%(+15.5)#90 | 47.1%(+11.7)#11,465 |
| 91. | Cheverly | 58.6% | 43.3%(+15.3)#91 | 47.1%(+11.5)#11,530 |
| 92. | Lake Arbor | 58.5% | 43.3%(+15.2)#92 | 47.1%(+11.4)#11,558 |
| 93. | Linthicum | 58.5% | 43.3%(+15.2)#93 | 47.1%(+11.4)#11,560 |
| 94. | Gorman | 58.5% | 43.3%(+15.2)#94 | 47.1%(+11.4)#11,575 |
| 95. | Glenmont | 58.1% | 43.3%(+14.8)#95 | 47.1%(+11.0)#11,666 |
| 96. | Midland | 57.7% | 43.3%(+14.4)#96 | 47.1%(+10.6)#11,793 |
| 97. | Glenarden | 57.6% | 43.3%(+14.3)#97 | 47.1%(+10.5)#11,807 |
| 98. | District Heights | 57.4% | 43.3%(+14.1)#98 | 47.1%(+10.3)#11,860 |
| 99. | Randallstown | 57.2% | 43.3%(+13.9)#99 | 47.1%(+10.1)#11,902 |
| 100. | Brooklyn Park | 57.1% | 43.3%(+13.8)#100 | 47.1%(+10.0)#11,920 |
Common Questions
What are the Top 10 Cities with the Highest Percentage of Households Heated by Utility Gas in Maryland?
Top 10 Cities with the Highest Percentage of Households Heated by Utility Gas in Maryland are:
#1
100.0%
#2
100.0%
#3
100.0%
#4
93.2%
#5
90.7%
#6
90.6%
#7
88.6%
#8
88.2%
#9
87.9%
#10
87.9%
What city has the Highest Percentage of Households Heated by Utility Gas in Maryland?
Klondike has the Highest Percentage of Households Heated by Utility Gas in Maryland with 100.0%.
What is the Percentage of Households Heated by Utility Gas in the State of Maryland?
Percentage of Households Heated by Utility Gas in Maryland is 43.3%.
What is the Percentage of Households Heated by Utility Gas in the United States?
Percentage of Households Heated by Utility Gas in the United States is 47.1%.