Zip Codes with the Highest Percentage of Population Employed in Farming, Fishing & Forestry in Bothell, WA

RELATED REPORTS & OPTIONS

Farming, Fishing & Forestry
Population
Families and Households
Female Fertility
Female Fertility (Unmarried)
Race (Community Size)
Race (Percentage)
Ancestry (Community Size)
AfricanAlaskan AthabascanAmericanApacheArabArmenianAustralianAustrianBelgianBhutaneseBlackfeetBrazilianBritishBulgarianBurmeseCambodianCanadianCentral AmericanCherokeeChileanChoctawColombianColvilleCroatianCubanCzechCzechoslovakianDanishDominicanDutchEastern EuropeanEgyptianEnglishEthiopianEuropeanFilipinoFinnishFrenchFrench American IndianFrench CanadianGermanGreekGuamanian / ChamorroGuatemalanHungarianIndian (Asian)InupiatIranianIraqiIrishItalianJamaicanJapaneseJordanianKenyanKoreanLaotianLebaneseLithuanianLuxembourgerMalaysianMexicanNative HawaiianNicaraguanNigerianNorthern EuropeanNorwegianOsagePakistaniPanamanianPeruvianPolishPortuguesePuerto RicanRomanianRussianSalvadoranSamoanScandinavianScotch-IrishScottishSerbianSiouxSlovakSloveneSomaliSouth AmericanSpaniardSpanishSri LankanSubsaharan AfricanSwedishSwissThaiTlingit-HaidaTurkishUkrainianVenezuelanVietnameseWelshYugoslavian
Ancestry (Percentage)
AfricanAlaskan AthabascanAmericanApacheArabArmenianAustralianAustrianBelgianBhutaneseBlackfeetBrazilianBritishBulgarianBurmeseCambodianCanadianCentral AmericanCherokeeChileanChoctawColombianColvilleCroatianCubanCzechCzechoslovakianDanishDominicanDutchEastern EuropeanEgyptianEnglishEthiopianEuropeanFilipinoFinnishFrenchFrench American IndianFrench CanadianGermanGreekGuamanian / ChamorroGuatemalanHungarianIndian (Asian)InupiatIranianIraqiIrishItalianJamaicanJapaneseJordanianKenyanKoreanLaotianLebaneseLithuanianLuxembourgerMalaysianMexicanNative HawaiianNicaraguanNigerianNorthern EuropeanNorwegianOsagePakistaniPanamanianPeruvianPolishPortuguesePuerto RicanRomanianRussianSalvadoranSamoanScandinavianScotch-IrishScottishSerbianSiouxSlovakSloveneSomaliSouth AmericanSpaniardSpanishSri LankanSubsaharan AfricanSwedishSwissThaiTlingit-HaidaTurkishUkrainianVenezuelanVietnameseWelshYugoslavian
Immigrant Origin (Total)
Immigrant Origin (Percentage)
Income
Income (Families)
Income (Households)
Poverty
Poverty (Families)
Unemployment
Employment Occupations
Employment Industries
Employer Class
Commute Time
Commute Means
School Enrollment
Education by Degree Field
Occupancy
Finances
Physical Characteristics
Bothell
Compare Zip Codes
Comparison Subject

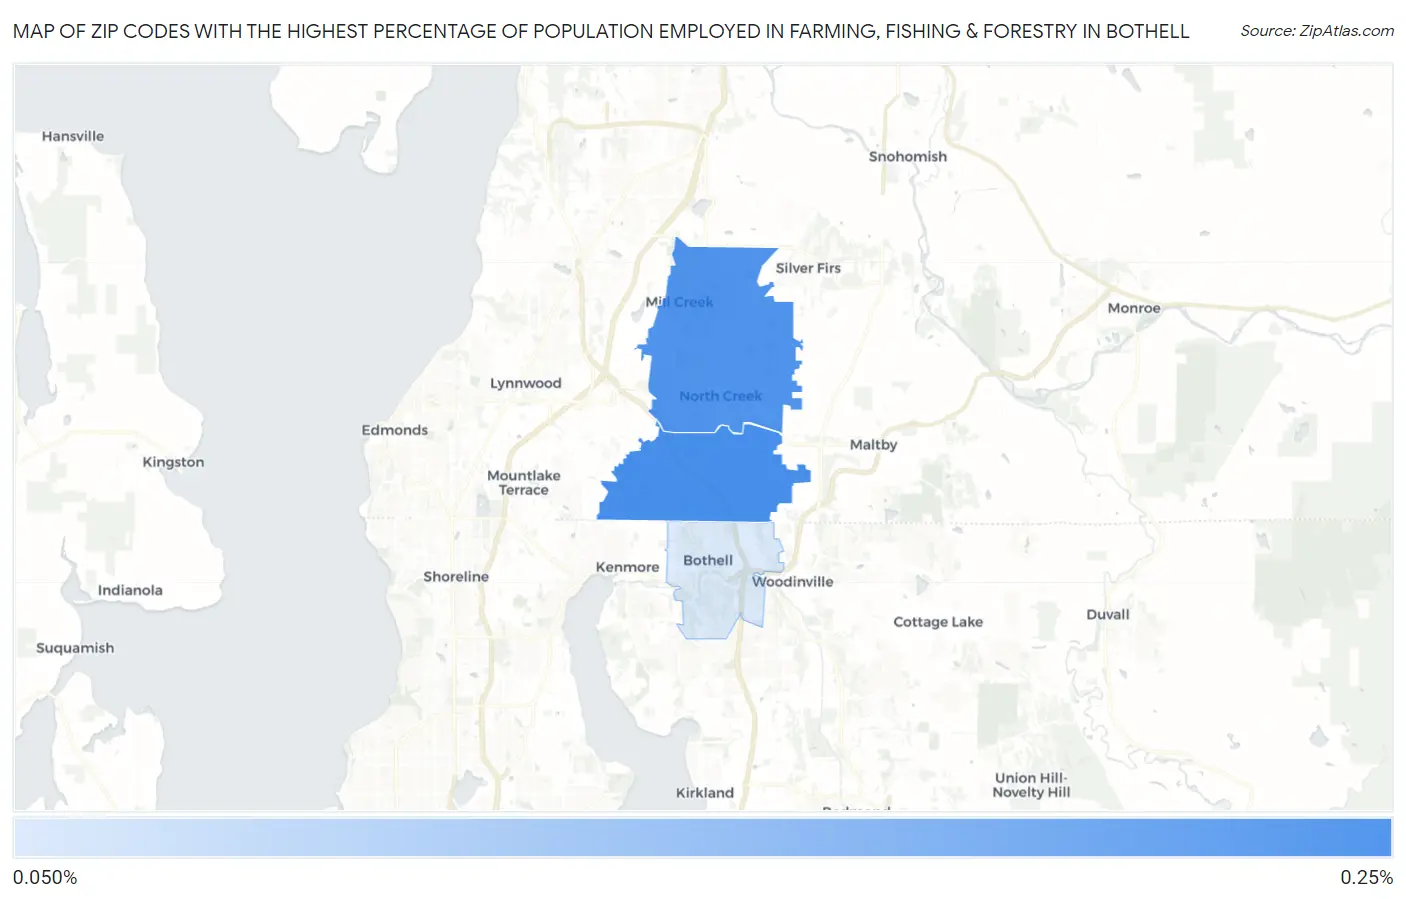
Map of Zip Codes with the Highest Percentage of Population Employed in Farming, Fishing & Forestry in Bothell

0.0%
0.25%
Zip Codes with the Highest Percentage of Population Employed in Farming, Fishing & Forestry in Bothell Map

Zip Codes with the Highest Percentage of Population Employed in Farming, Fishing & Forestry in Bothell, WA

Zip Code % Employed vs State vs National
1.980210.22%1.5%(-1.29)#3740.61%(-0.388)#15,877
2.980120.21%1.5%(-1.30)#3760.61%(-0.391)#15,936
3.980110.14%1.5%(-1.37)#4010.61%(-0.468)#17,143

Common Questions

What are the Top Zip Codes with the Highest Percentage of Population Employed in Farming, Fishing & Forestry in Bothell, WA?
Top Zip Codes with the Highest Percentage of Population Employed in Farming, Fishing & Forestry in Bothell, WA are:
#1
0.22%
#2
0.21%
#3
0.14%
What zip code has the Highest Percentage of Population Employed in Farming, Fishing & Forestry in Bothell, WA?
98021 has the Highest Percentage of Population Employed in Farming, Fishing & Forestry in Bothell, WA with 0.22%.
What is the Percentage of Population Employed in Farming, Fishing & Forestry in Bothell, WA?
Percentage of Population Employed in Farming, Fishing & Forestry in Bothell is 0.23%.
What is the Percentage of Population Employed in Farming, Fishing & Forestry in Washington?
Percentage of Population Employed in Farming, Fishing & Forestry in Washington is 1.5%.
What is the Percentage of Population Employed in Farming, Fishing & Forestry in the United States?
Percentage of Population Employed in Farming, Fishing & Forestry in the United States is 0.61%.