Zip Codes with the Highest Percentage of Households With Two or more Vehicles in Barton, VT
RELATED REPORTS & OPTIONS
Households with 2 or more Cars
Barton
Compare Zip Codes
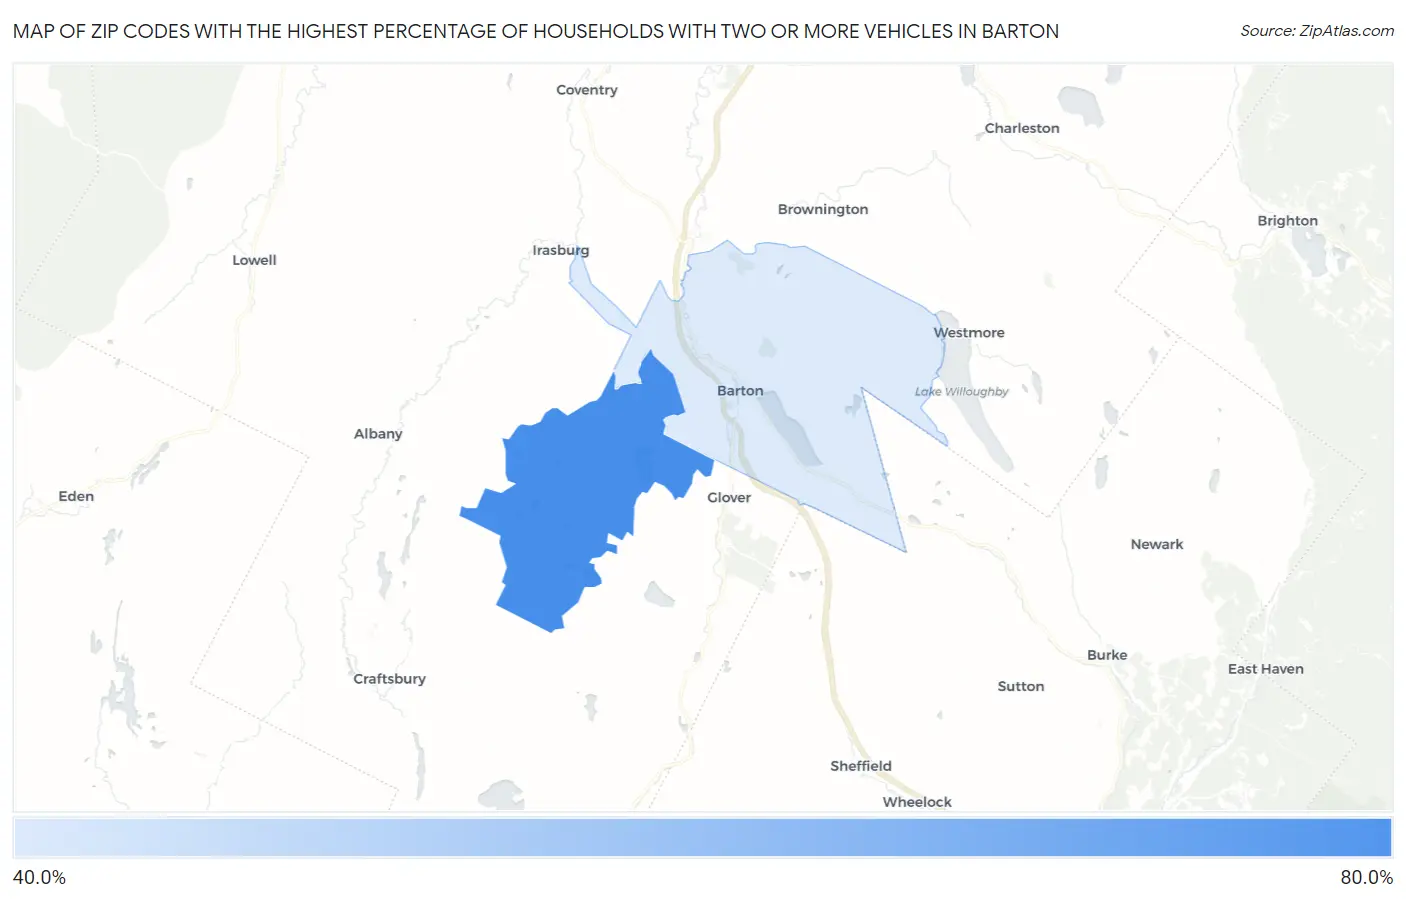
Map of Zip Codes with the Highest Percentage of Households With Two or more Vehicles in Barton
45.6%
61.4%
Zip Codes with the Highest Percentage of Households With Two or more Vehicles in Barton, VT
| Zip Code | Housholds With 2+ Cars | vs State | vs National | |
| 1. | 05875 | 61.4% | 58.7%(+2.70)#154 | 59.1%(+2.30)#21,633 |
| 2. | 05822 | 45.6% | 58.7%(-13.1)#241 | 59.1%(-13.5)#29,397 |
1
Common Questions
What are the Top Zip Codes with the Highest Percentage of Households With Two or more Vehicles in Barton, VT?
Top Zip Codes with the Highest Percentage of Households With Two or more Vehicles in Barton, VT are:
What zip code has the Highest Percentage of Households With Two or more Vehicles in Barton, VT?
05875 has the Highest Percentage of Households With Two or more Vehicles in Barton, VT with 61.4%.
What is the Percentage of Households With Two or more Vehicles in Barton, VT?
Percentage of Households With Two or more Vehicles in Barton is 35.7%.
What is the Percentage of Households With Two or more Vehicles in Vermont?
Percentage of Households With Two or more Vehicles in Vermont is 58.7%.
What is the Percentage of Households With Two or more Vehicles in the United States?
Percentage of Households With Two or more Vehicles in the United States is 59.1%.