Italian vs Chickasaw No Vehicles in Household
COMPARE
Italian
Chickasaw
No Vehicles in Household
No Vehicles in Household Comparison
Italians
Chickasaw
8.6%
NO VEHICLES IN HOUSEHOLD
99.4/ 100
METRIC RATING
83rd/ 347
METRIC RANK
7.9%
NO VEHICLES IN HOUSEHOLD
99.9/ 100
METRIC RATING
43rd/ 347
METRIC RANK
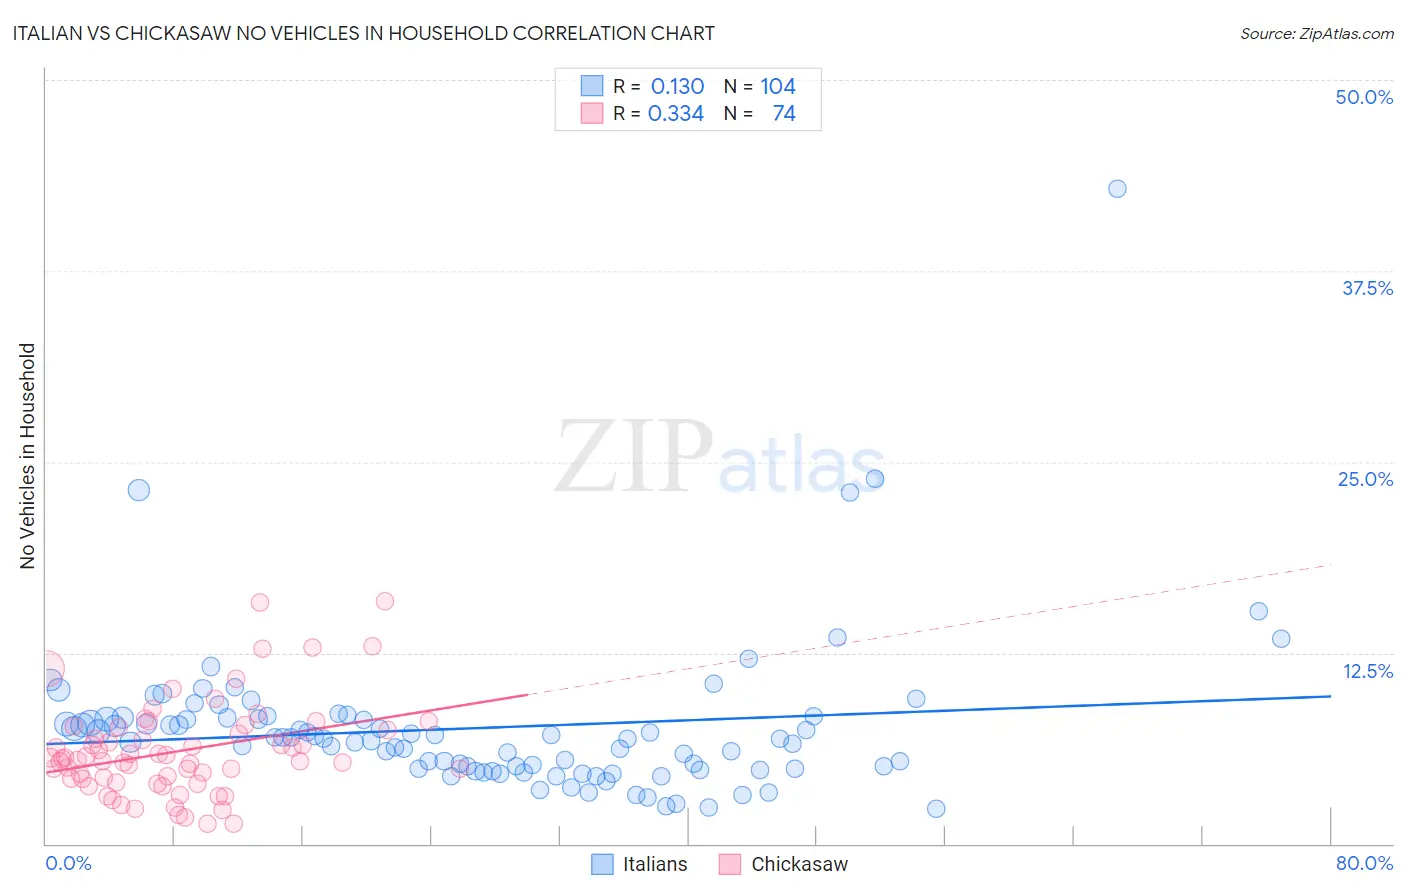
Italian vs Chickasaw No Vehicles in Household Correlation Chart
The statistical analysis conducted on geographies consisting of 569,049,738 people shows a poor positive correlation between the proportion of Italians and percentage of households with no vehicle available in the United States with a correlation coefficient (R) of 0.130 and weighted average of 8.6%. Similarly, the statistical analysis conducted on geographies consisting of 147,505,491 people shows a mild positive correlation between the proportion of Chickasaw and percentage of households with no vehicle available in the United States with a correlation coefficient (R) of 0.334 and weighted average of 7.9%, a difference of 9.8%.
No Vehicles in Household Correlation Summary
| Measurement | Italian | Chickasaw |
| Minimum | 2.3% | 1.3% |
| Maximum | 42.9% | 15.9% |
| Range | 40.6% | 14.6% |
| Mean | 7.6% | 6.1% |
| Median | 6.9% | 5.5% |
| Interquartile 25% (IQ1) | 4.9% | 4.2% |
| Interquartile 75% (IQ3) | 8.2% | 7.4% |
| Interquartile Range (IQR) | 3.3% | 3.2% |
| Standard Deviation (Sample) | 5.1% | 3.1% |
| Standard Deviation (Population) | 5.1% | 3.0% |
Similar Demographics by No Vehicles in Household
Demographics Similar to Italians by No Vehicles in Household
In terms of no vehicles in household, the demographic groups most similar to Italians are Immigrants from Jordan (8.7%, a difference of 0.25%), Lebanese (8.7%, a difference of 0.31%), Immigrants from South Eastern Asia (8.6%, a difference of 0.34%), Bangladeshi (8.7%, a difference of 0.41%), and Tsimshian (8.6%, a difference of 0.47%).
| Demographics | Rating | Rank | No Vehicles in Household |
| Immigrants | Philippines | 99.5 /100 | #76 | Exceptional 8.5% |
| Iranians | 99.5 /100 | #77 | Exceptional 8.6% |
| Immigrants | South Central Asia | 99.5 /100 | #78 | Exceptional 8.6% |
| Portuguese | 99.5 /100 | #79 | Exceptional 8.6% |
| Bolivians | 99.4 /100 | #80 | Exceptional 8.6% |
| Tsimshian | 99.4 /100 | #81 | Exceptional 8.6% |
| Immigrants | South Eastern Asia | 99.4 /100 | #82 | Exceptional 8.6% |
| Italians | 99.4 /100 | #83 | Exceptional 8.6% |
| Immigrants | Jordan | 99.3 /100 | #84 | Exceptional 8.7% |
| Lebanese | 99.3 /100 | #85 | Exceptional 8.7% |
| Bangladeshis | 99.3 /100 | #86 | Exceptional 8.7% |
| Immigrants | England | 99.2 /100 | #87 | Exceptional 8.7% |
| Osage | 99.2 /100 | #88 | Exceptional 8.7% |
| Immigrants | Cuba | 99.2 /100 | #89 | Exceptional 8.7% |
| Bhutanese | 99.2 /100 | #90 | Exceptional 8.7% |
Demographics Similar to Chickasaw by No Vehicles in Household
In terms of no vehicles in household, the demographic groups most similar to Chickasaw are Swiss (7.9%, a difference of 0.080%), French Canadian (7.8%, a difference of 0.21%), Czechoslovakian (7.8%, a difference of 0.36%), Choctaw (7.9%, a difference of 0.36%), and Immigrants from Fiji (7.8%, a difference of 0.46%).
| Demographics | Rating | Rank | No Vehicles in Household |
| Iraqis | 99.9 /100 | #36 | Exceptional 7.7% |
| Basques | 99.9 /100 | #37 | Exceptional 7.8% |
| Creek | 99.9 /100 | #38 | Exceptional 7.8% |
| Immigrants | Fiji | 99.9 /100 | #39 | Exceptional 7.8% |
| Czechoslovakians | 99.9 /100 | #40 | Exceptional 7.8% |
| French Canadians | 99.9 /100 | #41 | Exceptional 7.8% |
| Swiss | 99.9 /100 | #42 | Exceptional 7.9% |
| Chickasaw | 99.9 /100 | #43 | Exceptional 7.9% |
| Choctaw | 99.9 /100 | #44 | Exceptional 7.9% |
| Immigrants | Nonimmigrants | 99.9 /100 | #45 | Exceptional 7.9% |
| Spanish | 99.9 /100 | #46 | Exceptional 7.9% |
| Northern Europeans | 99.9 /100 | #47 | Exceptional 7.9% |
| Afghans | 99.9 /100 | #48 | Exceptional 8.0% |
| Guamanians/Chamorros | 99.9 /100 | #49 | Exceptional 8.0% |
| Belgians | 99.9 /100 | #50 | Exceptional 8.0% |