Italian vs Slovak No Vehicles in Household
COMPARE
Italian
Slovak
No Vehicles in Household
No Vehicles in Household Comparison
Italians
Slovaks
8.6%
NO VEHICLES IN HOUSEHOLD
99.4/ 100
METRIC RATING
83rd/ 347
METRIC RANK
8.3%
NO VEHICLES IN HOUSEHOLD
99.8/ 100
METRIC RATING
63rd/ 347
METRIC RANK
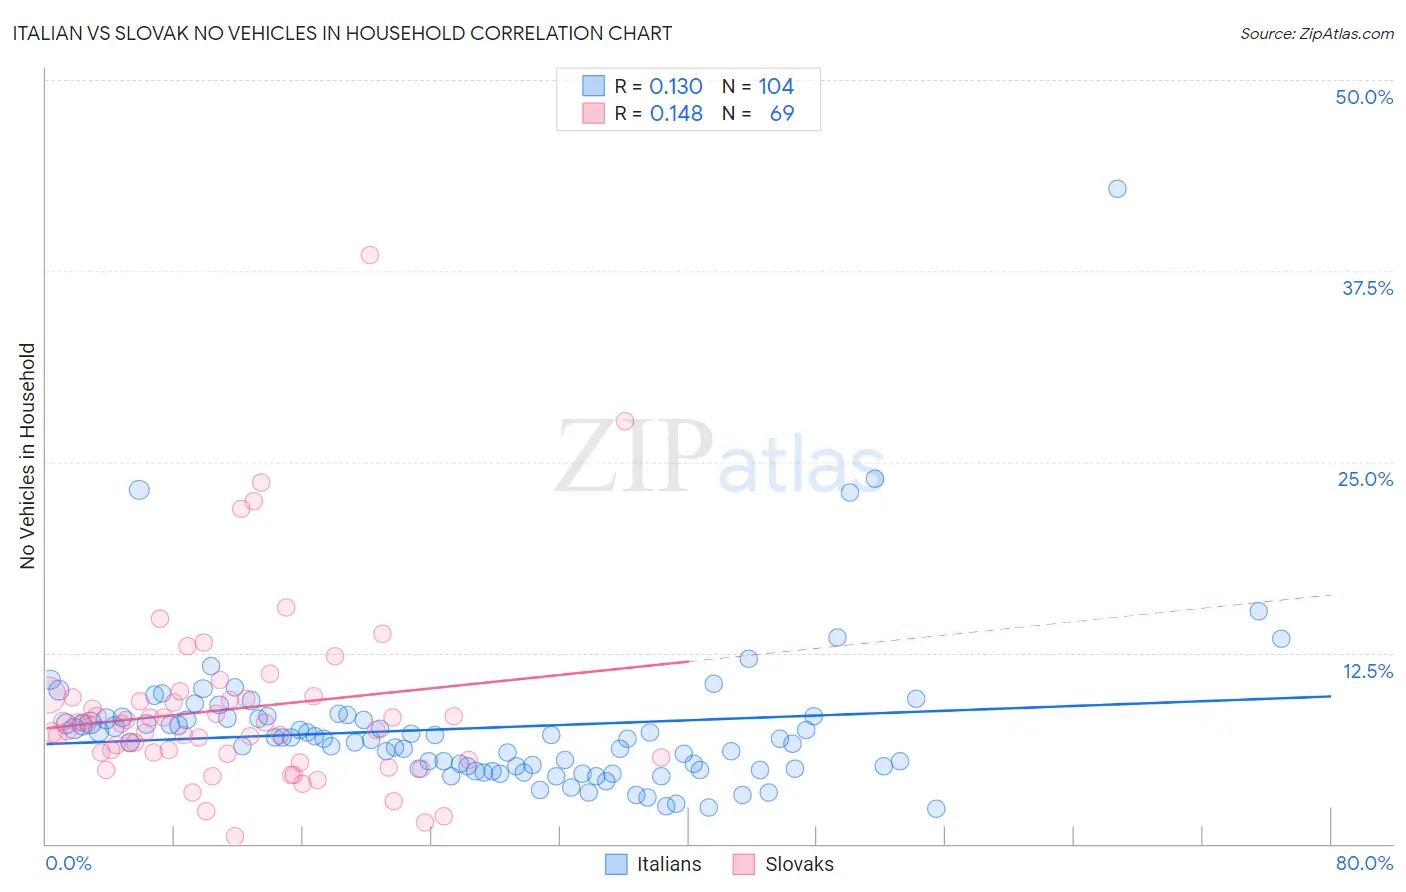
Italian vs Slovak No Vehicles in Household Correlation Chart
The statistical analysis conducted on geographies consisting of 569,049,738 people shows a poor positive correlation between the proportion of Italians and percentage of households with no vehicle available in the United States with a correlation coefficient (R) of 0.130 and weighted average of 8.6%. Similarly, the statistical analysis conducted on geographies consisting of 396,581,417 people shows a poor positive correlation between the proportion of Slovaks and percentage of households with no vehicle available in the United States with a correlation coefficient (R) of 0.148 and weighted average of 8.3%, a difference of 4.6%.
No Vehicles in Household Correlation Summary
| Measurement | Italian | Slovak |
| Minimum | 2.3% | 0.53% |
| Maximum | 42.9% | 38.6% |
| Range | 40.6% | 38.0% |
| Mean | 7.6% | 8.8% |
| Median | 6.9% | 7.8% |
| Interquartile 25% (IQ1) | 4.9% | 5.8% |
| Interquartile 75% (IQ3) | 8.2% | 9.5% |
| Interquartile Range (IQR) | 3.3% | 3.8% |
| Standard Deviation (Sample) | 5.1% | 6.1% |
| Standard Deviation (Population) | 5.1% | 6.1% |
Demographics Similar to Italians and Slovaks by No Vehicles in Household
In terms of no vehicles in household, the demographic groups most similar to Italians are Immigrants from South Eastern Asia (8.6%, a difference of 0.34%), Tsimshian (8.6%, a difference of 0.47%), Bolivian (8.6%, a difference of 0.53%), Portuguese (8.6%, a difference of 0.67%), and Immigrants from South Central Asia (8.6%, a difference of 0.73%). Similarly, the demographic groups most similar to Slovaks are Croatian (8.3%, a difference of 0.090%), Canadian (8.3%, a difference of 0.84%), Palestinian (8.3%, a difference of 0.95%), Immigrants from Scotland (8.3%, a difference of 0.96%), and Immigrants from Iran (8.4%, a difference of 1.4%).
| Demographics | Rating | Rank | No Vehicles in Household |
| Slovaks | 99.8 /100 | #63 | Exceptional 8.3% |
| Croatians | 99.8 /100 | #64 | Exceptional 8.3% |
| Canadians | 99.7 /100 | #65 | Exceptional 8.3% |
| Palestinians | 99.7 /100 | #66 | Exceptional 8.3% |
| Immigrants | Scotland | 99.7 /100 | #67 | Exceptional 8.3% |
| Immigrants | Iran | 99.7 /100 | #68 | Exceptional 8.4% |
| Spaniards | 99.7 /100 | #69 | Exceptional 8.4% |
| Cajuns | 99.6 /100 | #70 | Exceptional 8.4% |
| Immigrants | Lebanon | 99.6 /100 | #71 | Exceptional 8.4% |
| Lithuanians | 99.6 /100 | #72 | Exceptional 8.4% |
| Poles | 99.6 /100 | #73 | Exceptional 8.4% |
| Cubans | 99.5 /100 | #74 | Exceptional 8.5% |
| Jordanians | 99.5 /100 | #75 | Exceptional 8.5% |
| Immigrants | Philippines | 99.5 /100 | #76 | Exceptional 8.5% |
| Iranians | 99.5 /100 | #77 | Exceptional 8.6% |
| Immigrants | South Central Asia | 99.5 /100 | #78 | Exceptional 8.6% |
| Portuguese | 99.5 /100 | #79 | Exceptional 8.6% |
| Bolivians | 99.4 /100 | #80 | Exceptional 8.6% |
| Tsimshian | 99.4 /100 | #81 | Exceptional 8.6% |
| Immigrants | South Eastern Asia | 99.4 /100 | #82 | Exceptional 8.6% |
| Italians | 99.4 /100 | #83 | Exceptional 8.6% |