Italian vs Spanish American No Vehicles in Household
COMPARE
Italian
Spanish American
No Vehicles in Household
No Vehicles in Household Comparison
Italians
Spanish Americans
8.6%
NO VEHICLES IN HOUSEHOLD
99.4/ 100
METRIC RATING
83rd/ 347
METRIC RANK
9.1%
NO VEHICLES IN HOUSEHOLD
97.9/ 100
METRIC RATING
105th/ 347
METRIC RANK
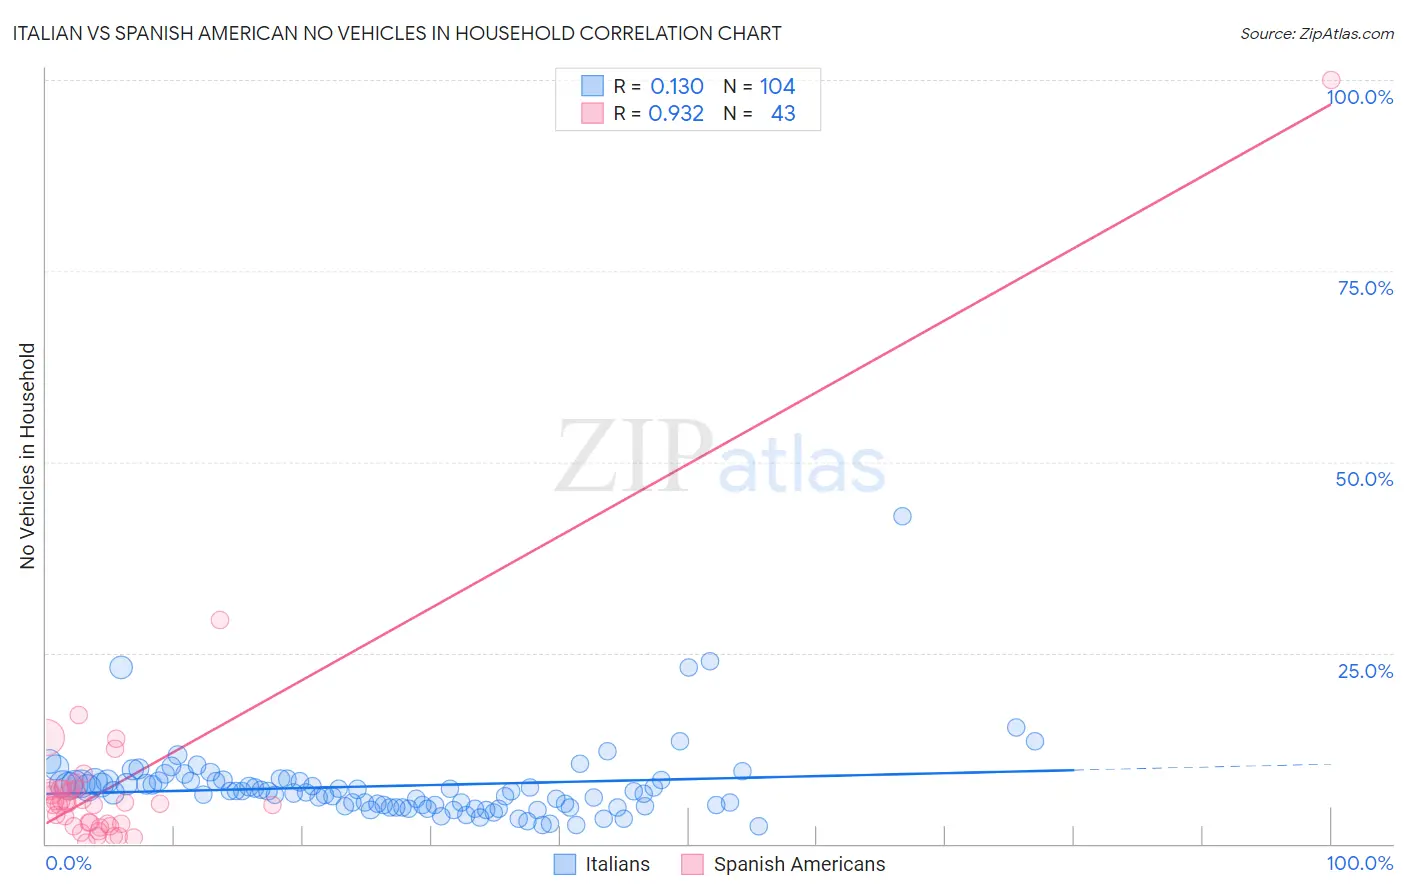
Italian vs Spanish American No Vehicles in Household Correlation Chart
The statistical analysis conducted on geographies consisting of 569,049,738 people shows a poor positive correlation between the proportion of Italians and percentage of households with no vehicle available in the United States with a correlation coefficient (R) of 0.130 and weighted average of 8.6%. Similarly, the statistical analysis conducted on geographies consisting of 103,117,894 people shows a near-perfect positive correlation between the proportion of Spanish Americans and percentage of households with no vehicle available in the United States with a correlation coefficient (R) of 0.932 and weighted average of 9.1%, a difference of 4.9%.
No Vehicles in Household Correlation Summary
| Measurement | Italian | Spanish American |
| Minimum | 2.3% | 0.089% |
| Maximum | 42.9% | 100.0% |
| Range | 40.6% | 99.9% |
| Mean | 7.6% | 8.1% |
| Median | 6.9% | 5.3% |
| Interquartile 25% (IQ1) | 4.9% | 2.6% |
| Interquartile 75% (IQ3) | 8.2% | 7.1% |
| Interquartile Range (IQR) | 3.3% | 4.6% |
| Standard Deviation (Sample) | 5.1% | 15.2% |
| Standard Deviation (Population) | 5.1% | 15.1% |
Similar Demographics by No Vehicles in Household
Demographics Similar to Italians by No Vehicles in Household
In terms of no vehicles in household, the demographic groups most similar to Italians are Immigrants from Jordan (8.7%, a difference of 0.25%), Lebanese (8.7%, a difference of 0.31%), Immigrants from South Eastern Asia (8.6%, a difference of 0.34%), Bangladeshi (8.7%, a difference of 0.41%), and Tsimshian (8.6%, a difference of 0.47%).
| Demographics | Rating | Rank | No Vehicles in Household |
| Immigrants | Philippines | 99.5 /100 | #76 | Exceptional 8.5% |
| Iranians | 99.5 /100 | #77 | Exceptional 8.6% |
| Immigrants | South Central Asia | 99.5 /100 | #78 | Exceptional 8.6% |
| Portuguese | 99.5 /100 | #79 | Exceptional 8.6% |
| Bolivians | 99.4 /100 | #80 | Exceptional 8.6% |
| Tsimshian | 99.4 /100 | #81 | Exceptional 8.6% |
| Immigrants | South Eastern Asia | 99.4 /100 | #82 | Exceptional 8.6% |
| Italians | 99.4 /100 | #83 | Exceptional 8.6% |
| Immigrants | Jordan | 99.3 /100 | #84 | Exceptional 8.7% |
| Lebanese | 99.3 /100 | #85 | Exceptional 8.7% |
| Bangladeshis | 99.3 /100 | #86 | Exceptional 8.7% |
| Immigrants | England | 99.2 /100 | #87 | Exceptional 8.7% |
| Osage | 99.2 /100 | #88 | Exceptional 8.7% |
| Immigrants | Cuba | 99.2 /100 | #89 | Exceptional 8.7% |
| Bhutanese | 99.2 /100 | #90 | Exceptional 8.7% |
Demographics Similar to Spanish Americans by No Vehicles in Household
In terms of no vehicles in household, the demographic groups most similar to Spanish Americans are Laotian (9.1%, a difference of 0.090%), Zimbabwean (9.0%, a difference of 0.16%), Hispanic or Latino (9.1%, a difference of 0.36%), Mexican American Indian (9.1%, a difference of 0.44%), and Maltese (9.1%, a difference of 0.57%).
| Demographics | Rating | Rank | No Vehicles in Household |
| Slavs | 98.4 /100 | #98 | Exceptional 9.0% |
| Bulgarians | 98.4 /100 | #99 | Exceptional 9.0% |
| Asians | 98.3 /100 | #100 | Exceptional 9.0% |
| Pakistanis | 98.3 /100 | #101 | Exceptional 9.0% |
| Yugoslavians | 98.3 /100 | #102 | Exceptional 9.0% |
| Seminole | 98.3 /100 | #103 | Exceptional 9.0% |
| Zimbabweans | 98.0 /100 | #104 | Exceptional 9.0% |
| Spanish Americans | 97.9 /100 | #105 | Exceptional 9.1% |
| Laotians | 97.8 /100 | #106 | Exceptional 9.1% |
| Hispanics or Latinos | 97.7 /100 | #107 | Exceptional 9.1% |
| Mexican American Indians | 97.6 /100 | #108 | Exceptional 9.1% |
| Maltese | 97.6 /100 | #109 | Exceptional 9.1% |
| Delaware | 97.2 /100 | #110 | Exceptional 9.2% |
| Immigrants | Kuwait | 95.1 /100 | #111 | Exceptional 9.4% |
| Armenians | 95.0 /100 | #112 | Exceptional 9.4% |