Italian vs Palestinian No Vehicles in Household
COMPARE
Italian
Palestinian
No Vehicles in Household
No Vehicles in Household Comparison
Italians
Palestinians
8.6%
NO VEHICLES IN HOUSEHOLD
99.4/ 100
METRIC RATING
83rd/ 347
METRIC RANK
8.3%
NO VEHICLES IN HOUSEHOLD
99.7/ 100
METRIC RATING
66th/ 347
METRIC RANK
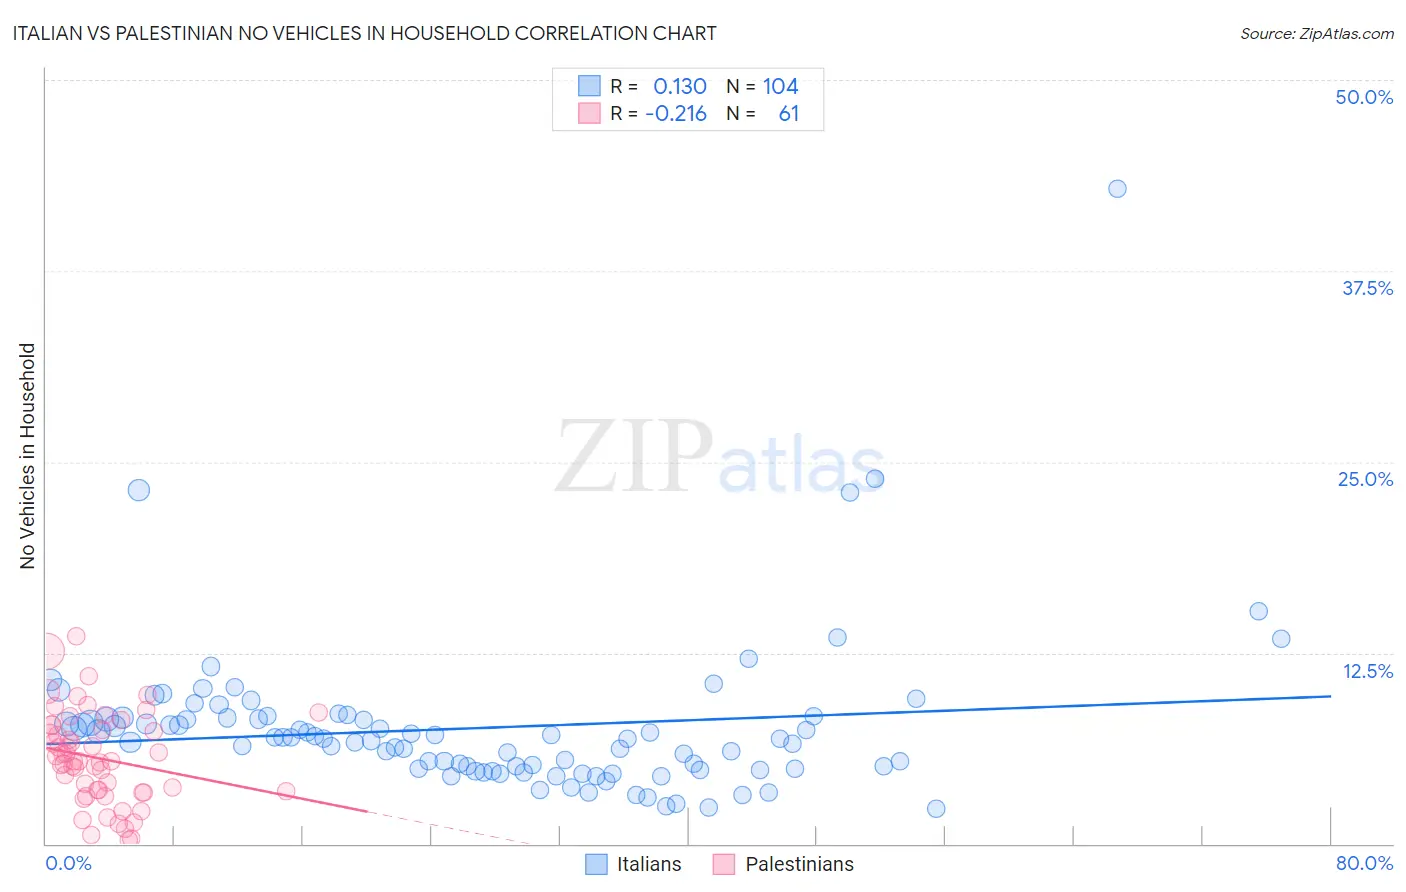
Italian vs Palestinian No Vehicles in Household Correlation Chart
The statistical analysis conducted on geographies consisting of 569,049,738 people shows a poor positive correlation between the proportion of Italians and percentage of households with no vehicle available in the United States with a correlation coefficient (R) of 0.130 and weighted average of 8.6%. Similarly, the statistical analysis conducted on geographies consisting of 216,223,800 people shows a weak negative correlation between the proportion of Palestinians and percentage of households with no vehicle available in the United States with a correlation coefficient (R) of -0.216 and weighted average of 8.3%, a difference of 3.6%.
No Vehicles in Household Correlation Summary
| Measurement | Italian | Palestinian |
| Minimum | 2.3% | 0.29% |
| Maximum | 42.9% | 13.6% |
| Range | 40.6% | 13.3% |
| Mean | 7.6% | 5.6% |
| Median | 6.9% | 5.4% |
| Interquartile 25% (IQ1) | 4.9% | 3.4% |
| Interquartile 75% (IQ3) | 8.2% | 7.6% |
| Interquartile Range (IQR) | 3.3% | 4.2% |
| Standard Deviation (Sample) | 5.1% | 3.0% |
| Standard Deviation (Population) | 5.1% | 3.0% |
Demographics Similar to Italians and Palestinians by No Vehicles in Household
In terms of no vehicles in household, the demographic groups most similar to Italians are Immigrants from Jordan (8.7%, a difference of 0.25%), Immigrants from South Eastern Asia (8.6%, a difference of 0.34%), Tsimshian (8.6%, a difference of 0.47%), Bolivian (8.6%, a difference of 0.53%), and Portuguese (8.6%, a difference of 0.67%). Similarly, the demographic groups most similar to Palestinians are Immigrants from Scotland (8.3%, a difference of 0.010%), Canadian (8.3%, a difference of 0.11%), Immigrants from Iran (8.4%, a difference of 0.41%), Spaniard (8.4%, a difference of 0.46%), and Croatian (8.3%, a difference of 0.86%).
| Demographics | Rating | Rank | No Vehicles in Household |
| Croatians | 99.8 /100 | #64 | Exceptional 8.3% |
| Canadians | 99.7 /100 | #65 | Exceptional 8.3% |
| Palestinians | 99.7 /100 | #66 | Exceptional 8.3% |
| Immigrants | Scotland | 99.7 /100 | #67 | Exceptional 8.3% |
| Immigrants | Iran | 99.7 /100 | #68 | Exceptional 8.4% |
| Spaniards | 99.7 /100 | #69 | Exceptional 8.4% |
| Cajuns | 99.6 /100 | #70 | Exceptional 8.4% |
| Immigrants | Lebanon | 99.6 /100 | #71 | Exceptional 8.4% |
| Lithuanians | 99.6 /100 | #72 | Exceptional 8.4% |
| Poles | 99.6 /100 | #73 | Exceptional 8.4% |
| Cubans | 99.5 /100 | #74 | Exceptional 8.5% |
| Jordanians | 99.5 /100 | #75 | Exceptional 8.5% |
| Immigrants | Philippines | 99.5 /100 | #76 | Exceptional 8.5% |
| Iranians | 99.5 /100 | #77 | Exceptional 8.6% |
| Immigrants | South Central Asia | 99.5 /100 | #78 | Exceptional 8.6% |
| Portuguese | 99.5 /100 | #79 | Exceptional 8.6% |
| Bolivians | 99.4 /100 | #80 | Exceptional 8.6% |
| Tsimshian | 99.4 /100 | #81 | Exceptional 8.6% |
| Immigrants | South Eastern Asia | 99.4 /100 | #82 | Exceptional 8.6% |
| Italians | 99.4 /100 | #83 | Exceptional 8.6% |
| Immigrants | Jordan | 99.3 /100 | #84 | Exceptional 8.7% |