Hawaiian vs Indian (Asian) 3 or more Vehicles in Household
COMPARE
Hawaiian
Indian (Asian)
3 or more Vehicles in Household
3 or more Vehicles in Household Comparison
Hawaiians
Indians (Asian)
24.3%
3 OR MORE VEHICLES IN HOUSEHOLD
100.0/ 100
METRIC RATING
15th/ 347
METRIC RANK
19.1%
3 OR MORE VEHICLES IN HOUSEHOLD
26.0/ 100
METRIC RATING
189th/ 347
METRIC RANK
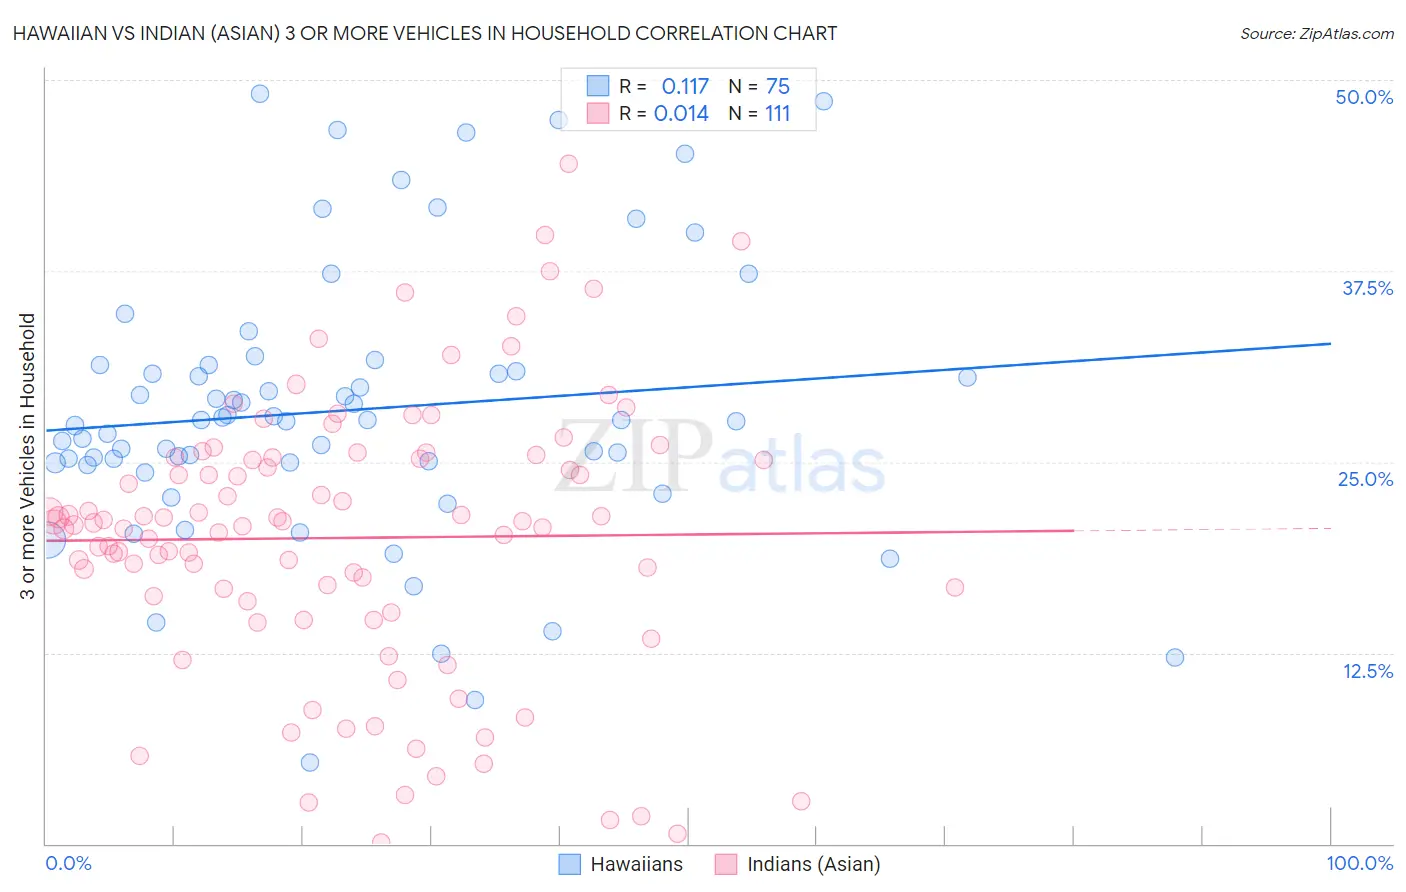
Hawaiian vs Indian (Asian) 3 or more Vehicles in Household Correlation Chart
The statistical analysis conducted on geographies consisting of 327,356,471 people shows a poor positive correlation between the proportion of Hawaiians and percentage of households with 3 or more vehicles available in the United States with a correlation coefficient (R) of 0.117 and weighted average of 24.3%. Similarly, the statistical analysis conducted on geographies consisting of 494,546,924 people shows no correlation between the proportion of Indians (Asian) and percentage of households with 3 or more vehicles available in the United States with a correlation coefficient (R) of 0.014 and weighted average of 19.1%, a difference of 26.9%.
3 or more Vehicles in Household Correlation Summary
| Measurement | Hawaiian | Indian (Asian) |
| Minimum | 5.3% | 0.12% |
| Maximum | 49.1% | 44.5% |
| Range | 43.8% | 44.4% |
| Mean | 28.4% | 20.0% |
| Median | 27.7% | 21.0% |
| Interquartile 25% (IQ1) | 24.9% | 15.9% |
| Interquartile 75% (IQ3) | 31.3% | 25.3% |
| Interquartile Range (IQR) | 6.4% | 9.4% |
| Standard Deviation (Sample) | 9.0% | 8.9% |
| Standard Deviation (Population) | 8.9% | 8.9% |
Similar Demographics by 3 or more Vehicles in Household
Demographics Similar to Hawaiians by 3 or more Vehicles in Household
In terms of 3 or more vehicles in household, the demographic groups most similar to Hawaiians are Basque (24.3%, a difference of 0.030%), Korean (24.1%, a difference of 0.83%), Immigrants from Mexico (24.6%, a difference of 1.4%), Norwegian (23.9%, a difference of 1.6%), and Chinese (23.9%, a difference of 1.7%).
| Demographics | Rating | Rank | 3 or more Vehicles in Household |
| Samoans | 100.0 /100 | #8 | Exceptional 25.0% |
| Native Hawaiians | 100.0 /100 | #9 | Exceptional 24.9% |
| Nepalese | 100.0 /100 | #10 | Exceptional 24.9% |
| Shoshone | 100.0 /100 | #11 | Exceptional 24.9% |
| Danes | 100.0 /100 | #12 | Exceptional 24.7% |
| Mexicans | 100.0 /100 | #13 | Exceptional 24.7% |
| Immigrants | Mexico | 100.0 /100 | #14 | Exceptional 24.6% |
| Hawaiians | 100.0 /100 | #15 | Exceptional 24.3% |
| Basques | 100.0 /100 | #16 | Exceptional 24.3% |
| Koreans | 100.0 /100 | #17 | Exceptional 24.1% |
| Norwegians | 100.0 /100 | #18 | Exceptional 23.9% |
| Chinese | 100.0 /100 | #19 | Exceptional 23.9% |
| Paiute | 100.0 /100 | #20 | Exceptional 23.8% |
| Immigrants | Vietnam | 100.0 /100 | #21 | Exceptional 23.8% |
| Immigrants | Philippines | 100.0 /100 | #22 | Exceptional 23.8% |
Demographics Similar to Indians (Asian) by 3 or more Vehicles in Household
In terms of 3 or more vehicles in household, the demographic groups most similar to Indians (Asian) are Immigrants from Kuwait (19.1%, a difference of 0.010%), Immigrants from Zimbabwe (19.1%, a difference of 0.050%), South American Indian (19.1%, a difference of 0.070%), Kenyan (19.1%, a difference of 0.13%), and Tsimshian (19.1%, a difference of 0.16%).
| Demographics | Rating | Rank | 3 or more Vehicles in Household |
| Cubans | 36.6 /100 | #182 | Fair 19.3% |
| Cajuns | 36.0 /100 | #183 | Fair 19.3% |
| Latvians | 35.7 /100 | #184 | Fair 19.3% |
| Immigrants | Sri Lanka | 30.7 /100 | #185 | Fair 19.2% |
| Immigrants | Sweden | 29.0 /100 | #186 | Fair 19.2% |
| Immigrants | Hong Kong | 28.3 /100 | #187 | Fair 19.2% |
| Immigrants | Kuwait | 26.1 /100 | #188 | Fair 19.1% |
| Indians (Asian) | 26.0 /100 | #189 | Fair 19.1% |
| Immigrants | Zimbabwe | 25.5 /100 | #190 | Fair 19.1% |
| South American Indians | 25.4 /100 | #191 | Fair 19.1% |
| Kenyans | 24.7 /100 | #192 | Fair 19.1% |
| Tsimshian | 24.4 /100 | #193 | Fair 19.1% |
| Serbians | 24.0 /100 | #194 | Fair 19.1% |
| Immigrants | Moldova | 23.6 /100 | #195 | Fair 19.1% |
| Central American Indians | 22.2 /100 | #196 | Fair 19.0% |