Navajo vs Indian (Asian) 3 or more Vehicles in Household
COMPARE
Navajo
Indian (Asian)
3 or more Vehicles in Household
3 or more Vehicles in Household Comparison
Navajo
Indians (Asian)
22.3%
3 OR MORE VEHICLES IN HOUSEHOLD
100.0/ 100
METRIC RATING
59th/ 347
METRIC RANK
19.1%
3 OR MORE VEHICLES IN HOUSEHOLD
26.0/ 100
METRIC RATING
189th/ 347
METRIC RANK
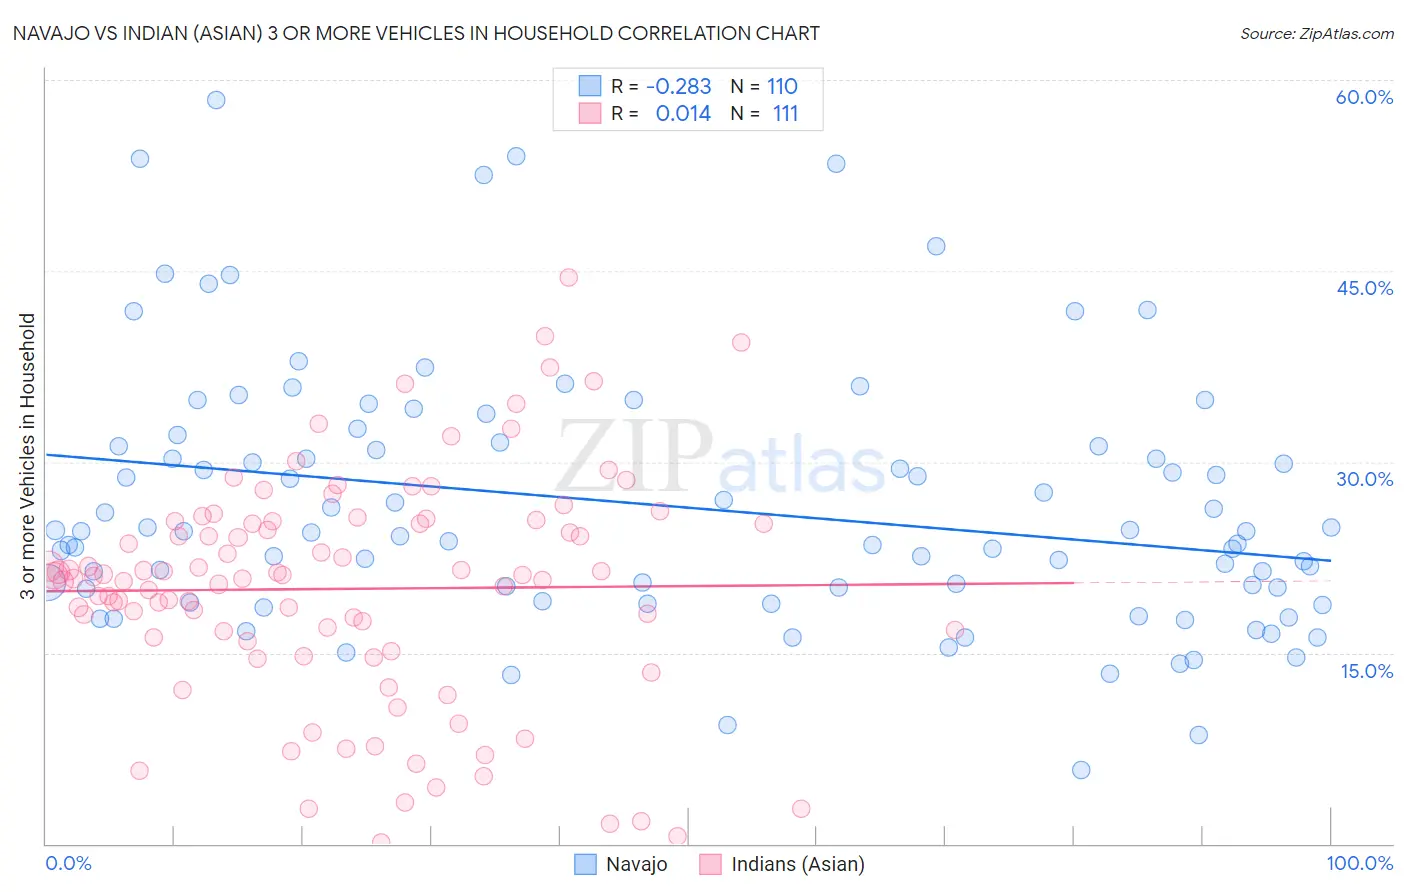
Navajo vs Indian (Asian) 3 or more Vehicles in Household Correlation Chart
The statistical analysis conducted on geographies consisting of 224,733,620 people shows a weak negative correlation between the proportion of Navajo and percentage of households with 3 or more vehicles available in the United States with a correlation coefficient (R) of -0.283 and weighted average of 22.3%. Similarly, the statistical analysis conducted on geographies consisting of 494,546,924 people shows no correlation between the proportion of Indians (Asian) and percentage of households with 3 or more vehicles available in the United States with a correlation coefficient (R) of 0.014 and weighted average of 19.1%, a difference of 16.7%.
3 or more Vehicles in Household Correlation Summary
| Measurement | Navajo | Indian (Asian) |
| Minimum | 5.8% | 0.12% |
| Maximum | 58.5% | 44.5% |
| Range | 52.7% | 44.4% |
| Mean | 26.6% | 20.0% |
| Median | 24.5% | 21.0% |
| Interquartile 25% (IQ1) | 20.0% | 15.9% |
| Interquartile 75% (IQ3) | 31.2% | 25.3% |
| Interquartile Range (IQR) | 11.2% | 9.4% |
| Standard Deviation (Sample) | 10.2% | 8.9% |
| Standard Deviation (Population) | 10.1% | 8.9% |
Similar Demographics by 3 or more Vehicles in Household
Demographics Similar to Navajo by 3 or more Vehicles in Household
In terms of 3 or more vehicles in household, the demographic groups most similar to Navajo are Spaniard (22.3%, a difference of 0.060%), Finnish (22.3%, a difference of 0.090%), Pennsylvania German (22.3%, a difference of 0.19%), Bhutanese (22.2%, a difference of 0.24%), and Fijian (22.2%, a difference of 0.28%).
| Demographics | Rating | Rank | 3 or more Vehicles in Household |
| Welsh | 100.0 /100 | #52 | Exceptional 22.6% |
| Czechs | 100.0 /100 | #53 | Exceptional 22.5% |
| Crow | 100.0 /100 | #54 | Exceptional 22.5% |
| Immigrants | Laos | 100.0 /100 | #55 | Exceptional 22.4% |
| Hispanics or Latinos | 100.0 /100 | #56 | Exceptional 22.4% |
| Pennsylvania Germans | 100.0 /100 | #57 | Exceptional 22.3% |
| Spaniards | 100.0 /100 | #58 | Exceptional 22.3% |
| Navajo | 100.0 /100 | #59 | Exceptional 22.3% |
| Finns | 99.9 /100 | #60 | Exceptional 22.3% |
| Bhutanese | 99.9 /100 | #61 | Exceptional 22.2% |
| Fijians | 99.9 /100 | #62 | Exceptional 22.2% |
| Chickasaw | 99.9 /100 | #63 | Exceptional 22.2% |
| Immigrants | Taiwan | 99.9 /100 | #64 | Exceptional 22.1% |
| Pima | 99.9 /100 | #65 | Exceptional 22.0% |
| Northern Europeans | 99.9 /100 | #66 | Exceptional 22.0% |
Demographics Similar to Indians (Asian) by 3 or more Vehicles in Household
In terms of 3 or more vehicles in household, the demographic groups most similar to Indians (Asian) are Immigrants from Kuwait (19.1%, a difference of 0.010%), Immigrants from Zimbabwe (19.1%, a difference of 0.050%), South American Indian (19.1%, a difference of 0.070%), Kenyan (19.1%, a difference of 0.13%), and Tsimshian (19.1%, a difference of 0.16%).
| Demographics | Rating | Rank | 3 or more Vehicles in Household |
| Cubans | 36.6 /100 | #182 | Fair 19.3% |
| Cajuns | 36.0 /100 | #183 | Fair 19.3% |
| Latvians | 35.7 /100 | #184 | Fair 19.3% |
| Immigrants | Sri Lanka | 30.7 /100 | #185 | Fair 19.2% |
| Immigrants | Sweden | 29.0 /100 | #186 | Fair 19.2% |
| Immigrants | Hong Kong | 28.3 /100 | #187 | Fair 19.2% |
| Immigrants | Kuwait | 26.1 /100 | #188 | Fair 19.1% |
| Indians (Asian) | 26.0 /100 | #189 | Fair 19.1% |
| Immigrants | Zimbabwe | 25.5 /100 | #190 | Fair 19.1% |
| South American Indians | 25.4 /100 | #191 | Fair 19.1% |
| Kenyans | 24.7 /100 | #192 | Fair 19.1% |
| Tsimshian | 24.4 /100 | #193 | Fair 19.1% |
| Serbians | 24.0 /100 | #194 | Fair 19.1% |
| Immigrants | Moldova | 23.6 /100 | #195 | Fair 19.1% |
| Central American Indians | 22.2 /100 | #196 | Fair 19.0% |