Israeli vs Carpatho Rusyn 3 or more Vehicles in Household
COMPARE
Israeli
Carpatho Rusyn
3 or more Vehicles in Household
3 or more Vehicles in Household Comparison
Israelis
Carpatho Rusyns
16.8%
3 OR MORE VEHICLES IN HOUSEHOLD
0.1/ 100
METRIC RATING
297th/ 347
METRIC RANK
18.0%
3 OR MORE VEHICLES IN HOUSEHOLD
1.9/ 100
METRIC RATING
247th/ 347
METRIC RANK
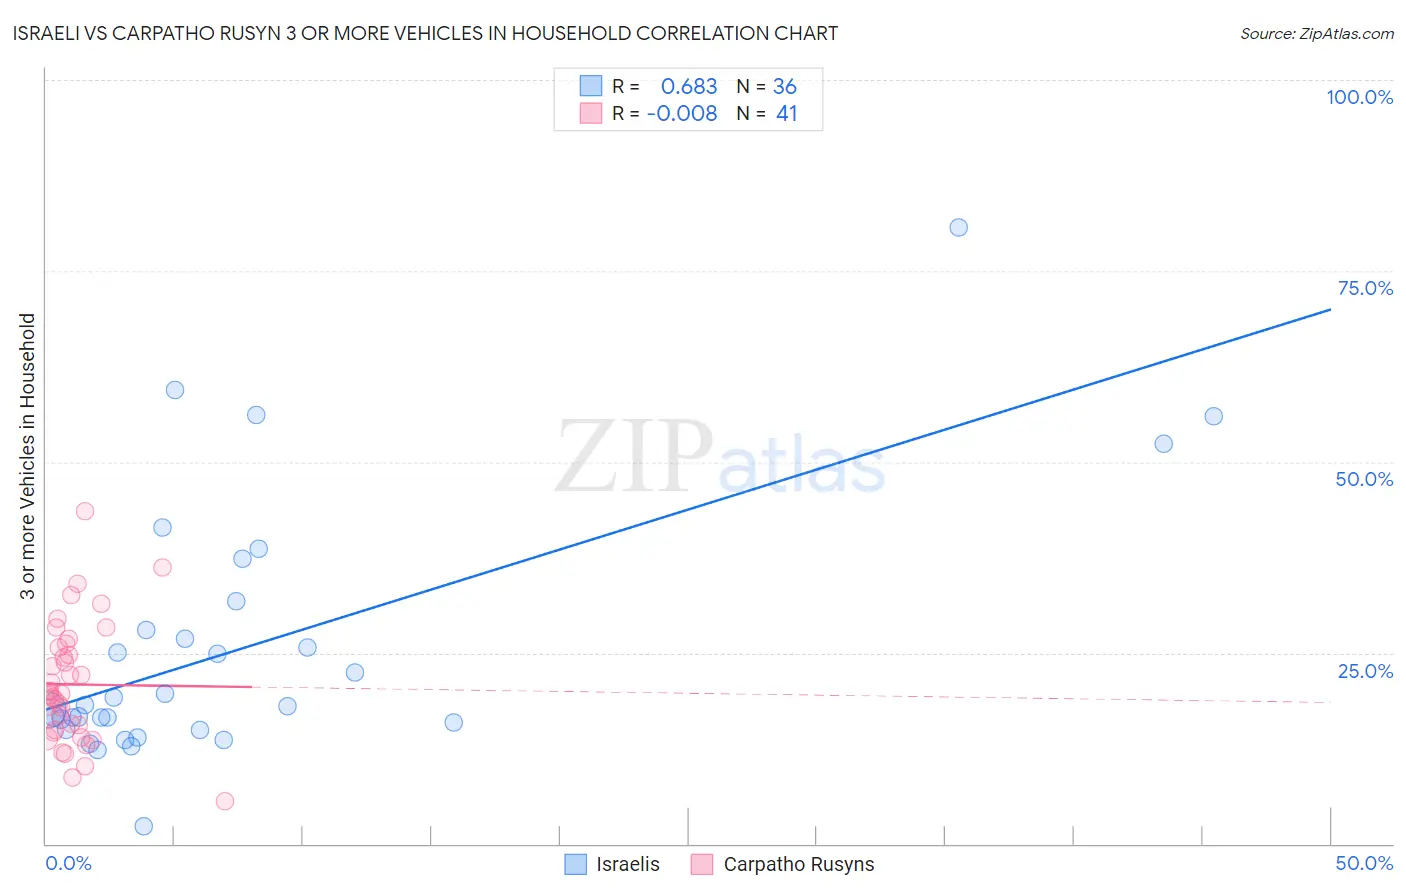
Israeli vs Carpatho Rusyn 3 or more Vehicles in Household Correlation Chart
The statistical analysis conducted on geographies consisting of 210,927,283 people shows a significant positive correlation between the proportion of Israelis and percentage of households with 3 or more vehicles available in the United States with a correlation coefficient (R) of 0.683 and weighted average of 16.8%. Similarly, the statistical analysis conducted on geographies consisting of 58,865,227 people shows no correlation between the proportion of Carpatho Rusyns and percentage of households with 3 or more vehicles available in the United States with a correlation coefficient (R) of -0.008 and weighted average of 18.0%, a difference of 7.6%.
3 or more Vehicles in Household Correlation Summary
| Measurement | Israeli | Carpatho Rusyn |
| Minimum | 2.3% | 5.5% |
| Maximum | 80.8% | 43.5% |
| Range | 78.4% | 38.0% |
| Mean | 25.7% | 20.9% |
| Median | 18.1% | 19.7% |
| Interquartile 25% (IQ1) | 15.5% | 14.7% |
| Interquartile 75% (IQ3) | 29.9% | 26.0% |
| Interquartile Range (IQR) | 14.4% | 11.3% |
| Standard Deviation (Sample) | 16.8% | 8.0% |
| Standard Deviation (Population) | 16.6% | 7.9% |
Similar Demographics by 3 or more Vehicles in Household
Demographics Similar to Israelis by 3 or more Vehicles in Household
In terms of 3 or more vehicles in household, the demographic groups most similar to Israelis are Immigrants from Zaire (16.7%, a difference of 0.37%), Immigrants from South America (16.7%, a difference of 0.43%), Inupiat (16.9%, a difference of 0.47%), Immigrants from Russia (16.9%, a difference of 0.83%), and Immigrants from Western Africa (16.9%, a difference of 0.88%).
| Demographics | Rating | Rank | 3 or more Vehicles in Household |
| Liberians | 0.1 /100 | #290 | Tragic 17.0% |
| Immigrants | Congo | 0.1 /100 | #291 | Tragic 17.0% |
| Immigrants | Spain | 0.1 /100 | #292 | Tragic 17.0% |
| Bahamians | 0.1 /100 | #293 | Tragic 16.9% |
| Immigrants | Western Africa | 0.1 /100 | #294 | Tragic 16.9% |
| Immigrants | Russia | 0.1 /100 | #295 | Tragic 16.9% |
| Inupiat | 0.1 /100 | #296 | Tragic 16.9% |
| Israelis | 0.1 /100 | #297 | Tragic 16.8% |
| Immigrants | Zaire | 0.1 /100 | #298 | Tragic 16.7% |
| Immigrants | South America | 0.1 /100 | #299 | Tragic 16.7% |
| Cypriots | 0.0 /100 | #300 | Tragic 16.6% |
| Paraguayans | 0.0 /100 | #301 | Tragic 16.6% |
| Immigrants | Greece | 0.0 /100 | #302 | Tragic 16.5% |
| Immigrants | Serbia | 0.0 /100 | #303 | Tragic 16.4% |
| Ghanaians | 0.0 /100 | #304 | Tragic 16.4% |
Demographics Similar to Carpatho Rusyns by 3 or more Vehicles in Household
In terms of 3 or more vehicles in household, the demographic groups most similar to Carpatho Rusyns are Immigrants from Eastern Africa (18.0%, a difference of 0.13%), Immigrants from Australia (18.1%, a difference of 0.16%), Immigrants from Saudi Arabia (18.0%, a difference of 0.19%), Venezuelan (18.0%, a difference of 0.21%), and Immigrants from Belize (18.1%, a difference of 0.23%).
| Demographics | Rating | Rank | 3 or more Vehicles in Household |
| Immigrants | China | 2.9 /100 | #240 | Tragic 18.2% |
| Africans | 2.7 /100 | #241 | Tragic 18.2% |
| Hopi | 2.5 /100 | #242 | Tragic 18.2% |
| Immigrants | Europe | 2.4 /100 | #243 | Tragic 18.1% |
| Mongolians | 2.3 /100 | #244 | Tragic 18.1% |
| Immigrants | Belize | 2.1 /100 | #245 | Tragic 18.1% |
| Immigrants | Australia | 2.0 /100 | #246 | Tragic 18.1% |
| Carpatho Rusyns | 1.9 /100 | #247 | Tragic 18.0% |
| Immigrants | Eastern Africa | 1.8 /100 | #248 | Tragic 18.0% |
| Immigrants | Saudi Arabia | 1.7 /100 | #249 | Tragic 18.0% |
| Venezuelans | 1.7 /100 | #250 | Tragic 18.0% |
| Alsatians | 1.5 /100 | #251 | Tragic 18.0% |
| Immigrants | Southern Europe | 1.4 /100 | #252 | Tragic 17.9% |
| Immigrants | Ethiopia | 1.3 /100 | #253 | Tragic 17.9% |
| Ethiopians | 1.2 /100 | #254 | Tragic 17.9% |