Zip Codes with the Highest Percentage of Population Employed in Health Diagnosing & Treating in Sterling, VA
RELATED REPORTS & OPTIONS
Health Diagnosing & Treating
Sterling
Compare Zip Codes
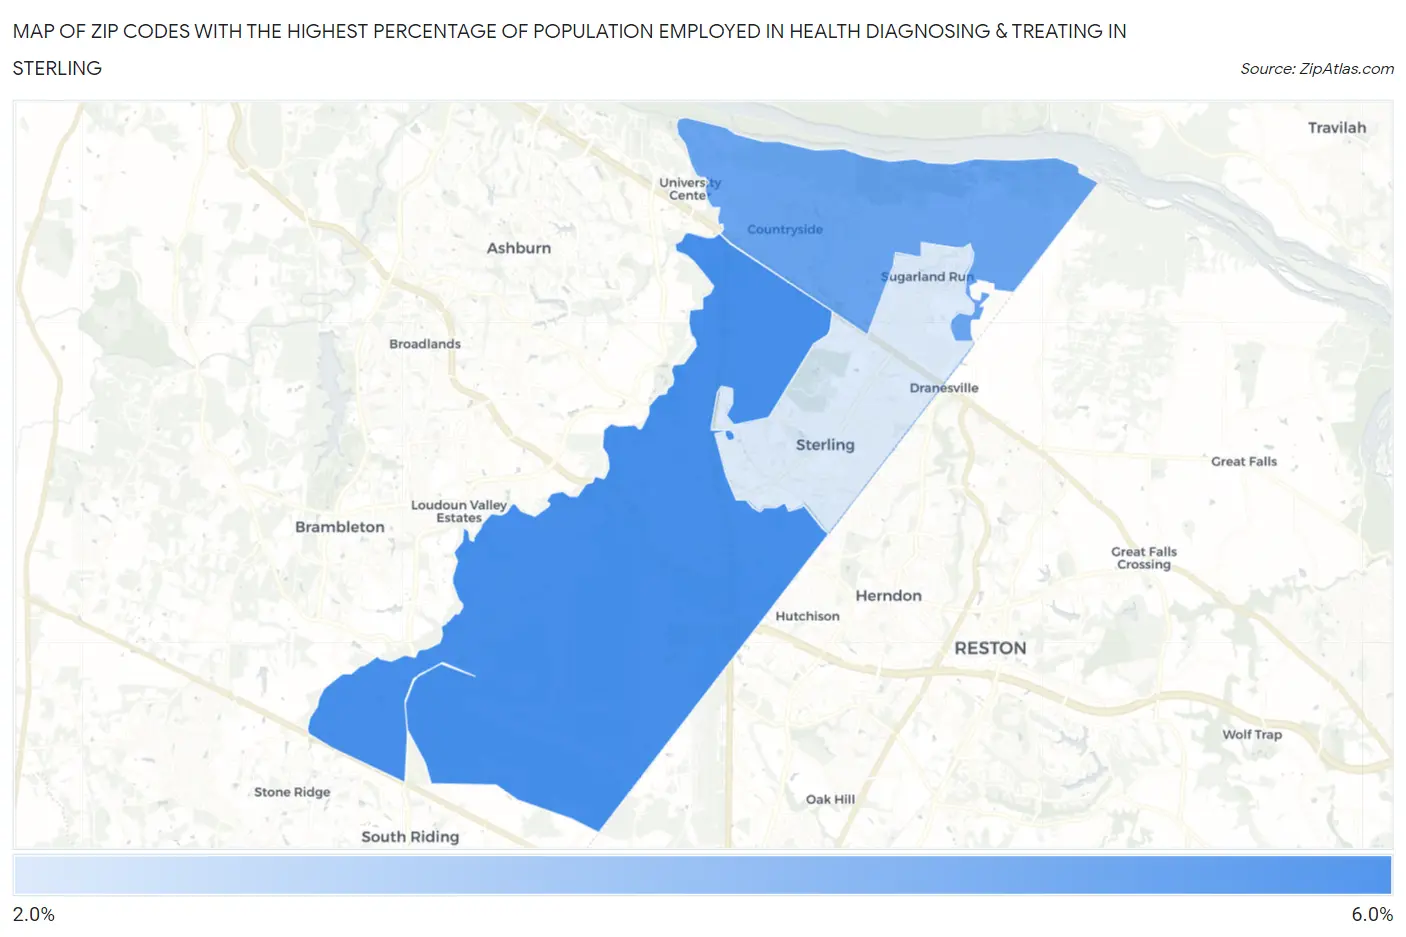
Map of Zip Codes with the Highest Percentage of Population Employed in Health Diagnosing & Treating in Sterling
2.6%
5.5%
Zip Codes with the Highest Percentage of Population Employed in Health Diagnosing & Treating in Sterling, VA
| Zip Code | % Employed | vs State | vs National | |
| 1. | 20166 | 5.5% | 5.7%(-0.112)#368 | 6.2%(-0.700)#15,614 |
| 2. | 20165 | 4.9% | 5.7%(-0.796)#437 | 6.2%(-1.38)#18,243 |
| 3. | 20164 | 2.6% | 5.7%(-3.01)#649 | 6.2%(-3.60)#25,155 |
1
Common Questions
What are the Top Zip Codes with the Highest Percentage of Population Employed in Health Diagnosing & Treating in Sterling, VA?
Top Zip Codes with the Highest Percentage of Population Employed in Health Diagnosing & Treating in Sterling, VA are:
What zip code has the Highest Percentage of Population Employed in Health Diagnosing & Treating in Sterling, VA?
20166 has the Highest Percentage of Population Employed in Health Diagnosing & Treating in Sterling, VA with 5.5%.
What is the Percentage of Population Employed in Health Diagnosing & Treating in Sterling, VA?
Percentage of Population Employed in Health Diagnosing & Treating in Sterling is 3.2%.
What is the Percentage of Population Employed in Health Diagnosing & Treating in Virginia?
Percentage of Population Employed in Health Diagnosing & Treating in Virginia is 5.7%.
What is the Percentage of Population Employed in Health Diagnosing & Treating in the United States?
Percentage of Population Employed in Health Diagnosing & Treating in the United States is 6.2%.