Tlingit-Haida vs Immigrants from Netherlands Male Unemployment
COMPARE
Tlingit-Haida
Immigrants from Netherlands
Male Unemployment
Male Unemployment Comparison
Tlingit-Haida
Immigrants from Netherlands
6.0%
MALE UNEMPLOYMENT
0.0/ 100
METRIC RATING
276th/ 347
METRIC RANK
5.0%
MALE UNEMPLOYMENT
98.3/ 100
METRIC RATING
59th/ 347
METRIC RANK
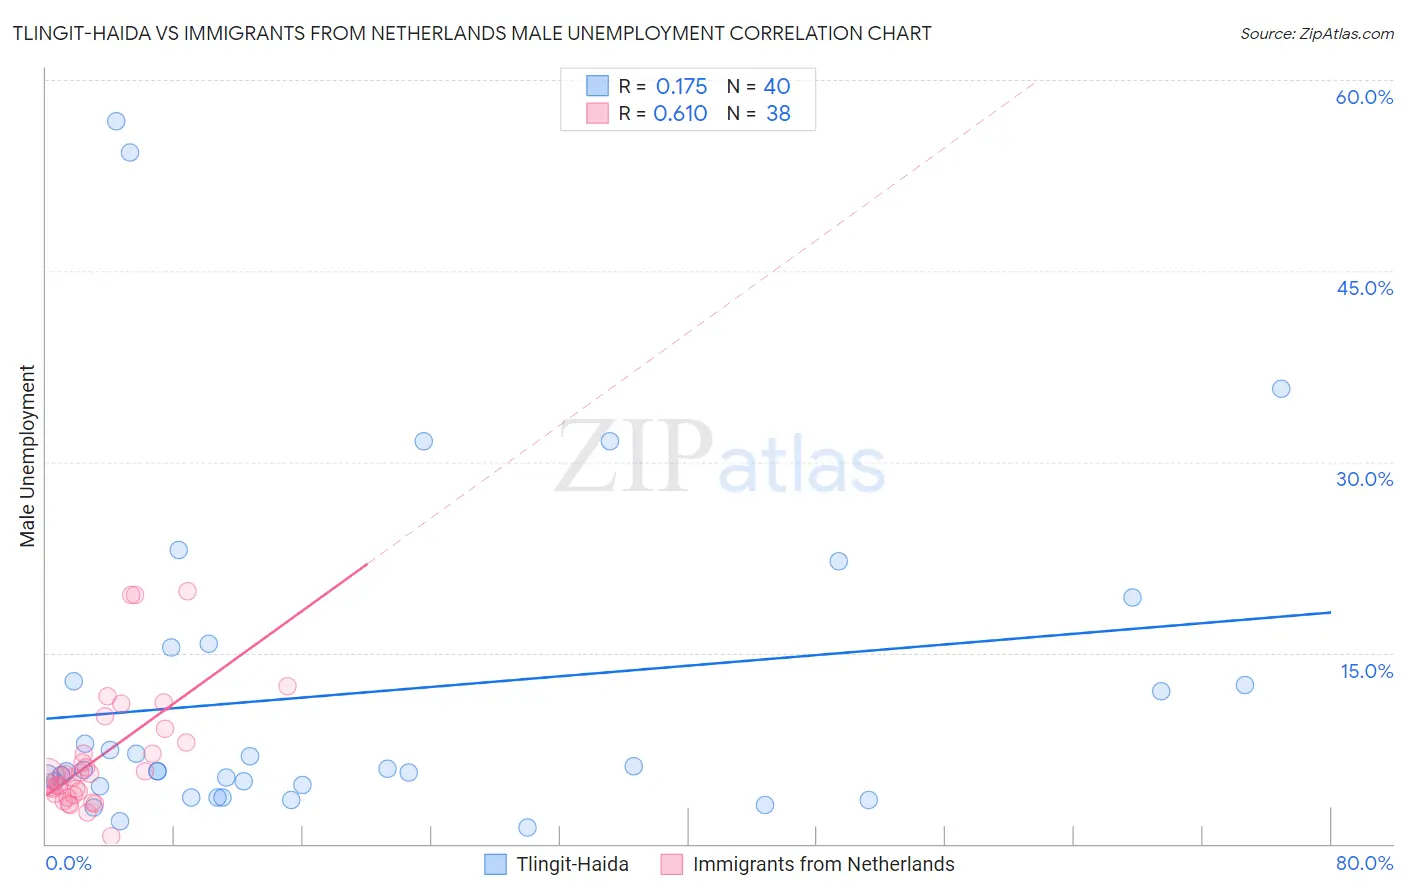
Tlingit-Haida vs Immigrants from Netherlands Male Unemployment Correlation Chart
The statistical analysis conducted on geographies consisting of 60,678,234 people shows a poor positive correlation between the proportion of Tlingit-Haida and unemployment rate among males in the United States with a correlation coefficient (R) of 0.175 and weighted average of 6.0%. Similarly, the statistical analysis conducted on geographies consisting of 237,368,894 people shows a significant positive correlation between the proportion of Immigrants from Netherlands and unemployment rate among males in the United States with a correlation coefficient (R) of 0.610 and weighted average of 5.0%, a difference of 21.1%.
Male Unemployment Correlation Summary
| Measurement | Tlingit-Haida | Immigrants from Netherlands |
| Minimum | 1.3% | 0.60% |
| Maximum | 56.8% | 19.8% |
| Range | 55.5% | 19.2% |
| Mean | 11.9% | 6.8% |
| Median | 5.8% | 5.3% |
| Interquartile 25% (IQ1) | 4.6% | 4.0% |
| Interquartile 75% (IQ3) | 14.1% | 8.0% |
| Interquartile Range (IQR) | 9.5% | 4.0% |
| Standard Deviation (Sample) | 13.3% | 4.7% |
| Standard Deviation (Population) | 13.1% | 4.6% |
Similar Demographics by Male Unemployment
Demographics Similar to Tlingit-Haida by Male Unemployment
In terms of male unemployment, the demographic groups most similar to Tlingit-Haida are Menominee (6.0%, a difference of 0.10%), Immigrants from Sierra Leone (6.0%, a difference of 0.25%), Immigrants from Liberia (6.1%, a difference of 0.42%), Immigrants from Uzbekistan (6.0%, a difference of 0.43%), and Armenian (6.0%, a difference of 0.43%).
| Demographics | Rating | Rank | Male Unemployment |
| Immigrants | Nigeria | 0.0 /100 | #269 | Tragic 6.0% |
| Sub-Saharan Africans | 0.0 /100 | #270 | Tragic 6.0% |
| Blackfeet | 0.0 /100 | #271 | Tragic 6.0% |
| Immigrants | Uzbekistan | 0.0 /100 | #272 | Tragic 6.0% |
| Armenians | 0.0 /100 | #273 | Tragic 6.0% |
| Immigrants | Sierra Leone | 0.0 /100 | #274 | Tragic 6.0% |
| Menominee | 0.0 /100 | #275 | Tragic 6.0% |
| Tlingit-Haida | 0.0 /100 | #276 | Tragic 6.0% |
| Immigrants | Liberia | 0.0 /100 | #277 | Tragic 6.1% |
| Immigrants | Fiji | 0.0 /100 | #278 | Tragic 6.1% |
| Ghanaians | 0.0 /100 | #279 | Tragic 6.1% |
| Immigrants | Ghana | 0.0 /100 | #280 | Tragic 6.2% |
| Sierra Leoneans | 0.0 /100 | #281 | Tragic 6.2% |
| Ecuadorians | 0.0 /100 | #282 | Tragic 6.2% |
| Immigrants | Western Africa | 0.0 /100 | #283 | Tragic 6.2% |
Demographics Similar to Immigrants from Netherlands by Male Unemployment
In terms of male unemployment, the demographic groups most similar to Immigrants from Netherlands are Turkish (5.0%, a difference of 0.14%), Lithuanian (5.0%, a difference of 0.14%), Immigrants from Argentina (5.0%, a difference of 0.18%), Cambodian (5.0%, a difference of 0.26%), and Immigrants from Bulgaria (5.0%, a difference of 0.37%).
| Demographics | Rating | Rank | Male Unemployment |
| Irish | 98.8 /100 | #52 | Exceptional 5.0% |
| Jordanians | 98.8 /100 | #53 | Exceptional 5.0% |
| Yugoslavians | 98.7 /100 | #54 | Exceptional 5.0% |
| Czechoslovakians | 98.7 /100 | #55 | Exceptional 5.0% |
| Immigrants | Bulgaria | 98.7 /100 | #56 | Exceptional 5.0% |
| Turks | 98.5 /100 | #57 | Exceptional 5.0% |
| Lithuanians | 98.5 /100 | #58 | Exceptional 5.0% |
| Immigrants | Netherlands | 98.3 /100 | #59 | Exceptional 5.0% |
| Immigrants | Argentina | 98.1 /100 | #60 | Exceptional 5.0% |
| Cambodians | 98.1 /100 | #61 | Exceptional 5.0% |
| Basques | 97.9 /100 | #62 | Exceptional 5.0% |
| Eastern Europeans | 97.9 /100 | #63 | Exceptional 5.0% |
| Celtics | 97.8 /100 | #64 | Exceptional 5.0% |
| Icelanders | 97.6 /100 | #65 | Exceptional 5.0% |
| Finns | 97.5 /100 | #66 | Exceptional 5.0% |