Tlingit-Haida vs Delaware Male Unemployment
COMPARE
Tlingit-Haida
Delaware
Male Unemployment
Male Unemployment Comparison
Tlingit-Haida
Delaware
6.0%
MALE UNEMPLOYMENT
0.0/ 100
METRIC RATING
276th/ 347
METRIC RANK
5.5%
MALE UNEMPLOYMENT
4.2/ 100
METRIC RATING
217th/ 347
METRIC RANK
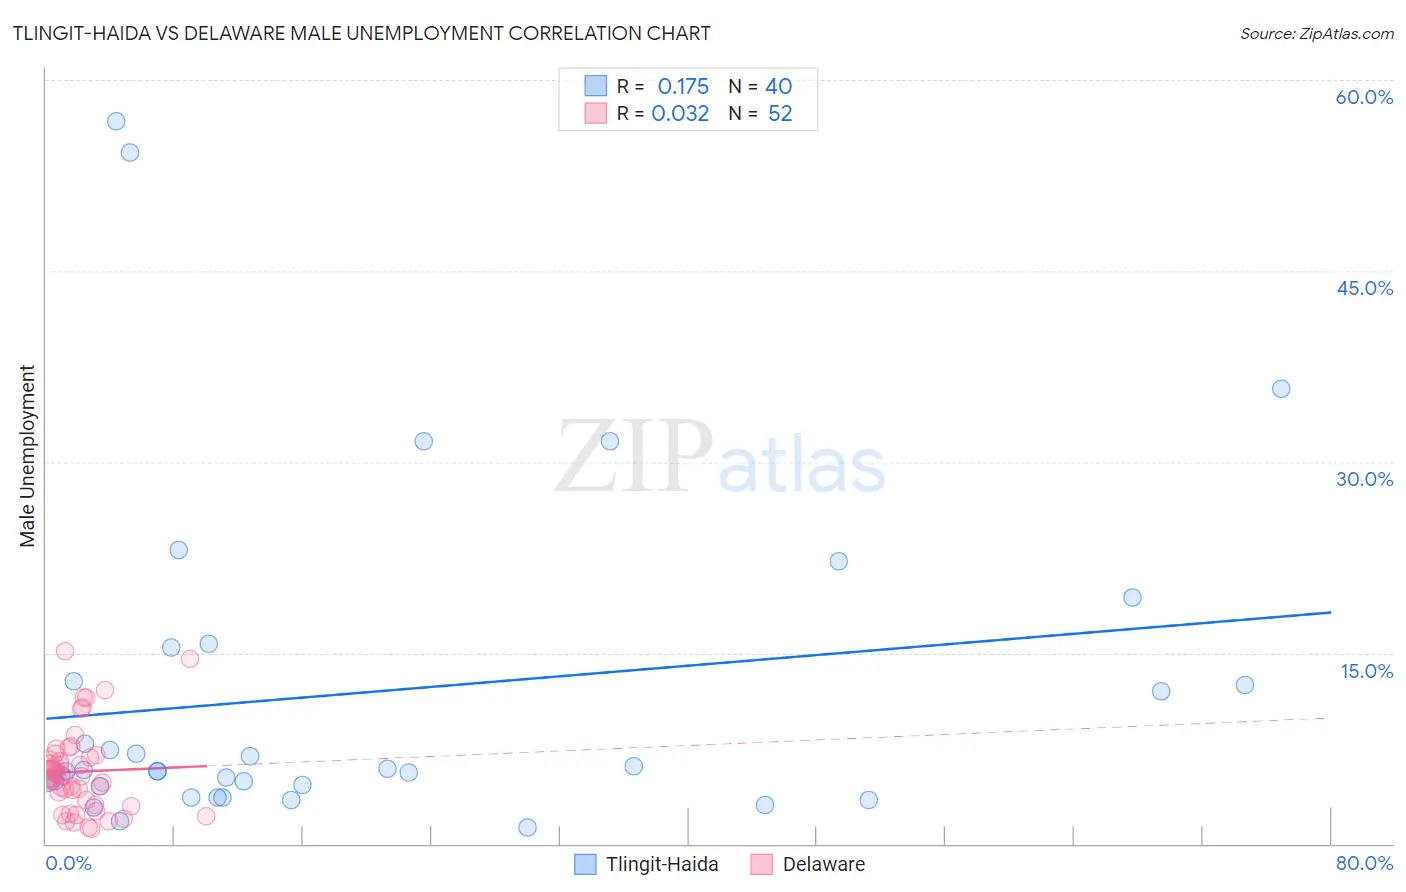
Tlingit-Haida vs Delaware Male Unemployment Correlation Chart
The statistical analysis conducted on geographies consisting of 60,678,234 people shows a poor positive correlation between the proportion of Tlingit-Haida and unemployment rate among males in the United States with a correlation coefficient (R) of 0.175 and weighted average of 6.0%. Similarly, the statistical analysis conducted on geographies consisting of 96,069,149 people shows no correlation between the proportion of Delaware and unemployment rate among males in the United States with a correlation coefficient (R) of 0.032 and weighted average of 5.5%, a difference of 8.9%.
Male Unemployment Correlation Summary
| Measurement | Tlingit-Haida | Delaware |
| Minimum | 1.3% | 1.2% |
| Maximum | 56.8% | 15.1% |
| Range | 55.5% | 13.9% |
| Mean | 11.9% | 5.7% |
| Median | 5.8% | 5.3% |
| Interquartile 25% (IQ1) | 4.6% | 3.2% |
| Interquartile 75% (IQ3) | 14.1% | 6.8% |
| Interquartile Range (IQR) | 9.5% | 3.6% |
| Standard Deviation (Sample) | 13.3% | 3.3% |
| Standard Deviation (Population) | 13.1% | 3.2% |
Similar Demographics by Male Unemployment
Demographics Similar to Tlingit-Haida by Male Unemployment
In terms of male unemployment, the demographic groups most similar to Tlingit-Haida are Menominee (6.0%, a difference of 0.10%), Immigrants from Sierra Leone (6.0%, a difference of 0.25%), Immigrants from Liberia (6.1%, a difference of 0.42%), Immigrants from Uzbekistan (6.0%, a difference of 0.43%), and Armenian (6.0%, a difference of 0.43%).
| Demographics | Rating | Rank | Male Unemployment |
| Immigrants | Nigeria | 0.0 /100 | #269 | Tragic 6.0% |
| Sub-Saharan Africans | 0.0 /100 | #270 | Tragic 6.0% |
| Blackfeet | 0.0 /100 | #271 | Tragic 6.0% |
| Immigrants | Uzbekistan | 0.0 /100 | #272 | Tragic 6.0% |
| Armenians | 0.0 /100 | #273 | Tragic 6.0% |
| Immigrants | Sierra Leone | 0.0 /100 | #274 | Tragic 6.0% |
| Menominee | 0.0 /100 | #275 | Tragic 6.0% |
| Tlingit-Haida | 0.0 /100 | #276 | Tragic 6.0% |
| Immigrants | Liberia | 0.0 /100 | #277 | Tragic 6.1% |
| Immigrants | Fiji | 0.0 /100 | #278 | Tragic 6.1% |
| Ghanaians | 0.0 /100 | #279 | Tragic 6.1% |
| Immigrants | Ghana | 0.0 /100 | #280 | Tragic 6.2% |
| Sierra Leoneans | 0.0 /100 | #281 | Tragic 6.2% |
| Ecuadorians | 0.0 /100 | #282 | Tragic 6.2% |
| Immigrants | Western Africa | 0.0 /100 | #283 | Tragic 6.2% |
Demographics Similar to Delaware by Male Unemployment
In terms of male unemployment, the demographic groups most similar to Delaware are Immigrants (5.5%, a difference of 0.050%), Immigrants from Albania (5.5%, a difference of 0.21%), Samoan (5.5%, a difference of 0.22%), Immigrants from Western Asia (5.6%, a difference of 0.25%), and Portuguese (5.6%, a difference of 0.28%).
| Demographics | Rating | Rank | Male Unemployment |
| South American Indians | 7.6 /100 | #210 | Tragic 5.5% |
| Israelis | 7.4 /100 | #211 | Tragic 5.5% |
| Hmong | 7.0 /100 | #212 | Tragic 5.5% |
| Ugandans | 6.3 /100 | #213 | Tragic 5.5% |
| Puget Sound Salish | 5.6 /100 | #214 | Tragic 5.5% |
| Samoans | 4.9 /100 | #215 | Tragic 5.5% |
| Immigrants | Immigrants | 4.3 /100 | #216 | Tragic 5.5% |
| Delaware | 4.2 /100 | #217 | Tragic 5.5% |
| Immigrants | Albania | 3.6 /100 | #218 | Tragic 5.5% |
| Immigrants | Western Asia | 3.5 /100 | #219 | Tragic 5.6% |
| Portuguese | 3.5 /100 | #220 | Tragic 5.6% |
| Soviet Union | 3.2 /100 | #221 | Tragic 5.6% |
| Immigrants | Micronesia | 2.9 /100 | #222 | Tragic 5.6% |
| Creek | 2.6 /100 | #223 | Tragic 5.6% |
| Cherokee | 2.4 /100 | #224 | Tragic 5.6% |