Tlingit-Haida vs Immigrants from Ireland Male Unemployment
COMPARE
Tlingit-Haida
Immigrants from Ireland
Male Unemployment
Male Unemployment Comparison
Tlingit-Haida
Immigrants from Ireland
6.0%
MALE UNEMPLOYMENT
0.0/ 100
METRIC RATING
276th/ 347
METRIC RANK
5.3%
MALE UNEMPLOYMENT
57.7/ 100
METRIC RATING
168th/ 347
METRIC RANK
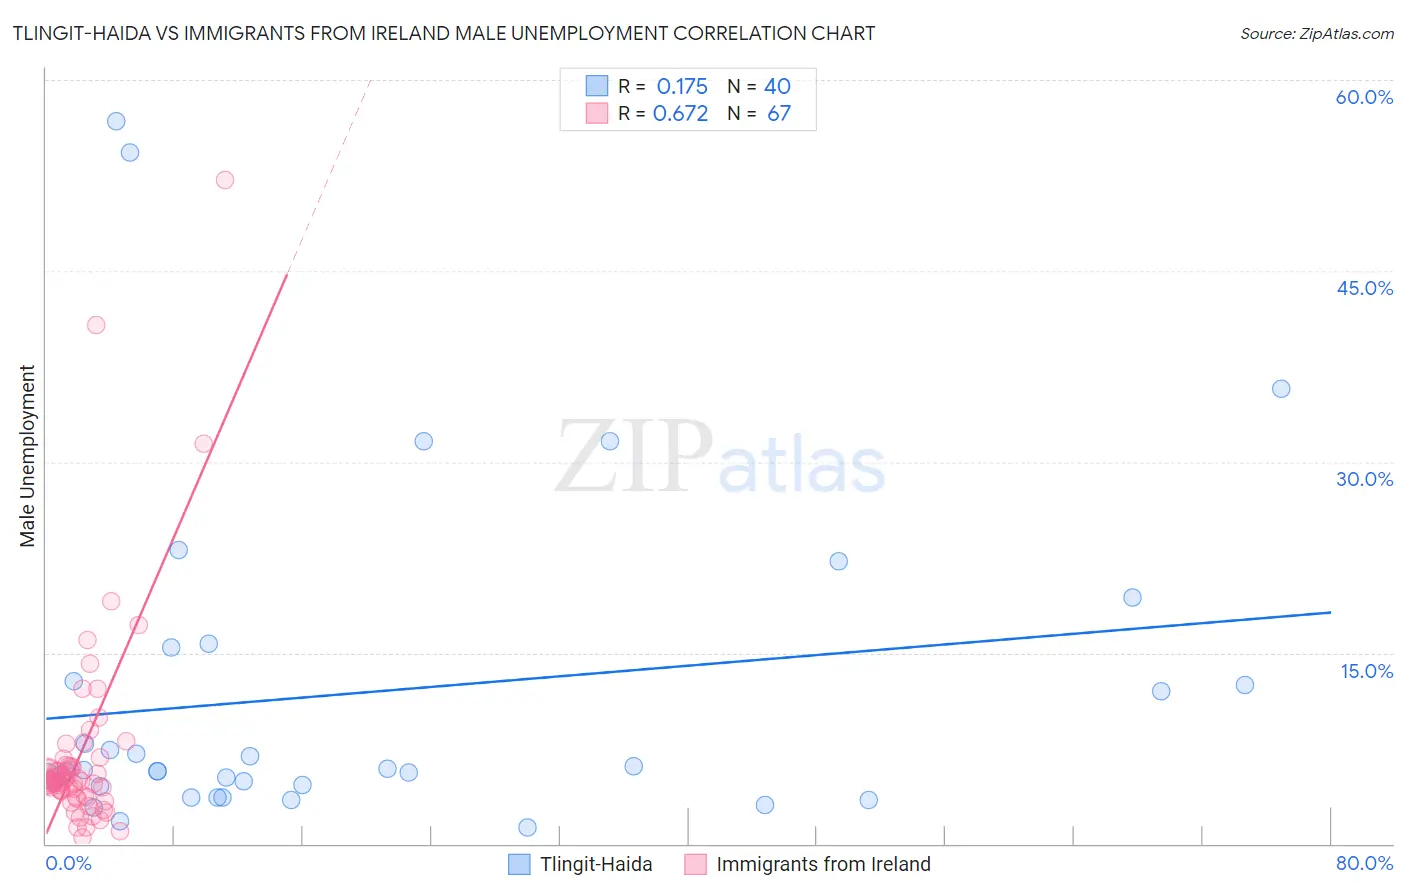
Tlingit-Haida vs Immigrants from Ireland Male Unemployment Correlation Chart
The statistical analysis conducted on geographies consisting of 60,678,234 people shows a poor positive correlation between the proportion of Tlingit-Haida and unemployment rate among males in the United States with a correlation coefficient (R) of 0.175 and weighted average of 6.0%. Similarly, the statistical analysis conducted on geographies consisting of 240,228,125 people shows a significant positive correlation between the proportion of Immigrants from Ireland and unemployment rate among males in the United States with a correlation coefficient (R) of 0.672 and weighted average of 5.3%, a difference of 14.4%.
Male Unemployment Correlation Summary
| Measurement | Tlingit-Haida | Immigrants from Ireland |
| Minimum | 1.3% | 0.50% |
| Maximum | 56.8% | 52.1% |
| Range | 55.5% | 51.6% |
| Mean | 11.9% | 7.2% |
| Median | 5.8% | 4.9% |
| Interquartile 25% (IQ1) | 4.6% | 3.7% |
| Interquartile 75% (IQ3) | 14.1% | 6.2% |
| Interquartile Range (IQR) | 9.5% | 2.5% |
| Standard Deviation (Sample) | 13.3% | 8.5% |
| Standard Deviation (Population) | 13.1% | 8.4% |
Similar Demographics by Male Unemployment
Demographics Similar to Tlingit-Haida by Male Unemployment
In terms of male unemployment, the demographic groups most similar to Tlingit-Haida are Menominee (6.0%, a difference of 0.10%), Immigrants from Sierra Leone (6.0%, a difference of 0.25%), Immigrants from Liberia (6.1%, a difference of 0.42%), Immigrants from Uzbekistan (6.0%, a difference of 0.43%), and Armenian (6.0%, a difference of 0.43%).
| Demographics | Rating | Rank | Male Unemployment |
| Immigrants | Nigeria | 0.0 /100 | #269 | Tragic 6.0% |
| Sub-Saharan Africans | 0.0 /100 | #270 | Tragic 6.0% |
| Blackfeet | 0.0 /100 | #271 | Tragic 6.0% |
| Immigrants | Uzbekistan | 0.0 /100 | #272 | Tragic 6.0% |
| Armenians | 0.0 /100 | #273 | Tragic 6.0% |
| Immigrants | Sierra Leone | 0.0 /100 | #274 | Tragic 6.0% |
| Menominee | 0.0 /100 | #275 | Tragic 6.0% |
| Tlingit-Haida | 0.0 /100 | #276 | Tragic 6.0% |
| Immigrants | Liberia | 0.0 /100 | #277 | Tragic 6.1% |
| Immigrants | Fiji | 0.0 /100 | #278 | Tragic 6.1% |
| Ghanaians | 0.0 /100 | #279 | Tragic 6.1% |
| Immigrants | Ghana | 0.0 /100 | #280 | Tragic 6.2% |
| Sierra Leoneans | 0.0 /100 | #281 | Tragic 6.2% |
| Ecuadorians | 0.0 /100 | #282 | Tragic 6.2% |
| Immigrants | Western Africa | 0.0 /100 | #283 | Tragic 6.2% |
Demographics Similar to Immigrants from Ireland by Male Unemployment
In terms of male unemployment, the demographic groups most similar to Immigrants from Ireland are Immigrants from Vietnam (5.3%, a difference of 0.020%), Immigrants from Congo (5.3%, a difference of 0.020%), Immigrants from Morocco (5.3%, a difference of 0.15%), South American (5.3%, a difference of 0.18%), and Immigrants from Eastern Europe (5.3%, a difference of 0.22%).
| Demographics | Rating | Rank | Male Unemployment |
| Immigrants | China | 70.6 /100 | #161 | Good 5.2% |
| Immigrants | Egypt | 65.9 /100 | #162 | Good 5.2% |
| Immigrants | Hong Kong | 65.7 /100 | #163 | Good 5.2% |
| Afghans | 62.0 /100 | #164 | Good 5.3% |
| South Americans | 60.6 /100 | #165 | Good 5.3% |
| Immigrants | Morocco | 60.2 /100 | #166 | Good 5.3% |
| Immigrants | Vietnam | 58.1 /100 | #167 | Average 5.3% |
| Immigrants | Ireland | 57.7 /100 | #168 | Average 5.3% |
| Immigrants | Congo | 57.4 /100 | #169 | Average 5.3% |
| Immigrants | Eastern Europe | 54.1 /100 | #170 | Average 5.3% |
| Peruvians | 51.9 /100 | #171 | Average 5.3% |
| Immigrants | Kazakhstan | 50.8 /100 | #172 | Average 5.3% |
| Immigrants | Russia | 50.7 /100 | #173 | Average 5.3% |
| Immigrants | Iran | 50.0 /100 | #174 | Average 5.3% |
| Immigrants | Iraq | 48.1 /100 | #175 | Average 5.3% |