Tlingit-Haida vs British West Indian Male Unemployment
COMPARE
Tlingit-Haida
British West Indian
Male Unemployment
Male Unemployment Comparison
Tlingit-Haida
British West Indians
6.0%
MALE UNEMPLOYMENT
0.0/ 100
METRIC RATING
276th/ 347
METRIC RANK
7.3%
MALE UNEMPLOYMENT
0.0/ 100
METRIC RATING
319th/ 347
METRIC RANK
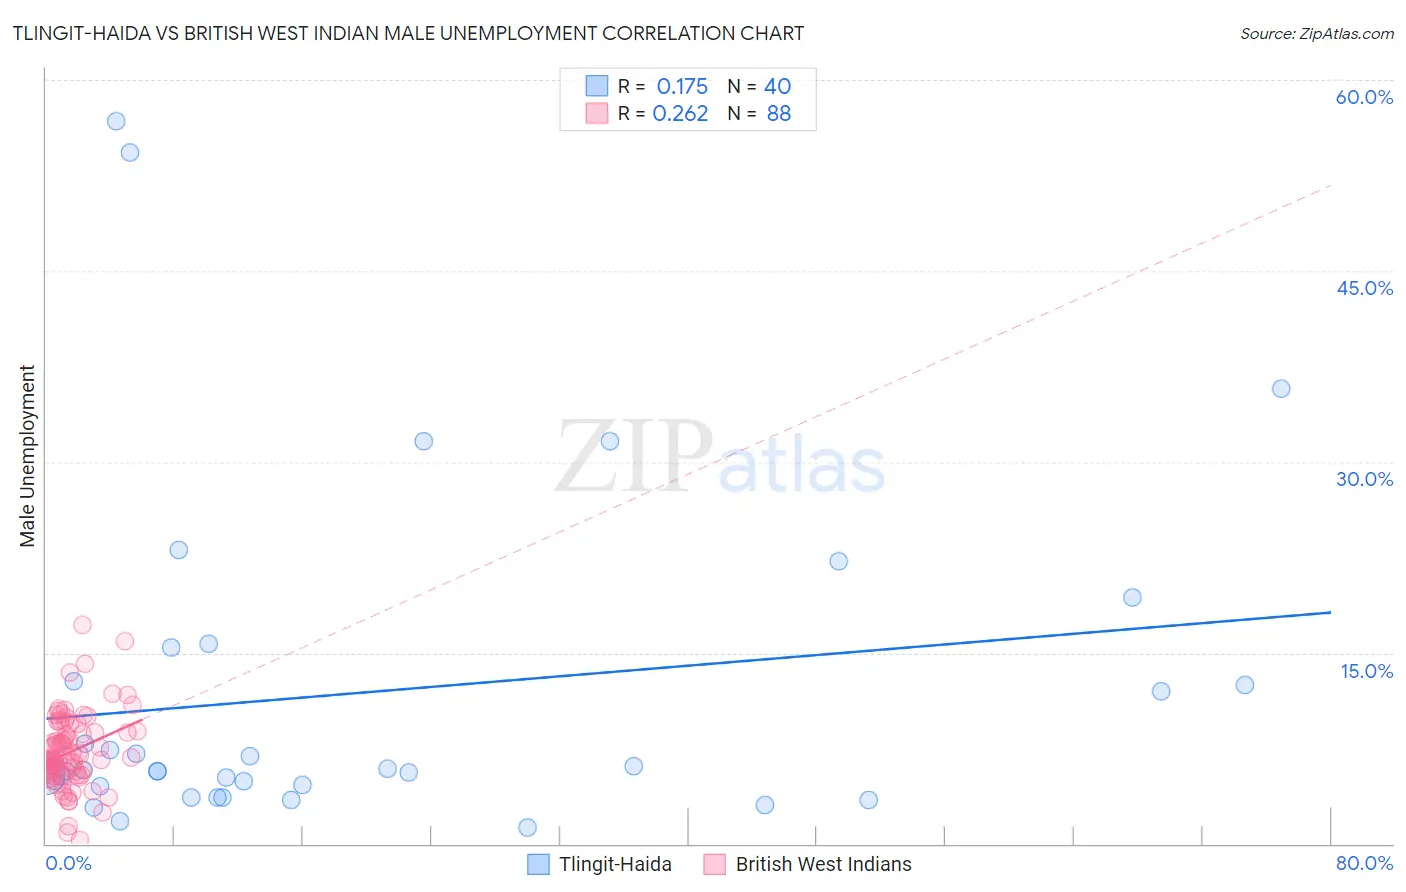
Tlingit-Haida vs British West Indian Male Unemployment Correlation Chart
The statistical analysis conducted on geographies consisting of 60,678,234 people shows a poor positive correlation between the proportion of Tlingit-Haida and unemployment rate among males in the United States with a correlation coefficient (R) of 0.175 and weighted average of 6.0%. Similarly, the statistical analysis conducted on geographies consisting of 152,492,993 people shows a weak positive correlation between the proportion of British West Indians and unemployment rate among males in the United States with a correlation coefficient (R) of 0.262 and weighted average of 7.3%, a difference of 21.1%.
Male Unemployment Correlation Summary
| Measurement | Tlingit-Haida | British West Indian |
| Minimum | 1.3% | 0.30% |
| Maximum | 56.8% | 17.2% |
| Range | 55.5% | 16.9% |
| Mean | 11.9% | 7.2% |
| Median | 5.8% | 6.7% |
| Interquartile 25% (IQ1) | 4.6% | 5.6% |
| Interquartile 75% (IQ3) | 14.1% | 8.8% |
| Interquartile Range (IQR) | 9.5% | 3.2% |
| Standard Deviation (Sample) | 13.3% | 2.9% |
| Standard Deviation (Population) | 13.1% | 2.9% |
Similar Demographics by Male Unemployment
Demographics Similar to Tlingit-Haida by Male Unemployment
In terms of male unemployment, the demographic groups most similar to Tlingit-Haida are Menominee (6.0%, a difference of 0.10%), Immigrants from Sierra Leone (6.0%, a difference of 0.25%), Immigrants from Liberia (6.1%, a difference of 0.42%), Immigrants from Uzbekistan (6.0%, a difference of 0.43%), and Armenian (6.0%, a difference of 0.43%).
| Demographics | Rating | Rank | Male Unemployment |
| Immigrants | Nigeria | 0.0 /100 | #269 | Tragic 6.0% |
| Sub-Saharan Africans | 0.0 /100 | #270 | Tragic 6.0% |
| Blackfeet | 0.0 /100 | #271 | Tragic 6.0% |
| Immigrants | Uzbekistan | 0.0 /100 | #272 | Tragic 6.0% |
| Armenians | 0.0 /100 | #273 | Tragic 6.0% |
| Immigrants | Sierra Leone | 0.0 /100 | #274 | Tragic 6.0% |
| Menominee | 0.0 /100 | #275 | Tragic 6.0% |
| Tlingit-Haida | 0.0 /100 | #276 | Tragic 6.0% |
| Immigrants | Liberia | 0.0 /100 | #277 | Tragic 6.1% |
| Immigrants | Fiji | 0.0 /100 | #278 | Tragic 6.1% |
| Ghanaians | 0.0 /100 | #279 | Tragic 6.1% |
| Immigrants | Ghana | 0.0 /100 | #280 | Tragic 6.2% |
| Sierra Leoneans | 0.0 /100 | #281 | Tragic 6.2% |
| Ecuadorians | 0.0 /100 | #282 | Tragic 6.2% |
| Immigrants | Western Africa | 0.0 /100 | #283 | Tragic 6.2% |
Demographics Similar to British West Indians by Male Unemployment
In terms of male unemployment, the demographic groups most similar to British West Indians are Colville (7.4%, a difference of 0.90%), Immigrants from St. Vincent and the Grenadines (7.5%, a difference of 2.3%), Cape Verdean (7.1%, a difference of 2.5%), Immigrants from Cabo Verde (7.5%, a difference of 2.6%), and Guyanese (7.1%, a difference of 2.6%).
| Demographics | Rating | Rank | Male Unemployment |
| Lumbee | 0.0 /100 | #312 | Tragic 6.9% |
| Immigrants | Dominica | 0.0 /100 | #313 | Tragic 7.0% |
| Immigrants | Barbados | 0.0 /100 | #314 | Tragic 7.1% |
| Houma | 0.0 /100 | #315 | Tragic 7.1% |
| Immigrants | Guyana | 0.0 /100 | #316 | Tragic 7.1% |
| Guyanese | 0.0 /100 | #317 | Tragic 7.1% |
| Cape Verdeans | 0.0 /100 | #318 | Tragic 7.1% |
| British West Indians | 0.0 /100 | #319 | Tragic 7.3% |
| Colville | 0.0 /100 | #320 | Tragic 7.4% |
| Immigrants | St. Vincent and the Grenadines | 0.0 /100 | #321 | Tragic 7.5% |
| Immigrants | Cabo Verde | 0.0 /100 | #322 | Tragic 7.5% |
| Immigrants | Grenada | 0.0 /100 | #323 | Tragic 7.6% |
| Dominicans | 0.0 /100 | #324 | Tragic 7.6% |
| Shoshone | 0.0 /100 | #325 | Tragic 7.6% |
| Immigrants | Dominican Republic | 0.0 /100 | #326 | Tragic 7.6% |