White/Caucasian vs Immigrants from Ethiopia Family Poverty
COMPARE
White/Caucasian
Immigrants from Ethiopia
Family Poverty
Family Poverty Comparison
Whites/Caucasians
Immigrants from Ethiopia
8.8%
FAMILY POVERTY
69.1/ 100
METRIC RATING
158th/ 347
METRIC RANK
8.9%
FAMILY POVERTY
62.5/ 100
METRIC RATING
167th/ 347
METRIC RANK
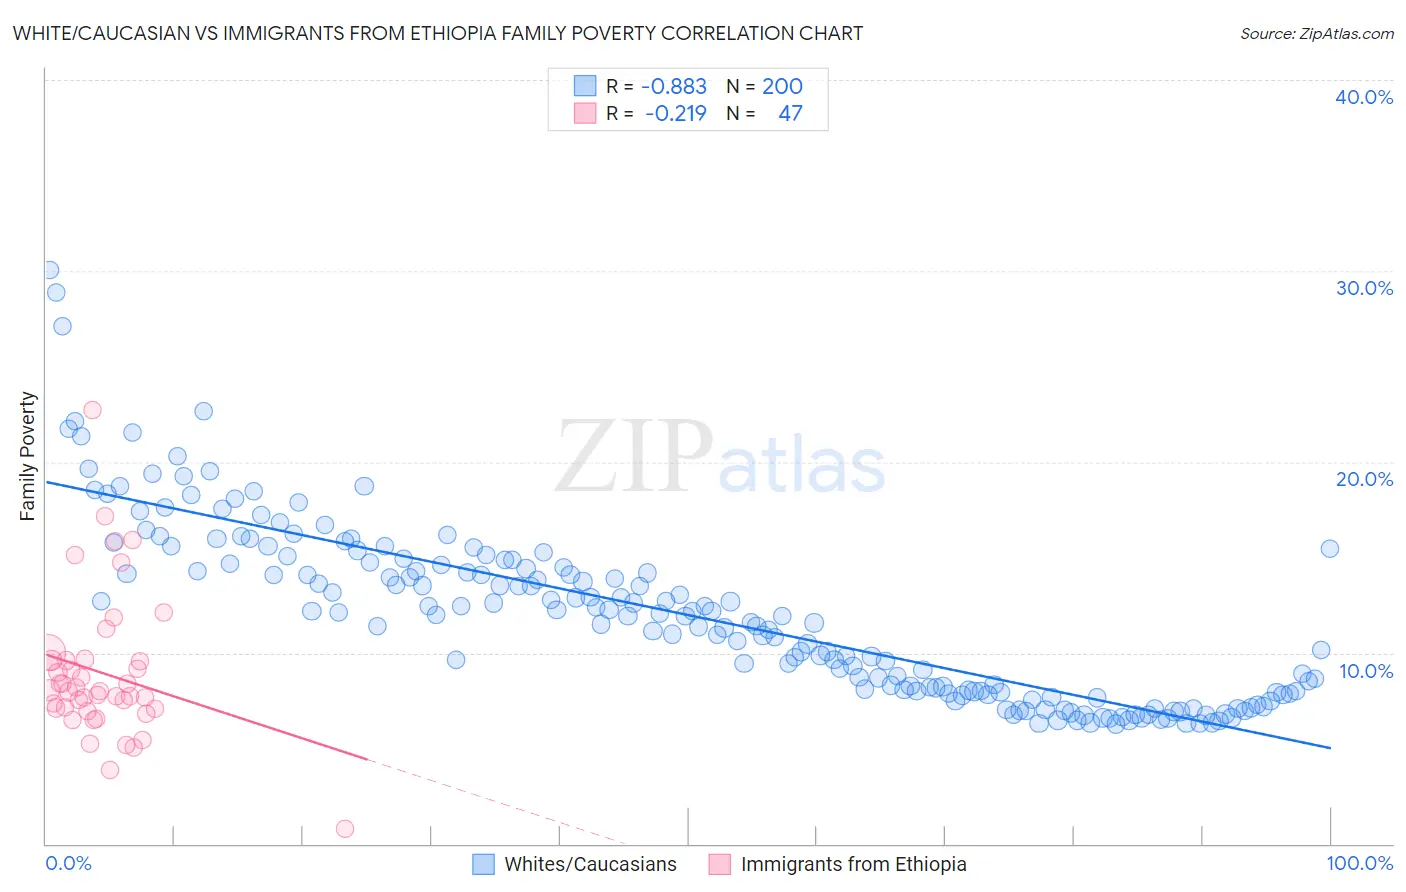
White/Caucasian vs Immigrants from Ethiopia Family Poverty Correlation Chart
The statistical analysis conducted on geographies consisting of 578,762,373 people shows a very strong negative correlation between the proportion of Whites/Caucasians and poverty level among families in the United States with a correlation coefficient (R) of -0.883 and weighted average of 8.8%. Similarly, the statistical analysis conducted on geographies consisting of 211,298,755 people shows a weak negative correlation between the proportion of Immigrants from Ethiopia and poverty level among families in the United States with a correlation coefficient (R) of -0.219 and weighted average of 8.9%, a difference of 0.99%.
Family Poverty Correlation Summary
| Measurement | White/Caucasian | Immigrants from Ethiopia |
| Minimum | 6.3% | 0.78% |
| Maximum | 30.1% | 22.7% |
| Range | 23.8% | 22.0% |
| Mean | 12.0% | 8.9% |
| Median | 11.9% | 8.0% |
| Interquartile 25% (IQ1) | 7.9% | 7.1% |
| Interquartile 75% (IQ3) | 14.7% | 9.6% |
| Interquartile Range (IQR) | 6.7% | 2.5% |
| Standard Deviation (Sample) | 4.6% | 3.8% |
| Standard Deviation (Population) | 4.6% | 3.7% |
Demographics Similar to Whites/Caucasians and Immigrants from Ethiopia by Family Poverty
In terms of family poverty, the demographic groups most similar to Whites/Caucasians are Tsimshian (8.8%, a difference of 0.040%), Peruvian (8.8%, a difference of 0.16%), Hungarian (8.8%, a difference of 0.30%), Immigrants from Northern Africa (8.8%, a difference of 0.33%), and Immigrants from Oceania (8.7%, a difference of 0.34%). Similarly, the demographic groups most similar to Immigrants from Ethiopia are Israeli (8.9%, a difference of 0.060%), Afghan (8.8%, a difference of 0.14%), Guamanian/Chamorro (8.8%, a difference of 0.32%), Celtic (8.8%, a difference of 0.35%), and Immigrants from Chile (8.9%, a difference of 0.41%).
| Demographics | Rating | Rank | Family Poverty |
| Samoans | 79.8 /100 | #152 | Good 8.6% |
| Immigrants | Spain | 79.1 /100 | #153 | Good 8.6% |
| Immigrants | Vietnam | 75.4 /100 | #154 | Good 8.7% |
| Immigrants | Kuwait | 73.6 /100 | #155 | Good 8.7% |
| Immigrants | Oceania | 71.2 /100 | #156 | Good 8.7% |
| Tsimshian | 69.3 /100 | #157 | Good 8.8% |
| Whites/Caucasians | 69.1 /100 | #158 | Good 8.8% |
| Peruvians | 68.0 /100 | #159 | Good 8.8% |
| Hungarians | 67.2 /100 | #160 | Good 8.8% |
| Immigrants | Northern Africa | 66.9 /100 | #161 | Good 8.8% |
| Ethiopians | 66.3 /100 | #162 | Good 8.8% |
| Pennsylvania Germans | 66.0 /100 | #163 | Good 8.8% |
| Celtics | 64.9 /100 | #164 | Good 8.8% |
| Guamanians/Chamorros | 64.7 /100 | #165 | Good 8.8% |
| Afghans | 63.5 /100 | #166 | Good 8.8% |
| Immigrants | Ethiopia | 62.5 /100 | #167 | Good 8.9% |
| Israelis | 62.1 /100 | #168 | Good 8.9% |
| Immigrants | Chile | 59.6 /100 | #169 | Average 8.9% |
| Kenyans | 58.2 /100 | #170 | Average 8.9% |
| Lebanese | 57.6 /100 | #171 | Average 8.9% |
| Immigrants | Peru | 57.5 /100 | #172 | Average 8.9% |