White/Caucasian Female Unemployment
COMPARE
White/Caucasian
Select to Compare
Female Unemployment
White/Caucasian Female Unemployment
4.9%
UNEMPLOYMENT | FEMALES
99.0/ 100
METRIC RATING
53rd/ 347
METRIC RANK
White/Caucasian Female Unemployment Correlation Chart
The statistical analysis conducted on geographies consisting of 566,814,917 people shows a very strong negative correlation between the proportion of Whites/Caucasians and unemploymnet rate among females in the United States with a correlation coefficient (R) of -0.890 and weighted average of 4.9%. On average, for every 1% (one percent) increase in Whites/Caucasians within a typical geography, there is a decrease of 0.061% in unemploymnet rate among females.
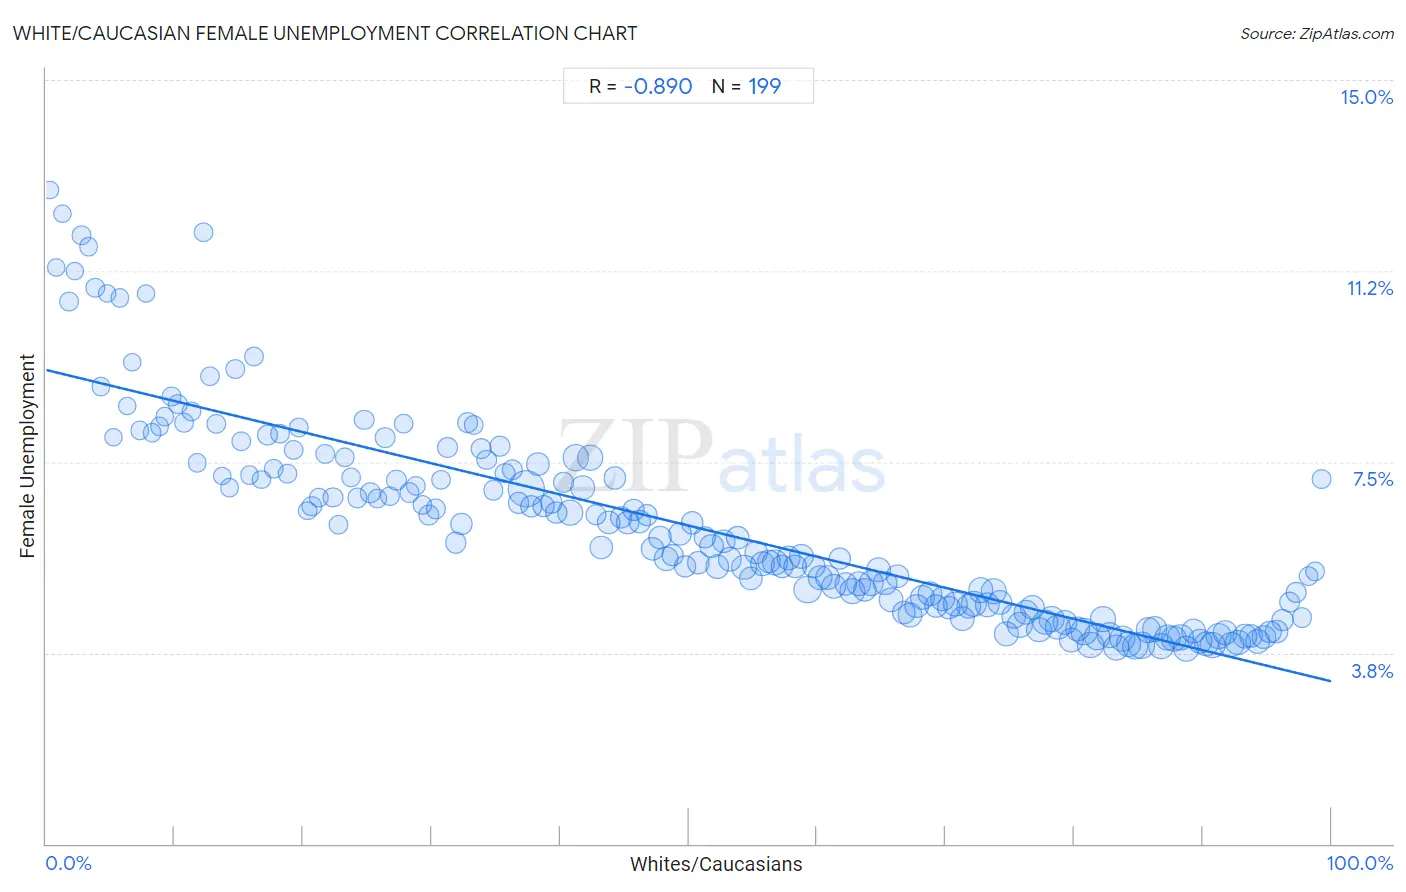
It is essential to understand that the correlation between the percentage of Whites/Caucasians and unemploymnet rate among females does not imply a direct cause-and-effect relationship. It remains uncertain whether the presence of Whites/Caucasians influences an upward or downward trend in the level of unemploymnet rate among females within an area, or if Whites/Caucasians simply ended up residing in those areas with higher or lower levels of unemploymnet rate among females due to other factors.
Demographics Similar to Whites/Caucasians by Female Unemployment
In terms of female unemployment, the demographic groups most similar to Whites/Caucasians are Slavic (4.9%, a difference of 0.030%), Cambodian (4.9%, a difference of 0.050%), Immigrants from Zimbabwe (4.9%, a difference of 0.060%), Immigrants from Cuba (4.9%, a difference of 0.070%), and Immigrants from Moldova (4.9%, a difference of 0.080%).
| Demographics | Rating | Rank | Female Unemployment |
| Immigrants from Bulgaria | 99.3 /100 | #46 | Exceptional 4.9% |
| Okinawans | 99.3 /100 | #47 | Exceptional 4.9% |
| Thais | 99.2 /100 | #48 | Exceptional 4.9% |
| Australians | 99.2 /100 | #49 | Exceptional 4.9% |
| Immigrants from Cuba | 99.1 /100 | #50 | Exceptional 4.9% |
| Cambodians | 99.1 /100 | #51 | Exceptional 4.9% |
| Slavs | 99.1 /100 | #52 | Exceptional 4.9% |
| Whites/Caucasians | 99.0 /100 | #53 | Exceptional 4.9% |
| Immigrants from Zimbabwe | 99.0 /100 | #54 | Exceptional 4.9% |
| Immigrants from Moldova | 99.0 /100 | #55 | Exceptional 4.9% |
| Serbians | 99.0 /100 | #56 | Exceptional 4.9% |
| Icelanders | 98.8 /100 | #57 | Exceptional 4.9% |
| Immigrants from Lithuania | 98.8 /100 | #58 | Exceptional 4.9% |
| Bhutanese | 98.7 /100 | #59 | Exceptional 4.9% |
| Immigrants from Scotland | 98.6 /100 | #60 | Exceptional 4.9% |
White/Caucasian Female Unemployment Correlation Summary
| Measurement | White/Caucasian Data | Female Unemployment Data |
| Minimum | 0.32% | 3.8% |
| Maximum | 99.2% | 12.8% |
| Range | 98.9% | 9.0% |
| Mean | 49.8% | 6.3% |
| Median | 49.7% | 5.9% |
| Interquartile 25% (IQ1) | 24.8% | 4.7% |
| Interquartile 75% (IQ3) | 74.8% | 7.3% |
| Interquartile Range (IQR) | 50.0% | 2.7% |
| Standard Deviation (Sample) | 28.8% | 2.0% |
| Standard Deviation (Population) | 28.7% | 2.0% |
Correlation Details
| White/Caucasian Percentile | Sample Size | Female Unemployment |
[ 0.0% - 0.5% ] 0.32% | 58,553 | 12.8% |
[ 0.5% - 1.0% ] 0.79% | 62,018 | 11.3% |
[ 1.0% - 1.5% ] 1.26% | 171,834 | 12.4% |
[ 1.5% - 2.0% ] 1.77% | 461,005 | 10.6% |
[ 2.0% - 2.5% ] 2.21% | 306,586 | 11.2% |
[ 2.5% - 3.0% ] 2.76% | 531,732 | 12.0% |
[ 3.0% - 3.5% ] 3.26% | 343,060 | 11.7% |
[ 3.5% - 4.0% ] 3.80% | 507,783 | 10.9% |
[ 4.0% - 4.5% ] 4.25% | 456,541 | 9.0% |
[ 4.5% - 5.0% ] 4.75% | 427,656 | 10.8% |
[ 5.0% - 5.5% ] 5.23% | 432,294 | 8.0% |
[ 5.5% - 6.0% ] 5.75% | 352,932 | 10.7% |
[ 6.0% - 6.5% ] 6.27% | 449,369 | 8.6% |
[ 6.5% - 7.0% ] 6.68% | 421,370 | 9.5% |
[ 7.0% - 7.5% ] 7.30% | 353,178 | 8.1% |
[ 7.5% - 8.0% ] 7.78% | 340,071 | 10.8% |
[ 8.0% - 8.5% ] 8.24% | 570,253 | 8.1% |
[ 8.5% - 9.0% ] 8.81% | 660,803 | 8.2% |
[ 9.0% - 9.5% ] 9.25% | 383,484 | 8.4% |
[ 9.5% - 10.0% ] 9.74% | 485,198 | 8.8% |
[ 10.0% - 10.5% ] 10.22% | 439,747 | 8.6% |
[ 10.5% - 11.0% ] 10.73% | 498,542 | 8.3% |
[ 11.0% - 11.5% ] 11.28% | 719,757 | 8.5% |
[ 11.5% - 12.0% ] 11.75% | 473,129 | 7.5% |
[ 12.0% - 12.5% ] 12.21% | 1,175,663 | 12.0% |
[ 12.5% - 13.0% ] 12.75% | 897,326 | 9.2% |
[ 13.0% - 13.5% ] 13.27% | 787,939 | 8.3% |
[ 13.5% - 14.0% ] 13.70% | 430,907 | 7.2% |
[ 14.0% - 14.5% ] 14.27% | 705,896 | 7.0% |
[ 14.5% - 15.0% ] 14.70% | 502,827 | 9.3% |
[ 15.0% - 15.5% ] 15.17% | 870,048 | 7.9% |
[ 15.5% - 16.0% ] 15.81% | 700,981 | 7.2% |
[ 16.0% - 16.5% ] 16.15% | 545,053 | 9.6% |
[ 16.5% - 17.0% ] 16.76% | 682,984 | 7.2% |
[ 17.0% - 17.5% ] 17.25% | 1,684,178 | 8.0% |
[ 17.5% - 18.0% ] 17.71% | 871,119 | 7.4% |
[ 18.0% - 18.5% ] 18.21% | 917,442 | 8.0% |
[ 18.5% - 19.0% ] 18.75% | 950,760 | 7.3% |
[ 19.0% - 19.5% ] 19.26% | 1,000,109 | 7.7% |
[ 19.5% - 20.0% ] 19.69% | 916,647 | 8.2% |
[ 20.0% - 20.5% ] 20.31% | 750,213 | 6.5% |
[ 20.5% - 21.0% ] 20.67% | 985,225 | 6.6% |
[ 21.0% - 21.5% ] 21.23% | 731,987 | 6.8% |
[ 21.5% - 22.0% ] 21.70% | 676,020 | 7.7% |
[ 22.0% - 22.5% ] 22.31% | 1,087,652 | 6.8% |
[ 22.5% - 23.0% ] 22.71% | 1,267,011 | 6.3% |
[ 23.0% - 23.5% ] 23.23% | 1,192,262 | 7.6% |
[ 23.5% - 24.0% ] 23.75% | 1,051,666 | 7.2% |
[ 24.0% - 24.5% ] 24.24% | 1,077,019 | 6.8% |
[ 24.5% - 25.0% ] 24.75% | 1,116,193 | 8.3% |
[ 25.0% - 25.5% ] 25.23% | 1,368,817 | 6.9% |
[ 25.5% - 26.0% ] 25.75% | 1,153,652 | 6.8% |
[ 26.0% - 26.5% ] 26.33% | 1,582,534 | 8.0% |
[ 26.5% - 27.0% ] 26.74% | 1,036,161 | 6.8% |
[ 27.0% - 27.5% ] 27.26% | 1,461,182 | 7.1% |
[ 27.5% - 28.0% ] 27.80% | 1,018,635 | 8.3% |
[ 28.0% - 28.5% ] 28.27% | 1,651,503 | 6.9% |
[ 28.5% - 29.0% ] 28.77% | 1,412,060 | 7.0% |
[ 29.0% - 29.5% ] 29.28% | 980,783 | 6.7% |
[ 29.5% - 30.0% ] 29.74% | 1,603,671 | 6.4% |
[ 30.0% - 30.5% ] 30.32% | 1,521,017 | 6.6% |
[ 30.5% - 31.0% ] 30.75% | 1,164,839 | 7.2% |
[ 31.0% - 31.5% ] 31.24% | 1,703,987 | 7.8% |
[ 31.5% - 32.0% ] 31.87% | 2,355,692 | 5.9% |
[ 32.0% - 32.5% ] 32.29% | 2,329,545 | 6.3% |
[ 32.5% - 33.0% ] 32.77% | 1,580,914 | 8.3% |
[ 33.0% - 33.5% ] 33.27% | 944,896 | 8.2% |
[ 33.5% - 34.0% ] 33.82% | 1,879,772 | 7.8% |
[ 34.0% - 34.5% ] 34.27% | 1,143,954 | 7.5% |
[ 34.5% - 35.0% ] 34.79% | 1,429,670 | 6.9% |
[ 35.0% - 35.5% ] 35.27% | 1,809,875 | 7.8% |
[ 35.5% - 36.0% ] 35.73% | 1,656,341 | 7.3% |
[ 36.0% - 36.5% ] 36.25% | 1,959,531 | 7.3% |
[ 36.5% - 37.0% ] 36.75% | 2,019,994 | 6.7% |
[ 37.0% - 37.5% ] 37.37% | 12,667,215 | 7.0% |
[ 37.5% - 38.0% ] 37.71% | 2,481,508 | 6.6% |
[ 38.0% - 38.5% ] 38.25% | 2,876,314 | 7.5% |
[ 38.5% - 39.0% ] 38.72% | 2,796,911 | 6.6% |
[ 39.0% - 39.5% ] 39.28% | 2,396,798 | 6.7% |
[ 39.5% - 40.0% ] 39.72% | 2,498,660 | 6.5% |
[ 40.0% - 40.5% ] 40.24% | 1,998,125 | 7.1% |
[ 40.5% - 41.0% ] 40.78% | 4,857,922 | 6.5% |
[ 41.0% - 41.5% ] 41.21% | 5,696,037 | 7.6% |
[ 41.5% - 42.0% ] 41.77% | 4,006,425 | 7.0% |
[ 42.0% - 42.5% ] 42.32% | 4,842,090 | 7.6% |
[ 42.5% - 43.0% ] 42.76% | 2,116,372 | 6.5% |
[ 43.0% - 43.5% ] 43.19% | 3,434,147 | 5.8% |
[ 43.5% - 44.0% ] 43.79% | 3,458,999 | 6.3% |
[ 44.0% - 44.5% ] 44.24% | 2,769,119 | 7.2% |
[ 44.5% - 45.0% ] 44.74% | 2,717,381 | 6.4% |
[ 45.0% - 45.5% ] 45.27% | 3,293,349 | 6.3% |
[ 45.5% - 46.0% ] 45.71% | 2,757,963 | 6.6% |
[ 46.0% - 46.5% ] 46.21% | 2,952,952 | 6.3% |
[ 46.5% - 47.0% ] 46.77% | 2,365,210 | 6.5% |
[ 47.0% - 47.5% ] 47.21% | 3,339,780 | 5.8% |
[ 47.5% - 48.0% ] 47.75% | 3,338,638 | 6.0% |
[ 48.0% - 48.5% ] 48.24% | 4,298,706 | 5.6% |
[ 48.5% - 49.0% ] 48.73% | 2,386,841 | 5.7% |
[ 49.0% - 49.5% ] 49.29% | 3,323,171 | 6.1% |
[ 49.5% - 50.0% ] 49.74% | 2,458,207 | 5.5% |
[ 50.0% - 50.5% ] 50.26% | 2,931,926 | 6.3% |
[ 50.5% - 51.0% ] 50.75% | 3,196,628 | 5.5% |
[ 51.0% - 51.5% ] 51.23% | 2,789,190 | 6.0% |
[ 51.5% - 52.0% ] 51.79% | 3,748,641 | 5.8% |
[ 52.0% - 52.5% ] 52.20% | 3,748,414 | 5.4% |
[ 52.5% - 53.0% ] 52.76% | 3,420,294 | 5.9% |
[ 53.0% - 53.5% ] 53.23% | 3,649,928 | 5.6% |
[ 53.5% - 54.0% ] 53.78% | 3,193,883 | 6.0% |
[ 54.0% - 54.5% ] 54.32% | 4,530,600 | 5.4% |
[ 54.5% - 55.0% ] 54.82% | 3,885,731 | 5.2% |
[ 55.0% - 55.5% ] 55.28% | 3,472,099 | 5.7% |
[ 55.5% - 56.0% ] 55.75% | 4,311,183 | 5.5% |
[ 56.0% - 56.5% ] 56.24% | 3,099,428 | 5.6% |
[ 56.5% - 57.0% ] 56.71% | 5,174,464 | 5.5% |
[ 57.0% - 57.5% ] 57.25% | 3,175,594 | 5.5% |
[ 57.5% - 58.0% ] 57.74% | 3,602,469 | 5.6% |
[ 58.0% - 58.5% ] 58.26% | 3,200,732 | 5.4% |
[ 58.5% - 59.0% ] 58.75% | 3,991,011 | 5.6% |
[ 59.0% - 59.5% ] 59.26% | 6,591,414 | 5.0% |
[ 59.5% - 60.0% ] 59.75% | 3,404,023 | 5.5% |
[ 60.0% - 60.5% ] 60.24% | 4,059,145 | 5.2% |
[ 60.5% - 61.0% ] 60.76% | 4,237,620 | 5.2% |
[ 61.0% - 61.5% ] 61.31% | 4,217,508 | 5.1% |
[ 61.5% - 62.0% ] 61.77% | 2,822,615 | 5.6% |
[ 62.0% - 62.5% ] 62.23% | 3,247,118 | 5.1% |
[ 62.5% - 63.0% ] 62.76% | 5,241,696 | 5.0% |
[ 63.0% - 63.5% ] 63.24% | 4,315,738 | 5.1% |
[ 63.5% - 64.0% ] 63.72% | 3,637,561 | 5.0% |
[ 64.0% - 64.5% ] 64.23% | 4,295,474 | 5.1% |
[ 64.5% - 65.0% ] 64.76% | 4,608,596 | 5.4% |
[ 65.0% - 65.5% ] 65.30% | 4,174,299 | 5.1% |
[ 65.5% - 66.0% ] 65.73% | 4,502,403 | 4.8% |
[ 66.0% - 66.5% ] 66.26% | 3,466,611 | 5.3% |
[ 66.5% - 67.0% ] 66.78% | 3,312,551 | 4.5% |
[ 67.0% - 67.5% ] 67.25% | 4,180,397 | 4.5% |
[ 67.5% - 68.0% ] 67.75% | 3,628,403 | 4.7% |
[ 68.0% - 68.5% ] 68.22% | 4,309,456 | 4.8% |
[ 68.5% - 69.0% ] 68.77% | 4,312,823 | 4.9% |
[ 69.0% - 69.5% ] 69.23% | 3,685,768 | 4.7% |
[ 69.5% - 70.0% ] 69.76% | 4,115,504 | 4.8% |
[ 70.0% - 70.5% ] 70.24% | 3,295,726 | 4.6% |
[ 70.5% - 71.0% ] 70.73% | 3,749,943 | 4.7% |
[ 71.0% - 71.5% ] 71.27% | 4,453,488 | 4.4% |
[ 71.5% - 72.0% ] 71.75% | 4,219,404 | 4.7% |
[ 72.0% - 72.5% ] 72.22% | 4,993,060 | 4.7% |
[ 72.5% - 73.0% ] 72.72% | 4,879,247 | 5.0% |
[ 73.0% - 73.5% ] 73.26% | 4,504,676 | 4.7% |
[ 73.5% - 74.0% ] 73.75% | 5,039,661 | 5.0% |
[ 74.0% - 74.5% ] 74.24% | 4,416,184 | 4.7% |
[ 74.5% - 75.0% ] 74.75% | 4,013,295 | 4.1% |
[ 75.0% - 75.5% ] 75.27% | 4,181,353 | 4.5% |
[ 75.5% - 76.0% ] 75.73% | 5,281,051 | 4.3% |
[ 76.0% - 76.5% ] 76.24% | 4,460,288 | 4.6% |
[ 76.5% - 77.0% ] 76.75% | 4,371,286 | 4.7% |
[ 77.0% - 77.5% ] 77.25% | 4,725,572 | 4.2% |
[ 77.5% - 78.0% ] 77.75% | 4,652,730 | 4.4% |
[ 78.0% - 78.5% ] 78.26% | 4,680,609 | 4.4% |
[ 78.5% - 79.0% ] 78.74% | 4,678,341 | 4.3% |
[ 79.0% - 79.5% ] 79.24% | 4,308,571 | 4.3% |
[ 79.5% - 80.0% ] 79.75% | 4,140,261 | 4.0% |
[ 80.0% - 80.5% ] 80.25% | 4,065,165 | 4.2% |
[ 80.5% - 81.0% ] 80.75% | 5,494,377 | 4.2% |
[ 81.0% - 81.5% ] 81.26% | 5,226,693 | 3.9% |
[ 81.5% - 82.0% ] 81.77% | 5,494,292 | 4.1% |
[ 82.0% - 82.5% ] 82.25% | 4,437,558 | 4.4% |
[ 82.5% - 83.0% ] 82.75% | 4,905,273 | 4.1% |
[ 83.0% - 83.5% ] 83.25% | 4,991,384 | 3.8% |
[ 83.5% - 84.0% ] 83.75% | 5,239,158 | 4.0% |
[ 84.0% - 84.5% ] 84.25% | 4,540,899 | 3.9% |
[ 84.5% - 85.0% ] 84.75% | 4,828,577 | 3.9% |
[ 85.0% - 85.5% ] 85.23% | 5,592,843 | 3.9% |
[ 85.5% - 86.0% ] 85.76% | 4,955,395 | 4.2% |
[ 86.0% - 86.5% ] 86.25% | 4,640,348 | 4.2% |
[ 86.5% - 87.0% ] 86.74% | 5,157,978 | 3.9% |
[ 87.0% - 87.5% ] 87.26% | 5,083,464 | 4.1% |
[ 87.5% - 88.0% ] 87.75% | 5,106,904 | 4.0% |
[ 88.0% - 88.5% ] 88.26% | 5,302,342 | 4.0% |
[ 88.5% - 89.0% ] 88.75% | 5,154,138 | 3.8% |
[ 89.0% - 89.5% ] 89.25% | 4,509,237 | 4.2% |
[ 89.5% - 90.0% ] 89.74% | 4,328,930 | 4.0% |
[ 90.0% - 90.5% ] 90.25% | 4,035,369 | 3.9% |
[ 90.5% - 91.0% ] 90.76% | 4,974,626 | 3.9% |
[ 91.0% - 91.5% ] 91.25% | 5,279,968 | 4.1% |
[ 91.5% - 92.0% ] 91.75% | 4,150,243 | 4.1% |
[ 92.0% - 92.5% ] 92.24% | 4,902,065 | 3.9% |
[ 92.5% - 93.0% ] 92.75% | 4,397,582 | 4.0% |
[ 93.0% - 93.5% ] 93.24% | 4,373,517 | 4.1% |
[ 93.5% - 94.0% ] 93.75% | 3,781,137 | 4.1% |
[ 94.0% - 94.5% ] 94.26% | 4,087,267 | 4.0% |
[ 94.5% - 95.0% ] 94.75% | 3,996,245 | 4.1% |
[ 95.0% - 95.5% ] 95.26% | 3,352,760 | 4.2% |
[ 95.5% - 96.0% ] 95.76% | 3,030,468 | 4.2% |
[ 96.0% - 96.5% ] 96.25% | 2,528,521 | 4.4% |
[ 96.5% - 97.0% ] 96.75% | 2,187,443 | 4.7% |
[ 97.0% - 97.5% ] 97.25% | 1,885,079 | 4.9% |
[ 97.5% - 98.0% ] 97.73% | 1,591,682 | 4.4% |
[ 98.0% - 98.5% ] 98.26% | 1,081,266 | 5.3% |
[ 98.5% - 99.0% ] 98.73% | 784,683 | 5.4% |
[ 99.0% - 99.5% ] 99.24% | 426,470 | 7.2% |