White/Caucasian No Schooling Completed
COMPARE
White/Caucasian
Select to Compare
No Schooling Completed
White/Caucasian No Schooling Completed
1.6%
NO SCHOOLING
99.9/ 100
METRIC RATING
49th/ 347
METRIC RANK
White/Caucasian No Schooling Completed Correlation Chart
The statistical analysis conducted on geographies consisting of 562,623,303 people shows a strong negative correlation between the proportion of Whites/Caucasians and percentage of population with no schooling in the United States with a correlation coefficient (R) of -0.745 and weighted average of 1.6%. On average, for every 1% (one percent) increase in Whites/Caucasians within a typical geography, there is a decrease of 0.029% in percentage of population with no schooling.
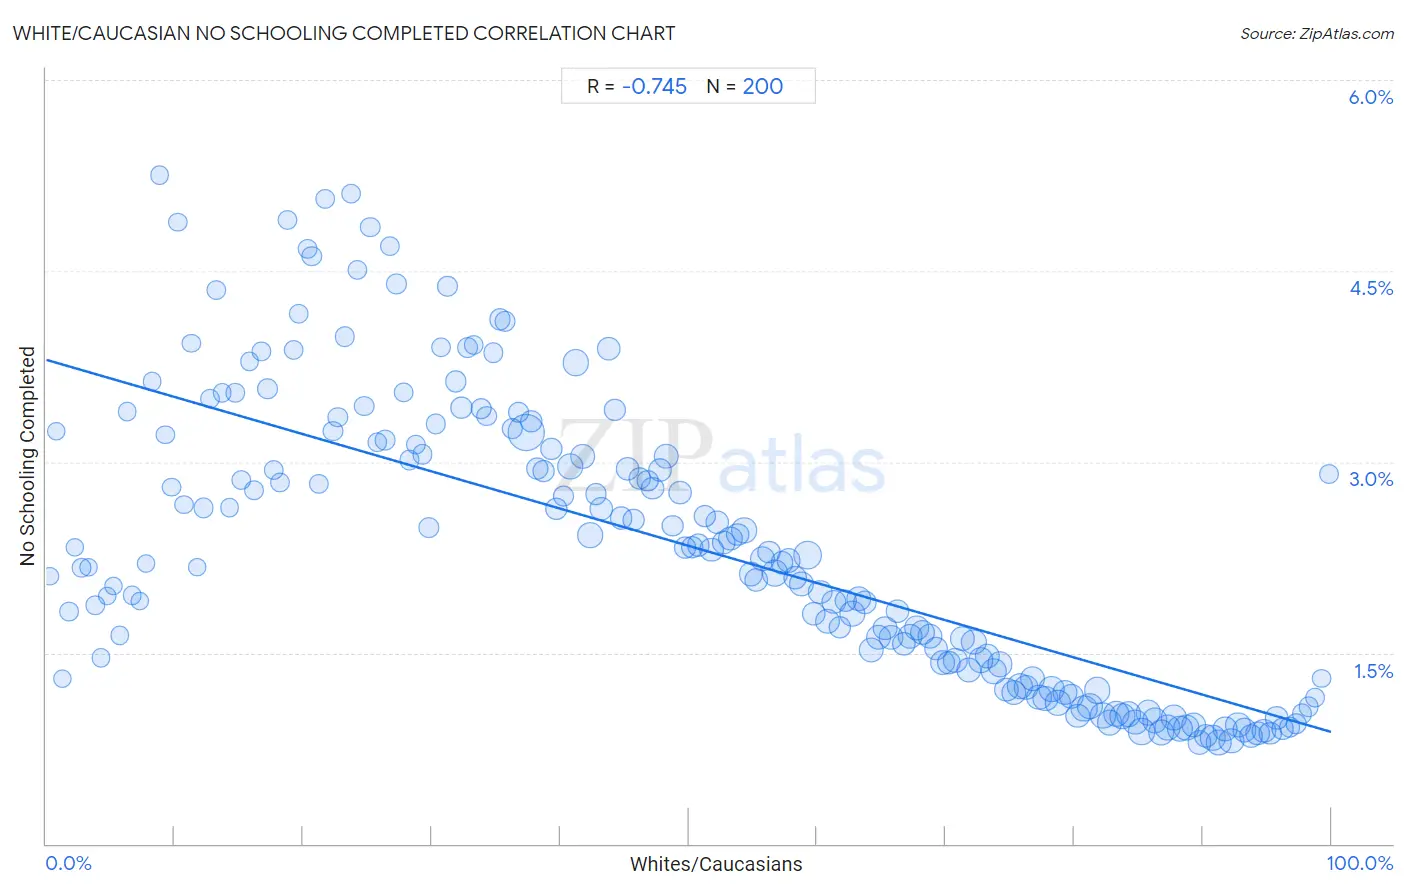
It is essential to understand that the correlation between the percentage of Whites/Caucasians and percentage of population with no schooling does not imply a direct cause-and-effect relationship. It remains uncertain whether the presence of Whites/Caucasians influences an upward or downward trend in the level of percentage of population with no schooling within an area, or if Whites/Caucasians simply ended up residing in those areas with higher or lower levels of percentage of population with no schooling due to other factors.
Demographics Similar to Whites/Caucasians by No Schooling Completed
In terms of no schooling completed, the demographic groups most similar to Whites/Caucasians are Immigrants from Scotland (1.6%, a difference of 0.060%), Celtic (1.6%, a difference of 0.13%), Ottawa (1.6%, a difference of 0.31%), Chippewa (1.6%, a difference of 0.34%), and Immigrants from Canada (1.6%, a difference of 0.41%).
| Demographics | Rating | Rank | No Schooling Completed |
| Bulgarians | 99.9 /100 | #42 | Exceptional 1.6% |
| Australians | 99.9 /100 | #43 | Exceptional 1.6% |
| Estonians | 99.9 /100 | #44 | Exceptional 1.6% |
| Czechoslovakians | 99.9 /100 | #45 | Exceptional 1.6% |
| Maltese | 99.9 /100 | #46 | Exceptional 1.6% |
| Ottawa | 99.9 /100 | #47 | Exceptional 1.6% |
| Immigrants from Scotland | 99.9 /100 | #48 | Exceptional 1.6% |
| Whites/Caucasians | 99.9 /100 | #49 | Exceptional 1.6% |
| Celtics | 99.9 /100 | #50 | Exceptional 1.6% |
| Chippewa | 99.8 /100 | #51 | Exceptional 1.6% |
| Immigrants from Canada | 99.8 /100 | #52 | Exceptional 1.6% |
| Creek | 99.8 /100 | #53 | Exceptional 1.6% |
| Crow | 99.8 /100 | #54 | Exceptional 1.6% |
| Greeks | 99.8 /100 | #55 | Exceptional 1.6% |
| Immigrants from North America | 99.8 /100 | #56 | Exceptional 1.6% |
White/Caucasian No Schooling Completed Correlation Summary
| Measurement | White/Caucasian Data | No Schooling Completed Data |
| Minimum | 0.32% | 0.80% |
| Maximum | 99.8% | 5.2% |
| Range | 99.5% | 4.5% |
| Mean | 50.0% | 2.3% |
| Median | 50.0% | 2.2% |
| Interquartile 25% (IQ1) | 25.0% | 1.3% |
| Interquartile 75% (IQ3) | 75.0% | 3.2% |
| Interquartile Range (IQR) | 50.0% | 1.9% |
| Standard Deviation (Sample) | 28.9% | 1.1% |
| Standard Deviation (Population) | 28.9% | 1.1% |
Correlation Details
| White/Caucasian Percentile | Sample Size | No Schooling Completed |
[ 0.0% - 0.5% ] 0.32% | 46,456 | 2.1% |
[ 0.5% - 1.0% ] 0.80% | 57,519 | 3.2% |
[ 1.0% - 1.5% ] 1.26% | 155,174 | 1.3% |
[ 1.5% - 2.0% ] 1.77% | 445,713 | 1.8% |
[ 2.0% - 2.5% ] 2.21% | 293,766 | 2.3% |
[ 2.5% - 3.0% ] 2.76% | 520,817 | 2.2% |
[ 3.0% - 3.5% ] 3.26% | 339,335 | 2.2% |
[ 3.5% - 4.0% ] 3.80% | 495,068 | 1.9% |
[ 4.0% - 4.5% ] 4.25% | 452,887 | 1.5% |
[ 4.5% - 5.0% ] 4.75% | 418,904 | 1.9% |
[ 5.0% - 5.5% ] 5.23% | 419,777 | 2.0% |
[ 5.5% - 6.0% ] 5.75% | 357,502 | 1.6% |
[ 6.0% - 6.5% ] 6.28% | 431,119 | 3.4% |
[ 6.5% - 7.0% ] 6.68% | 415,924 | 1.9% |
[ 7.0% - 7.5% ] 7.30% | 342,554 | 1.9% |
[ 7.5% - 8.0% ] 7.78% | 333,958 | 2.2% |
[ 8.0% - 8.5% ] 8.24% | 558,201 | 3.6% |
[ 8.5% - 9.0% ] 8.81% | 655,388 | 5.2% |
[ 9.0% - 9.5% ] 9.25% | 375,681 | 3.2% |
[ 9.5% - 10.0% ] 9.74% | 483,510 | 2.8% |
[ 10.0% - 10.5% ] 10.22% | 432,509 | 4.9% |
[ 10.5% - 11.0% ] 10.73% | 504,437 | 2.7% |
[ 11.0% - 11.5% ] 11.28% | 724,182 | 3.9% |
[ 11.5% - 12.0% ] 11.75% | 461,849 | 2.2% |
[ 12.0% - 12.5% ] 12.21% | 1,169,186 | 2.6% |
[ 12.5% - 13.0% ] 12.75% | 893,636 | 3.5% |
[ 13.0% - 13.5% ] 13.27% | 797,736 | 4.3% |
[ 13.5% - 14.0% ] 13.70% | 430,738 | 3.5% |
[ 14.0% - 14.5% ] 14.27% | 702,724 | 2.6% |
[ 14.5% - 15.0% ] 14.70% | 496,256 | 3.5% |
[ 15.0% - 15.5% ] 15.17% | 860,753 | 2.9% |
[ 15.5% - 16.0% ] 15.81% | 702,600 | 3.8% |
[ 16.0% - 16.5% ] 16.15% | 531,959 | 2.8% |
[ 16.5% - 17.0% ] 16.76% | 689,563 | 3.9% |
[ 17.0% - 17.5% ] 17.25% | 1,671,996 | 3.6% |
[ 17.5% - 18.0% ] 17.71% | 871,777 | 2.9% |
[ 18.0% - 18.5% ] 18.21% | 913,571 | 2.8% |
[ 18.5% - 19.0% ] 18.75% | 948,485 | 4.9% |
[ 19.0% - 19.5% ] 19.26% | 999,784 | 3.9% |
[ 19.5% - 20.0% ] 19.69% | 907,772 | 4.2% |
[ 20.0% - 20.5% ] 20.31% | 753,575 | 4.7% |
[ 20.5% - 21.0% ] 20.67% | 976,022 | 4.6% |
[ 21.0% - 21.5% ] 21.23% | 738,541 | 2.8% |
[ 21.5% - 22.0% ] 21.70% | 684,822 | 5.1% |
[ 22.0% - 22.5% ] 22.31% | 1,086,627 | 3.2% |
[ 22.5% - 23.0% ] 22.71% | 1,267,843 | 3.4% |
[ 23.0% - 23.5% ] 23.23% | 1,188,079 | 4.0% |
[ 23.5% - 24.0% ] 23.75% | 1,055,916 | 5.1% |
[ 24.0% - 24.5% ] 24.24% | 1,071,885 | 4.5% |
[ 24.5% - 25.0% ] 24.75% | 1,117,871 | 3.4% |
[ 25.0% - 25.5% ] 25.23% | 1,371,546 | 4.8% |
[ 25.5% - 26.0% ] 25.75% | 1,159,553 | 3.2% |
[ 26.0% - 26.5% ] 26.33% | 1,579,075 | 3.2% |
[ 26.5% - 27.0% ] 26.74% | 1,032,142 | 4.7% |
[ 27.0% - 27.5% ] 27.26% | 1,461,086 | 4.4% |
[ 27.5% - 28.0% ] 27.81% | 1,021,219 | 3.5% |
[ 28.0% - 28.5% ] 28.27% | 1,647,181 | 3.0% |
[ 28.5% - 29.0% ] 28.77% | 1,412,864 | 3.1% |
[ 29.0% - 29.5% ] 29.28% | 974,876 | 3.1% |
[ 29.5% - 30.0% ] 29.74% | 1,619,477 | 2.5% |
[ 30.0% - 30.5% ] 30.32% | 1,508,999 | 3.3% |
[ 30.5% - 31.0% ] 30.75% | 1,161,814 | 3.9% |
[ 31.0% - 31.5% ] 31.24% | 1,700,390 | 4.4% |
[ 31.5% - 32.0% ] 31.87% | 2,358,902 | 3.6% |
[ 32.0% - 32.5% ] 32.29% | 2,337,179 | 3.4% |
[ 32.5% - 33.0% ] 32.77% | 1,601,226 | 3.9% |
[ 33.0% - 33.5% ] 33.26% | 942,515 | 3.9% |
[ 33.5% - 34.0% ] 33.82% | 1,874,506 | 3.4% |
[ 34.0% - 34.5% ] 34.27% | 1,158,249 | 3.4% |
[ 34.5% - 35.0% ] 34.79% | 1,430,015 | 3.9% |
[ 35.0% - 35.5% ] 35.27% | 1,810,568 | 4.1% |
[ 35.5% - 36.0% ] 35.73% | 1,641,333 | 4.1% |
[ 36.0% - 36.5% ] 36.25% | 1,945,636 | 3.3% |
[ 36.5% - 37.0% ] 36.75% | 2,018,085 | 3.4% |
[ 37.0% - 37.5% ] 37.37% | 12,668,217 | 3.2% |
[ 37.5% - 38.0% ] 37.71% | 2,487,522 | 3.3% |
[ 38.0% - 38.5% ] 38.24% | 2,863,606 | 2.9% |
[ 38.5% - 39.0% ] 38.72% | 2,782,294 | 2.9% |
[ 39.0% - 39.5% ] 39.28% | 2,403,037 | 3.1% |
[ 39.5% - 40.0% ] 39.72% | 2,486,337 | 2.6% |
[ 40.0% - 40.5% ] 40.24% | 1,992,472 | 2.7% |
[ 40.5% - 41.0% ] 40.78% | 4,829,871 | 3.0% |
[ 41.0% - 41.5% ] 41.21% | 5,703,857 | 3.8% |
[ 41.5% - 42.0% ] 41.77% | 4,019,631 | 3.0% |
[ 42.0% - 42.5% ] 42.32% | 4,831,398 | 2.4% |
[ 42.5% - 43.0% ] 42.76% | 2,115,081 | 2.7% |
[ 43.0% - 43.5% ] 43.19% | 3,409,294 | 2.6% |
[ 43.5% - 44.0% ] 43.79% | 3,462,328 | 3.9% |
[ 44.0% - 44.5% ] 44.24% | 2,762,282 | 3.4% |
[ 44.5% - 45.0% ] 44.74% | 2,709,366 | 2.6% |
[ 45.0% - 45.5% ] 45.27% | 3,298,434 | 2.9% |
[ 45.5% - 46.0% ] 45.71% | 2,754,228 | 2.5% |
[ 46.0% - 46.5% ] 46.21% | 2,967,901 | 2.9% |
[ 46.5% - 47.0% ] 46.77% | 2,373,694 | 2.9% |
[ 47.0% - 47.5% ] 47.21% | 3,315,657 | 2.8% |
[ 47.5% - 48.0% ] 47.75% | 3,336,401 | 2.9% |
[ 48.0% - 48.5% ] 48.24% | 4,279,158 | 3.0% |
[ 48.5% - 49.0% ] 48.73% | 2,375,832 | 2.5% |
[ 49.0% - 49.5% ] 49.29% | 3,288,139 | 2.8% |
[ 49.5% - 50.0% ] 49.74% | 2,462,168 | 2.3% |
[ 50.0% - 50.5% ] 50.26% | 2,932,116 | 2.3% |
[ 50.5% - 51.0% ] 50.75% | 3,195,974 | 2.3% |
[ 51.0% - 51.5% ] 51.23% | 2,785,830 | 2.6% |
[ 51.5% - 52.0% ] 51.79% | 3,754,653 | 2.3% |
[ 52.0% - 52.5% ] 52.20% | 3,750,792 | 2.5% |
[ 52.5% - 53.0% ] 52.77% | 3,411,411 | 2.4% |
[ 53.0% - 53.5% ] 53.23% | 3,638,501 | 2.4% |
[ 53.5% - 54.0% ] 53.78% | 3,195,402 | 2.4% |
[ 54.0% - 54.5% ] 54.32% | 4,549,484 | 2.5% |
[ 54.5% - 55.0% ] 54.82% | 3,876,565 | 2.1% |
[ 55.0% - 55.5% ] 55.28% | 3,464,353 | 2.1% |
[ 55.5% - 56.0% ] 55.75% | 4,276,367 | 2.2% |
[ 56.0% - 56.5% ] 56.24% | 3,101,920 | 2.3% |
[ 56.5% - 57.0% ] 56.71% | 5,183,295 | 2.1% |
[ 57.0% - 57.5% ] 57.25% | 3,173,868 | 2.2% |
[ 57.5% - 58.0% ] 57.74% | 3,576,026 | 2.2% |
[ 58.0% - 58.5% ] 58.26% | 3,183,524 | 2.1% |
[ 58.5% - 59.0% ] 58.75% | 4,000,937 | 2.0% |
[ 59.0% - 59.5% ] 59.26% | 6,583,545 | 2.3% |
[ 59.5% - 60.0% ] 59.75% | 3,403,363 | 1.8% |
[ 60.0% - 60.5% ] 60.24% | 4,039,307 | 2.0% |
[ 60.5% - 61.0% ] 60.75% | 4,222,436 | 1.7% |
[ 61.0% - 61.5% ] 61.31% | 4,200,595 | 1.9% |
[ 61.5% - 62.0% ] 61.77% | 2,814,977 | 1.7% |
[ 62.0% - 62.5% ] 62.23% | 3,243,386 | 1.9% |
[ 62.5% - 63.0% ] 62.76% | 5,241,678 | 1.8% |
[ 63.0% - 63.5% ] 63.24% | 4,257,613 | 1.9% |
[ 63.5% - 64.0% ] 63.73% | 3,573,646 | 1.9% |
[ 64.0% - 64.5% ] 64.23% | 4,287,142 | 1.5% |
[ 64.5% - 65.0% ] 64.77% | 4,585,595 | 1.6% |
[ 65.0% - 65.5% ] 65.30% | 4,146,296 | 1.7% |
[ 65.5% - 66.0% ] 65.73% | 4,490,179 | 1.6% |
[ 66.0% - 66.5% ] 66.26% | 3,449,101 | 1.8% |
[ 66.5% - 67.0% ] 66.78% | 3,317,871 | 1.6% |
[ 67.0% - 67.5% ] 67.25% | 4,149,782 | 1.6% |
[ 67.5% - 68.0% ] 67.75% | 3,640,154 | 1.7% |
[ 68.0% - 68.5% ] 68.23% | 4,312,328 | 1.7% |
[ 68.5% - 69.0% ] 68.77% | 4,298,917 | 1.6% |
[ 69.0% - 69.5% ] 69.23% | 3,638,207 | 1.5% |
[ 69.5% - 70.0% ] 69.76% | 4,124,487 | 1.4% |
[ 70.0% - 70.5% ] 70.24% | 3,266,080 | 1.4% |
[ 70.5% - 71.0% ] 70.73% | 3,763,232 | 1.4% |
[ 71.0% - 71.5% ] 71.27% | 4,409,917 | 1.6% |
[ 71.5% - 72.0% ] 71.76% | 4,224,228 | 1.4% |
[ 72.0% - 72.5% ] 72.22% | 4,949,415 | 1.6% |
[ 72.5% - 73.0% ] 72.72% | 4,851,863 | 1.4% |
[ 73.0% - 73.5% ] 73.26% | 4,482,221 | 1.5% |
[ 73.5% - 74.0% ] 73.74% | 5,052,077 | 1.4% |
[ 74.0% - 74.5% ] 74.24% | 4,388,282 | 1.4% |
[ 74.5% - 75.0% ] 74.75% | 3,962,673 | 1.2% |
[ 75.0% - 75.5% ] 75.27% | 4,147,789 | 1.2% |
[ 75.5% - 76.0% ] 75.73% | 5,187,399 | 1.2% |
[ 76.0% - 76.5% ] 76.24% | 4,448,009 | 1.2% |
[ 76.5% - 77.0% ] 76.75% | 4,319,147 | 1.3% |
[ 77.0% - 77.5% ] 77.25% | 4,664,247 | 1.2% |
[ 77.5% - 78.0% ] 77.75% | 4,548,357 | 1.1% |
[ 78.0% - 78.5% ] 78.26% | 4,629,619 | 1.2% |
[ 78.5% - 79.0% ] 78.74% | 4,680,786 | 1.1% |
[ 79.0% - 79.5% ] 79.24% | 4,291,749 | 1.2% |
[ 79.5% - 80.0% ] 79.75% | 4,103,823 | 1.2% |
[ 80.0% - 80.5% ] 80.25% | 3,990,365 | 1.0% |
[ 80.5% - 81.0% ] 80.75% | 5,455,093 | 1.1% |
[ 81.0% - 81.5% ] 81.26% | 5,178,804 | 1.1% |
[ 81.5% - 82.0% ] 81.77% | 5,465,547 | 1.2% |
[ 82.0% - 82.5% ] 82.25% | 4,385,622 | 1.0% |
[ 82.5% - 83.0% ] 82.75% | 4,865,539 | 0.95% |
[ 83.0% - 83.5% ] 83.25% | 4,972,914 | 1.0% |
[ 83.5% - 84.0% ] 83.74% | 5,195,922 | 1.0% |
[ 84.0% - 84.5% ] 84.25% | 4,546,103 | 1.0% |
[ 84.5% - 85.0% ] 84.75% | 4,789,886 | 0.95% |
[ 85.0% - 85.5% ] 85.23% | 5,526,177 | 0.88% |
[ 85.5% - 86.0% ] 85.76% | 4,906,343 | 1.0% |
[ 86.0% - 86.5% ] 86.25% | 4,513,973 | 0.97% |
[ 86.5% - 87.0% ] 86.73% | 5,129,925 | 0.87% |
[ 87.0% - 87.5% ] 87.26% | 5,019,740 | 0.91% |
[ 87.5% - 88.0% ] 87.75% | 5,031,270 | 0.99% |
[ 88.0% - 88.5% ] 88.26% | 5,192,118 | 0.91% |
[ 88.5% - 89.0% ] 88.75% | 4,969,867 | 0.91% |
[ 89.0% - 89.5% ] 89.25% | 4,335,914 | 0.93% |
[ 89.5% - 90.0% ] 89.74% | 4,188,599 | 0.80% |
[ 90.0% - 90.5% ] 90.25% | 3,904,050 | 0.85% |
[ 90.5% - 91.0% ] 90.76% | 4,749,559 | 0.83% |
[ 91.0% - 91.5% ] 91.25% | 5,116,176 | 0.80% |
[ 91.5% - 92.0% ] 91.75% | 4,019,670 | 0.90% |
[ 92.0% - 92.5% ] 92.24% | 4,821,576 | 0.81% |
[ 92.5% - 93.0% ] 92.75% | 4,419,033 | 0.93% |
[ 93.0% - 93.5% ] 93.24% | 4,165,674 | 0.90% |
[ 93.5% - 94.0% ] 93.76% | 3,696,748 | 0.85% |
[ 94.0% - 94.5% ] 94.25% | 3,998,986 | 0.87% |
[ 94.5% - 95.0% ] 94.75% | 3,929,241 | 0.89% |
[ 95.0% - 95.5% ] 95.25% | 3,111,606 | 0.87% |
[ 95.5% - 96.0% ] 95.76% | 2,845,624 | 0.99% |
[ 96.0% - 96.5% ] 96.25% | 2,428,205 | 0.91% |
[ 96.5% - 97.0% ] 96.75% | 2,135,625 | 0.92% |
[ 97.0% - 97.5% ] 97.25% | 1,830,948 | 0.94% |
[ 97.5% - 98.0% ] 97.73% | 1,573,576 | 1.0% |
[ 98.0% - 98.5% ] 98.25% | 1,047,750 | 1.1% |
[ 98.5% - 99.0% ] 98.71% | 754,843 | 1.1% |
[ 99.0% - 99.5% ] 99.24% | 452,169 | 1.3% |
[ 99.5% - 100.0% ] 99.85% | 521,399 | 2.9% |