White/Caucasian Per Capita Income
COMPARE
White/Caucasian
Select to Compare
Per Capita Income
White/Caucasian Per Capita Income
$42,180
PER CAPITA INCOME
15.9/ 100
METRIC RATING
205th/ 347
METRIC RANK
White/Caucasian Per Capita Income Correlation Chart
The statistical analysis conducted on geographies consisting of 585,276,990 people shows a strong positive correlation between the proportion of Whites/Caucasians and per capita income in the United States with a correlation coefficient (R) of 0.779 and weighted average of $42,180. On average, for every 1% (one percent) increase in Whites/Caucasians within a typical geography, there is an increase of $184 in per capita income.
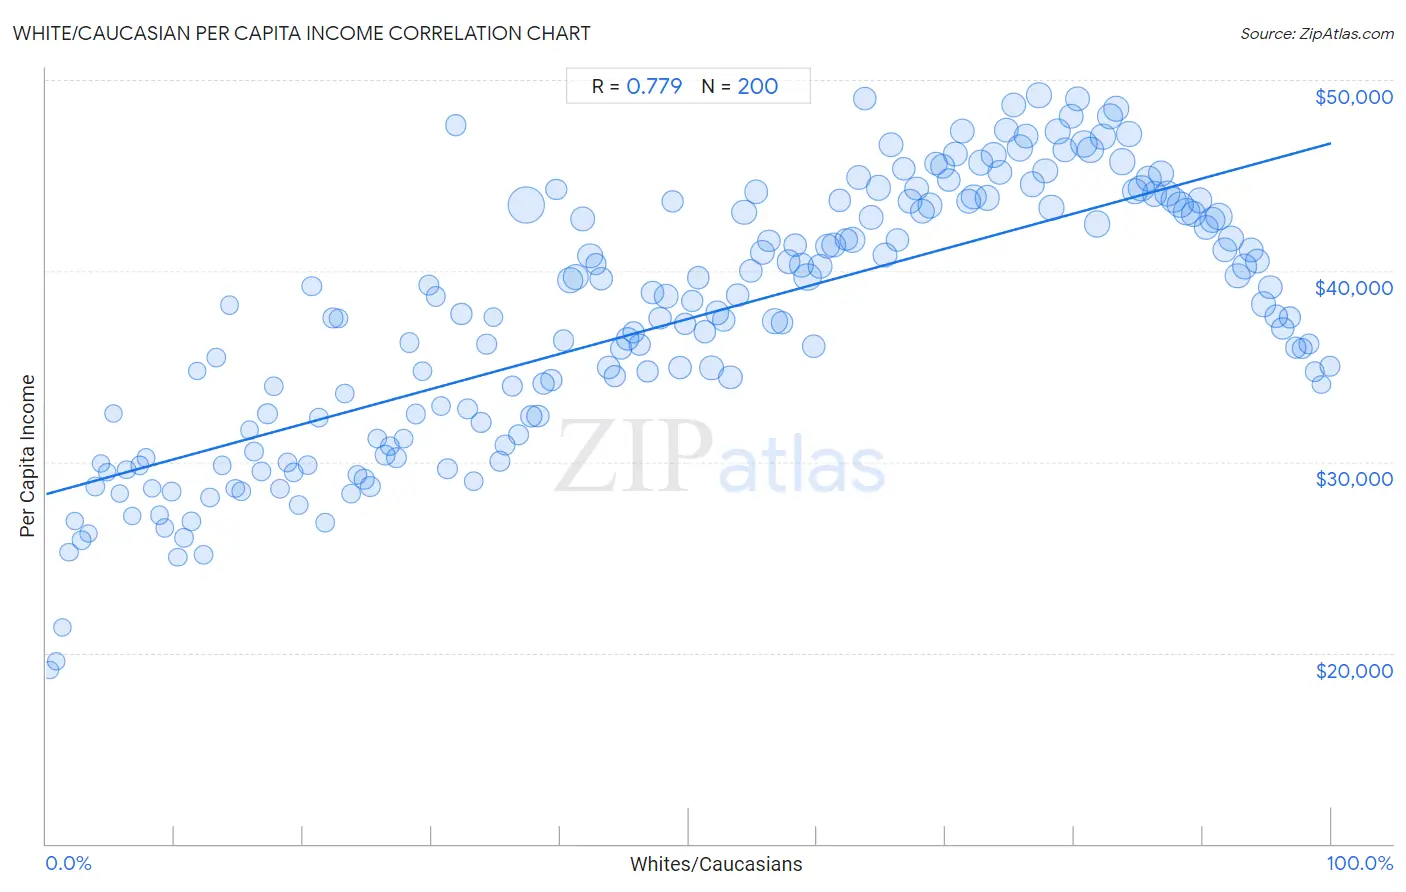
It is essential to understand that the correlation between the percentage of Whites/Caucasians and per capita income does not imply a direct cause-and-effect relationship. It remains uncertain whether the presence of Whites/Caucasians influences an upward or downward trend in the level of per capita income within an area, or if Whites/Caucasians simply ended up residing in those areas with higher or lower levels of per capita income due to other factors.
Demographics Similar to Whites/Caucasians by Per Capita Income
In terms of per capita income, the demographic groups most similar to Whites/Caucasians are Ghanaian ($42,164, a difference of 0.040%), Aleut ($42,210, a difference of 0.070%), Spanish ($42,249, a difference of 0.16%), Immigrants from Bosnia and Herzegovina ($42,278, a difference of 0.23%), and Venezuelan ($42,074, a difference of 0.25%).
| Demographics | Rating | Rank | Per Capita Income |
| Immigrants from Portugal | 19.7 /100 | #198 | Poor $42,412 |
| Barbadians | 19.6 /100 | #199 | Poor $42,406 |
| Vietnamese | 19.0 /100 | #200 | Poor $42,368 |
| Immigrants from Thailand | 17.6 /100 | #201 | Poor $42,289 |
| Immigrants from Bosnia and Herzegovina | 17.5 /100 | #202 | Poor $42,278 |
| Spanish | 17.0 /100 | #203 | Poor $42,249 |
| Aleuts | 16.4 /100 | #204 | Poor $42,210 |
| Whites/Caucasians | 15.9 /100 | #205 | Poor $42,180 |
| Ghanaians | 15.7 /100 | #206 | Poor $42,164 |
| Venezuelans | 14.4 /100 | #207 | Poor $42,074 |
| Panamanians | 13.9 /100 | #208 | Poor $42,035 |
| Immigrants from Sudan | 13.2 /100 | #209 | Poor $41,986 |
| Ecuadorians | 12.9 /100 | #210 | Poor $41,958 |
| Immigrants from Panama | 11.6 /100 | #211 | Poor $41,853 |
| Immigrants from Senegal | 11.3 /100 | #212 | Poor $41,830 |
White/Caucasian Per Capita Income Correlation Summary
| Measurement | White/Caucasian Data | Per Capita Income Data |
| Minimum | 0.32% | $19,081 |
| Maximum | 99.9% | $49,196 |
| Range | 99.6% | $30,115 |
| Mean | 50.0% | $37,504 |
| Median | 50.0% | $37,771 |
| Interquartile 25% (IQ1) | 25.0% | $31,862 |
| Interquartile 75% (IQ3) | 75.0% | $43,459 |
| Interquartile Range (IQR) | 50.0% | $11,597 |
| Standard Deviation (Sample) | 28.9% | $6,823 |
| Standard Deviation (Population) | 28.9% | $6,806 |
Correlation Details
| White/Caucasian Percentile | Sample Size | Per Capita Income |
[ 0.0% - 0.5% ] 0.32% | 63,492 | $19,081 |
[ 0.5% - 1.0% ] 0.79% | 72,993 | $19,537 |
[ 1.0% - 1.5% ] 1.26% | 178,395 | $21,350 |
[ 1.5% - 2.0% ] 1.77% | 472,918 | $25,265 |
[ 2.0% - 2.5% ] 2.21% | 315,822 | $26,906 |
[ 2.5% - 3.0% ] 2.76% | 535,293 | $25,889 |
[ 3.0% - 3.5% ] 3.26% | 353,662 | $26,245 |
[ 3.5% - 4.0% ] 3.79% | 518,737 | $28,719 |
[ 4.0% - 4.5% ] 4.25% | 461,256 | $29,913 |
[ 4.5% - 5.0% ] 4.75% | 434,709 | $29,463 |
[ 5.0% - 5.5% ] 5.23% | 439,213 | $32,533 |
[ 5.5% - 6.0% ] 5.75% | 363,360 | $28,354 |
[ 6.0% - 6.5% ] 6.27% | 452,458 | $29,574 |
[ 6.5% - 7.0% ] 6.68% | 429,342 | $27,174 |
[ 7.0% - 7.5% ] 7.30% | 356,304 | $29,820 |
[ 7.5% - 8.0% ] 7.78% | 343,423 | $30,204 |
[ 8.0% - 8.5% ] 8.24% | 574,618 | $28,600 |
[ 8.5% - 9.0% ] 8.81% | 673,144 | $27,199 |
[ 9.0% - 9.5% ] 9.25% | 387,339 | $26,531 |
[ 9.5% - 10.0% ] 9.74% | 493,244 | $28,438 |
[ 10.0% - 10.5% ] 10.22% | 441,041 | $25,010 |
[ 10.5% - 11.0% ] 10.73% | 512,628 | $26,019 |
[ 11.0% - 11.5% ] 11.28% | 728,428 | $26,859 |
[ 11.5% - 12.0% ] 11.75% | 475,985 | $34,755 |
[ 12.0% - 12.5% ] 12.21% | 1,177,998 | $25,147 |
[ 12.5% - 13.0% ] 12.75% | 906,674 | $28,128 |
[ 13.0% - 13.5% ] 13.27% | 801,242 | $35,465 |
[ 13.5% - 14.0% ] 13.70% | 437,752 | $29,805 |
[ 14.0% - 14.5% ] 14.27% | 712,096 | $38,185 |
[ 14.5% - 15.0% ] 14.71% | 512,685 | $28,623 |
[ 15.0% - 15.5% ] 15.17% | 878,839 | $28,431 |
[ 15.5% - 16.0% ] 15.81% | 706,440 | $31,649 |
[ 16.0% - 16.5% ] 16.15% | 546,314 | $30,559 |
[ 16.5% - 17.0% ] 16.76% | 691,271 | $29,505 |
[ 17.0% - 17.5% ] 17.25% | 1,694,015 | $32,536 |
[ 17.5% - 18.0% ] 17.71% | 878,529 | $33,937 |
[ 18.0% - 18.5% ] 18.21% | 920,077 | $28,597 |
[ 18.5% - 19.0% ] 18.75% | 954,353 | $29,945 |
[ 19.0% - 19.5% ] 19.26% | 1,003,894 | $29,437 |
[ 19.5% - 20.0% ] 19.69% | 919,363 | $27,718 |
[ 20.0% - 20.5% ] 20.31% | 760,129 | $29,848 |
[ 20.5% - 21.0% ] 20.67% | 994,629 | $39,225 |
[ 21.0% - 21.5% ] 21.23% | 742,203 | $32,303 |
[ 21.5% - 22.0% ] 21.70% | 689,347 | $26,806 |
[ 22.0% - 22.5% ] 22.31% | 1,096,220 | $37,530 |
[ 22.5% - 23.0% ] 22.71% | 1,276,226 | $37,528 |
[ 23.0% - 23.5% ] 23.23% | 1,198,962 | $33,570 |
[ 23.5% - 24.0% ] 23.75% | 1,062,025 | $28,356 |
[ 24.0% - 24.5% ] 24.24% | 1,085,324 | $29,310 |
[ 24.5% - 25.0% ] 24.75% | 1,125,229 | $29,093 |
[ 25.0% - 25.5% ] 25.23% | 1,378,906 | $28,693 |
[ 25.5% - 26.0% ] 25.75% | 1,168,808 | $31,233 |
[ 26.0% - 26.5% ] 26.33% | 1,593,830 | $30,350 |
[ 26.5% - 27.0% ] 26.74% | 1,062,620 | $30,805 |
[ 27.0% - 27.5% ] 27.26% | 1,472,782 | $30,212 |
[ 27.5% - 28.0% ] 27.80% | 1,029,053 | $31,203 |
[ 28.0% - 28.5% ] 28.27% | 1,656,122 | $36,257 |
[ 28.5% - 29.0% ] 28.77% | 1,424,686 | $32,502 |
[ 29.0% - 29.5% ] 29.28% | 994,695 | $34,776 |
[ 29.5% - 30.0% ] 29.74% | 1,625,737 | $39,245 |
[ 30.0% - 30.5% ] 30.32% | 1,529,258 | $38,684 |
[ 30.5% - 31.0% ] 30.75% | 1,178,565 | $32,912 |
[ 31.0% - 31.5% ] 31.24% | 1,710,978 | $29,649 |
[ 31.5% - 32.0% ] 31.87% | 2,370,553 | $47,631 |
[ 32.0% - 32.5% ] 32.29% | 2,347,180 | $37,737 |
[ 32.5% - 33.0% ] 32.77% | 1,608,423 | $32,773 |
[ 33.0% - 33.5% ] 33.27% | 951,910 | $28,991 |
[ 33.5% - 34.0% ] 33.82% | 1,896,067 | $32,075 |
[ 34.0% - 34.5% ] 34.27% | 1,173,102 | $36,159 |
[ 34.5% - 35.0% ] 34.79% | 1,437,687 | $37,581 |
[ 35.0% - 35.5% ] 35.27% | 1,823,413 | $30,032 |
[ 35.5% - 36.0% ] 35.73% | 1,669,666 | $30,887 |
[ 36.0% - 36.5% ] 36.25% | 1,979,294 | $33,970 |
[ 36.5% - 37.0% ] 36.75% | 2,029,122 | $31,419 |
[ 37.0% - 37.5% ] 37.37% | 12,684,491 | $43,448 |
[ 37.5% - 38.0% ] 37.71% | 2,498,275 | $32,414 |
[ 38.0% - 38.5% ] 38.24% | 2,894,171 | $32,418 |
[ 38.5% - 39.0% ] 38.72% | 2,817,487 | $34,124 |
[ 39.0% - 39.5% ] 39.28% | 2,422,608 | $34,291 |
[ 39.5% - 40.0% ] 39.72% | 2,520,975 | $44,271 |
[ 40.0% - 40.5% ] 40.24% | 2,012,471 | $36,368 |
[ 40.5% - 41.0% ] 40.78% | 4,872,676 | $39,538 |
[ 41.0% - 41.5% ] 41.21% | 5,726,749 | $39,688 |
[ 41.5% - 42.0% ] 41.77% | 4,036,506 | $42,746 |
[ 42.0% - 42.5% ] 42.32% | 4,859,070 | $40,802 |
[ 42.5% - 43.0% ] 42.76% | 2,129,144 | $40,365 |
[ 43.0% - 43.5% ] 43.19% | 3,456,158 | $39,623 |
[ 43.5% - 44.0% ] 43.79% | 3,482,818 | $34,959 |
[ 44.0% - 44.5% ] 44.24% | 2,779,032 | $34,500 |
[ 44.5% - 45.0% ] 44.74% | 2,734,428 | $35,905 |
[ 45.0% - 45.5% ] 45.27% | 3,318,259 | $36,428 |
[ 45.5% - 46.0% ] 45.71% | 2,789,669 | $36,787 |
[ 46.0% - 46.5% ] 46.21% | 2,991,415 | $36,142 |
[ 46.5% - 47.0% ] 46.77% | 2,394,435 | $34,724 |
[ 47.0% - 47.5% ] 47.21% | 3,363,070 | $38,872 |
[ 47.5% - 48.0% ] 47.75% | 3,360,216 | $37,526 |
[ 48.0% - 48.5% ] 48.24% | 4,310,267 | $38,656 |
[ 48.5% - 49.0% ] 48.73% | 2,404,419 | $43,653 |
[ 49.0% - 49.5% ] 49.29% | 3,339,893 | $34,931 |
[ 49.5% - 50.0% ] 49.74% | 2,480,339 | $37,208 |
[ 50.0% - 50.5% ] 50.26% | 2,962,385 | $38,418 |
[ 50.5% - 51.0% ] 50.75% | 3,228,497 | $39,643 |
[ 51.0% - 51.5% ] 51.23% | 2,810,891 | $36,811 |
[ 51.5% - 52.0% ] 51.79% | 3,783,669 | $34,914 |
[ 52.0% - 52.5% ] 52.21% | 3,801,047 | $37,805 |
[ 52.5% - 53.0% ] 52.76% | 3,460,489 | $37,421 |
[ 53.0% - 53.5% ] 53.23% | 3,672,477 | $34,422 |
[ 53.5% - 54.0% ] 53.78% | 3,238,044 | $38,754 |
[ 54.0% - 54.5% ] 54.32% | 4,583,335 | $43,056 |
[ 54.5% - 55.0% ] 54.82% | 3,931,293 | $39,994 |
[ 55.0% - 55.5% ] 55.28% | 3,511,730 | $44,146 |
[ 55.5% - 56.0% ] 55.75% | 4,338,601 | $40,980 |
[ 56.0% - 56.5% ] 56.24% | 3,134,122 | $41,571 |
[ 56.5% - 57.0% ] 56.71% | 5,214,222 | $37,368 |
[ 57.0% - 57.5% ] 57.25% | 3,213,662 | $37,284 |
[ 57.5% - 58.0% ] 57.74% | 3,645,981 | $40,479 |
[ 58.0% - 58.5% ] 58.26% | 3,220,720 | $41,344 |
[ 58.5% - 59.0% ] 58.75% | 4,045,041 | $40,280 |
[ 59.0% - 59.5% ] 59.26% | 6,624,233 | $39,680 |
[ 59.5% - 60.0% ] 59.75% | 3,444,585 | $36,064 |
[ 60.0% - 60.5% ] 60.24% | 4,109,325 | $40,230 |
[ 60.5% - 61.0% ] 60.76% | 4,288,537 | $41,277 |
[ 61.0% - 61.5% ] 61.31% | 4,273,591 | $41,388 |
[ 61.5% - 62.0% ] 61.77% | 2,881,222 | $43,698 |
[ 62.0% - 62.5% ] 62.23% | 3,289,029 | $41,643 |
[ 62.5% - 63.0% ] 62.76% | 5,281,194 | $41,624 |
[ 63.0% - 63.5% ] 63.24% | 4,349,194 | $44,867 |
[ 63.5% - 64.0% ] 63.72% | 3,669,251 | $49,018 |
[ 64.0% - 64.5% ] 64.23% | 4,363,358 | $42,824 |
[ 64.5% - 65.0% ] 64.76% | 4,659,186 | $44,363 |
[ 65.0% - 65.5% ] 65.30% | 4,216,928 | $40,842 |
[ 65.5% - 66.0% ] 65.73% | 4,587,595 | $46,623 |
[ 66.0% - 66.5% ] 66.26% | 3,506,245 | $41,649 |
[ 66.5% - 67.0% ] 66.78% | 3,382,606 | $45,366 |
[ 67.0% - 67.5% ] 67.25% | 4,233,872 | $43,652 |
[ 67.5% - 68.0% ] 67.75% | 3,719,465 | $44,309 |
[ 68.0% - 68.5% ] 68.23% | 4,373,934 | $43,158 |
[ 68.5% - 69.0% ] 68.77% | 4,362,865 | $43,425 |
[ 69.0% - 69.5% ] 69.23% | 3,732,186 | $45,608 |
[ 69.5% - 70.0% ] 69.76% | 4,182,693 | $45,503 |
[ 70.0% - 70.5% ] 70.24% | 3,355,811 | $44,772 |
[ 70.5% - 71.0% ] 70.73% | 3,857,229 | $46,129 |
[ 71.0% - 71.5% ] 71.27% | 4,523,733 | $47,339 |
[ 71.5% - 72.0% ] 71.76% | 4,317,735 | $43,631 |
[ 72.0% - 72.5% ] 72.23% | 5,059,399 | $43,878 |
[ 72.5% - 73.0% ] 72.72% | 4,954,249 | $45,688 |
[ 73.0% - 73.5% ] 73.26% | 4,585,933 | $43,829 |
[ 73.5% - 74.0% ] 73.74% | 5,116,767 | $46,097 |
[ 74.0% - 74.5% ] 74.24% | 4,512,677 | $45,157 |
[ 74.5% - 75.0% ] 74.75% | 4,092,737 | $47,378 |
[ 75.0% - 75.5% ] 75.27% | 4,279,889 | $48,700 |
[ 75.5% - 76.0% ] 75.73% | 5,347,684 | $46,448 |
[ 76.0% - 76.5% ] 76.24% | 4,516,181 | $47,055 |
[ 76.5% - 77.0% ] 76.75% | 4,479,238 | $44,546 |
[ 77.0% - 77.5% ] 77.25% | 4,803,563 | $49,196 |
[ 77.5% - 78.0% ] 77.75% | 4,738,663 | $45,246 |
[ 78.0% - 78.5% ] 78.26% | 4,777,061 | $43,290 |
[ 78.5% - 79.0% ] 78.74% | 4,810,433 | $47,307 |
[ 79.0% - 79.5% ] 79.24% | 4,405,259 | $46,363 |
[ 79.5% - 80.0% ] 79.75% | 4,272,033 | $48,113 |
[ 80.0% - 80.5% ] 80.25% | 4,199,890 | $49,023 |
[ 80.5% - 81.0% ] 80.75% | 5,635,335 | $46,661 |
[ 81.0% - 81.5% ] 81.26% | 5,354,591 | $46,350 |
[ 81.5% - 82.0% ] 81.77% | 5,656,530 | $42,475 |
[ 82.0% - 82.5% ] 82.25% | 4,543,524 | $47,042 |
[ 82.5% - 83.0% ] 82.75% | 5,043,219 | $48,117 |
[ 83.0% - 83.5% ] 83.25% | 5,122,999 | $48,500 |
[ 83.5% - 84.0% ] 83.75% | 5,403,368 | $45,734 |
[ 84.0% - 84.5% ] 84.25% | 4,715,202 | $47,168 |
[ 84.5% - 85.0% ] 84.75% | 5,036,088 | $44,149 |
[ 85.0% - 85.5% ] 85.23% | 5,787,478 | $44,331 |
[ 85.5% - 86.0% ] 85.76% | 5,161,033 | $44,857 |
[ 86.0% - 86.5% ] 86.25% | 4,896,188 | $44,041 |
[ 86.5% - 87.0% ] 86.74% | 5,424,892 | $45,122 |
[ 87.0% - 87.5% ] 87.26% | 5,327,803 | $44,056 |
[ 87.5% - 88.0% ] 87.75% | 5,316,173 | $43,737 |
[ 88.0% - 88.5% ] 88.26% | 5,565,191 | $43,469 |
[ 88.5% - 89.0% ] 88.75% | 5,381,549 | $43,095 |
[ 89.0% - 89.5% ] 89.25% | 4,723,257 | $42,994 |
[ 89.5% - 90.0% ] 89.75% | 4,573,378 | $43,694 |
[ 90.0% - 90.5% ] 90.25% | 4,342,888 | $42,306 |
[ 90.5% - 91.0% ] 90.76% | 5,250,485 | $42,675 |
[ 91.0% - 91.5% ] 91.25% | 5,658,916 | $42,852 |
[ 91.5% - 92.0% ] 91.75% | 4,506,872 | $41,105 |
[ 92.0% - 92.5% ] 92.24% | 5,281,280 | $41,702 |
[ 92.5% - 93.0% ] 92.75% | 4,898,470 | $39,753 |
[ 93.0% - 93.5% ] 93.24% | 4,787,835 | $40,213 |
[ 93.5% - 94.0% ] 93.75% | 4,273,963 | $41,124 |
[ 94.0% - 94.5% ] 94.25% | 4,520,252 | $40,513 |
[ 94.5% - 95.0% ] 94.75% | 4,494,943 | $38,251 |
[ 95.0% - 95.5% ] 95.26% | 3,831,716 | $39,139 |
[ 95.5% - 96.0% ] 95.76% | 3,440,244 | $37,634 |
[ 96.0% - 96.5% ] 96.25% | 3,054,827 | $36,991 |
[ 96.5% - 97.0% ] 96.75% | 2,708,180 | $37,570 |
[ 97.0% - 97.5% ] 97.25% | 2,333,308 | $35,979 |
[ 97.5% - 98.0% ] 97.74% | 2,074,894 | $35,946 |
[ 98.0% - 98.5% ] 98.25% | 1,510,374 | $36,200 |
[ 98.5% - 99.0% ] 98.73% | 1,180,648 | $34,732 |
[ 99.0% - 99.5% ] 99.24% | 731,347 | $34,048 |
[ 99.5% - 100.0% ] 99.93% | 1,753,148 | $35,031 |