Immigrants from Burma/Myanmar vs Immigrants from Australia Family Poverty
COMPARE
Immigrants from Burma/Myanmar
Immigrants from Australia
Family Poverty
Family Poverty Comparison
Immigrants from Burma/Myanmar
Immigrants from Australia
10.5%
FAMILY POVERTY
0.6/ 100
METRIC RATING
245th/ 347
METRIC RANK
7.6%
FAMILY POVERTY
99.2/ 100
METRIC RATING
41st/ 347
METRIC RANK
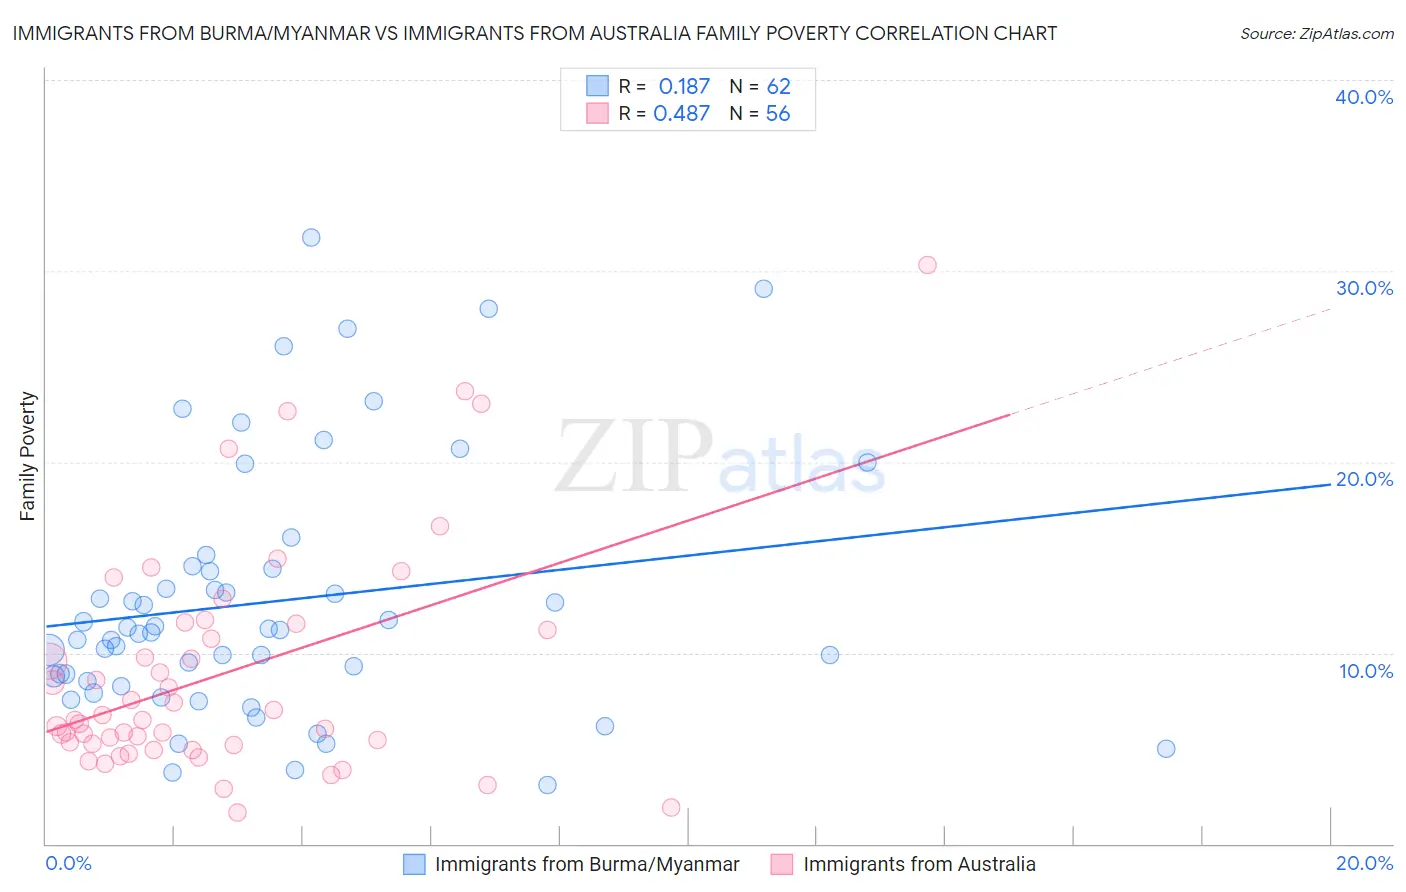
Immigrants from Burma/Myanmar vs Immigrants from Australia Family Poverty Correlation Chart
The statistical analysis conducted on geographies consisting of 172,175,970 people shows a poor positive correlation between the proportion of Immigrants from Burma/Myanmar and poverty level among families in the United States with a correlation coefficient (R) of 0.187 and weighted average of 10.5%. Similarly, the statistical analysis conducted on geographies consisting of 226,808,313 people shows a moderate positive correlation between the proportion of Immigrants from Australia and poverty level among families in the United States with a correlation coefficient (R) of 0.487 and weighted average of 7.6%, a difference of 39.1%.
Family Poverty Correlation Summary
| Measurement | Immigrants from Burma/Myanmar | Immigrants from Australia |
| Minimum | 3.0% | 1.7% |
| Maximum | 31.7% | 30.3% |
| Range | 28.7% | 28.6% |
| Mean | 12.7% | 8.9% |
| Median | 11.1% | 6.5% |
| Interquartile 25% (IQ1) | 8.5% | 5.2% |
| Interquartile 75% (IQ3) | 14.4% | 11.4% |
| Interquartile Range (IQR) | 5.8% | 6.2% |
| Standard Deviation (Sample) | 6.6% | 6.0% |
| Standard Deviation (Population) | 6.6% | 5.9% |
Similar Demographics by Family Poverty
Demographics Similar to Immigrants from Burma/Myanmar by Family Poverty
In terms of family poverty, the demographic groups most similar to Immigrants from Burma/Myanmar are Cree (10.5%, a difference of 0.61%), Cherokee (10.6%, a difference of 0.64%), Liberian (10.6%, a difference of 0.73%), Nicaraguan (10.6%, a difference of 0.93%), and Cuban (10.6%, a difference of 0.98%).
| Demographics | Rating | Rank | Family Poverty |
| French American Indians | 1.5 /100 | #238 | Tragic 10.2% |
| Potawatomi | 1.5 /100 | #239 | Tragic 10.2% |
| Immigrants | Azores | 1.4 /100 | #240 | Tragic 10.3% |
| Ghanaians | 1.3 /100 | #241 | Tragic 10.3% |
| Alaska Natives | 1.0 /100 | #242 | Tragic 10.4% |
| Nepalese | 0.8 /100 | #243 | Tragic 10.4% |
| Cree | 0.7 /100 | #244 | Tragic 10.5% |
| Immigrants | Burma/Myanmar | 0.6 /100 | #245 | Tragic 10.5% |
| Cherokee | 0.5 /100 | #246 | Tragic 10.6% |
| Liberians | 0.4 /100 | #247 | Tragic 10.6% |
| Nicaraguans | 0.4 /100 | #248 | Tragic 10.6% |
| Cubans | 0.4 /100 | #249 | Tragic 10.6% |
| Salvadorans | 0.3 /100 | #250 | Tragic 10.7% |
| Iroquois | 0.3 /100 | #251 | Tragic 10.7% |
| Immigrants | Zaire | 0.3 /100 | #252 | Tragic 10.7% |
Demographics Similar to Immigrants from Australia by Family Poverty
In terms of family poverty, the demographic groups most similar to Immigrants from Australia are Slovene (7.5%, a difference of 0.30%), Carpatho Rusyn (7.5%, a difference of 0.34%), Bolivian (7.5%, a difference of 0.40%), Scandinavian (7.6%, a difference of 0.63%), and Estonian (7.5%, a difference of 0.64%).
| Demographics | Rating | Rank | Family Poverty |
| Russians | 99.5 /100 | #34 | Exceptional 7.5% |
| Greeks | 99.4 /100 | #35 | Exceptional 7.5% |
| Turks | 99.4 /100 | #36 | Exceptional 7.5% |
| Estonians | 99.4 /100 | #37 | Exceptional 7.5% |
| Bolivians | 99.3 /100 | #38 | Exceptional 7.5% |
| Carpatho Rusyns | 99.3 /100 | #39 | Exceptional 7.5% |
| Slovenes | 99.3 /100 | #40 | Exceptional 7.5% |
| Immigrants | Australia | 99.2 /100 | #41 | Exceptional 7.6% |
| Scandinavians | 99.1 /100 | #42 | Exceptional 7.6% |
| Immigrants | Austria | 99.1 /100 | #43 | Exceptional 7.6% |
| Germans | 99.0 /100 | #44 | Exceptional 7.7% |
| Okinawans | 98.9 /100 | #45 | Exceptional 7.7% |
| Tongans | 98.9 /100 | #46 | Exceptional 7.7% |
| Immigrants | Czechoslovakia | 98.9 /100 | #47 | Exceptional 7.7% |
| Immigrants | Sri Lanka | 98.9 /100 | #48 | Exceptional 7.7% |