Immigrants from Burma/Myanmar vs Pueblo Family Poverty
COMPARE
Immigrants from Burma/Myanmar
Pueblo
Family Poverty
Family Poverty Comparison
Immigrants from Burma/Myanmar
Pueblo
10.5%
FAMILY POVERTY
0.6/ 100
METRIC RATING
245th/ 347
METRIC RANK
17.0%
FAMILY POVERTY
0.0/ 100
METRIC RATING
340th/ 347
METRIC RANK
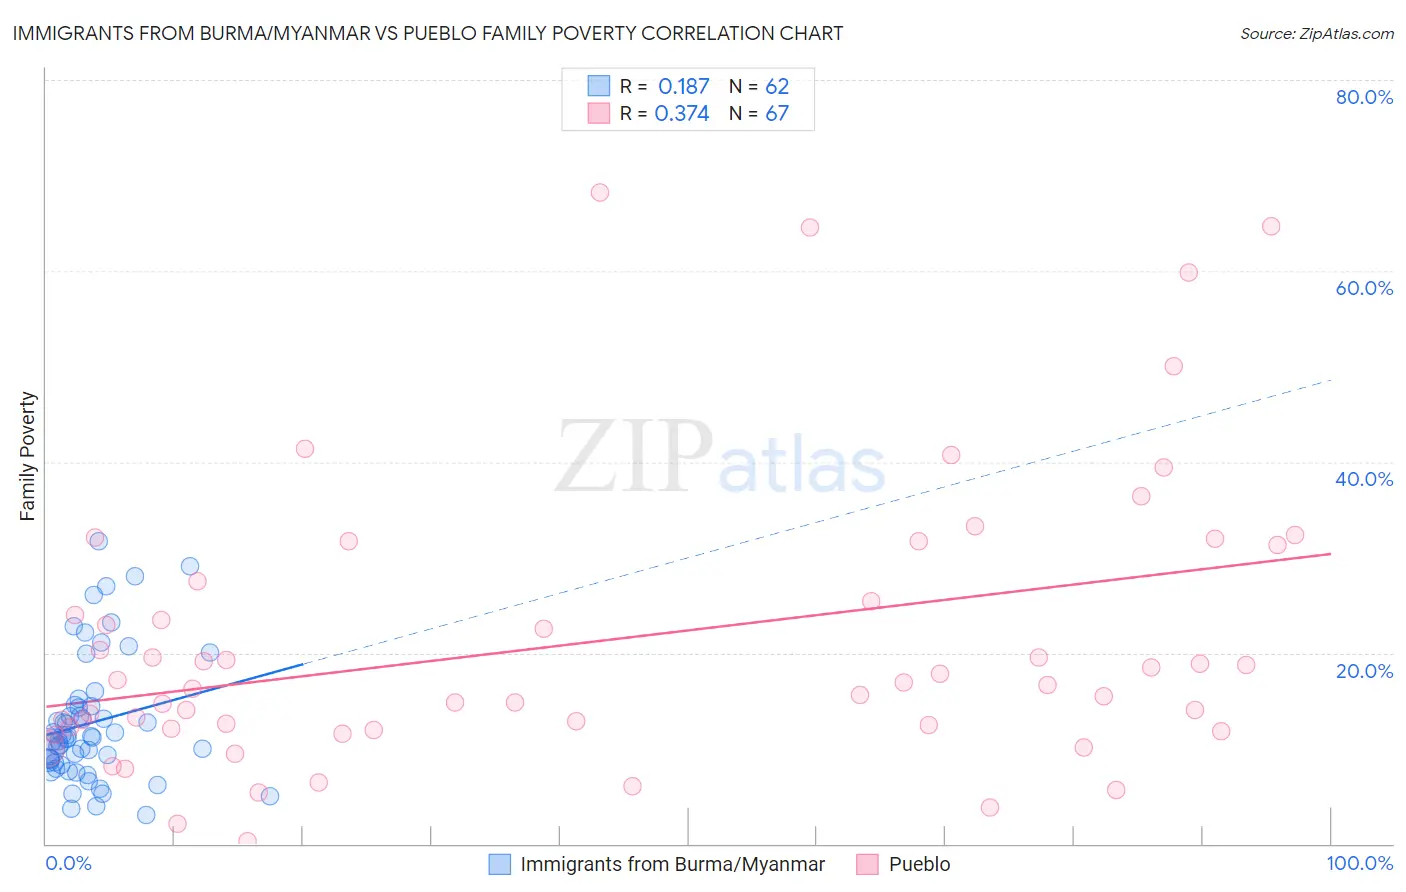
Immigrants from Burma/Myanmar vs Pueblo Family Poverty Correlation Chart
The statistical analysis conducted on geographies consisting of 172,175,970 people shows a poor positive correlation between the proportion of Immigrants from Burma/Myanmar and poverty level among families in the United States with a correlation coefficient (R) of 0.187 and weighted average of 10.5%. Similarly, the statistical analysis conducted on geographies consisting of 120,003,274 people shows a mild positive correlation between the proportion of Pueblo and poverty level among families in the United States with a correlation coefficient (R) of 0.374 and weighted average of 17.0%, a difference of 61.3%.
Family Poverty Correlation Summary
| Measurement | Immigrants from Burma/Myanmar | Pueblo |
| Minimum | 3.0% | 0.20% |
| Maximum | 31.7% | 68.2% |
| Range | 28.7% | 68.0% |
| Mean | 12.7% | 21.1% |
| Median | 11.1% | 16.7% |
| Interquartile 25% (IQ1) | 8.5% | 12.0% |
| Interquartile 75% (IQ3) | 14.4% | 27.5% |
| Interquartile Range (IQR) | 5.8% | 15.5% |
| Standard Deviation (Sample) | 6.6% | 15.0% |
| Standard Deviation (Population) | 6.6% | 14.8% |
Similar Demographics by Family Poverty
Demographics Similar to Immigrants from Burma/Myanmar by Family Poverty
In terms of family poverty, the demographic groups most similar to Immigrants from Burma/Myanmar are Cree (10.5%, a difference of 0.61%), Cherokee (10.6%, a difference of 0.64%), Liberian (10.6%, a difference of 0.73%), Nicaraguan (10.6%, a difference of 0.93%), and Cuban (10.6%, a difference of 0.98%).
| Demographics | Rating | Rank | Family Poverty |
| French American Indians | 1.5 /100 | #238 | Tragic 10.2% |
| Potawatomi | 1.5 /100 | #239 | Tragic 10.2% |
| Immigrants | Azores | 1.4 /100 | #240 | Tragic 10.3% |
| Ghanaians | 1.3 /100 | #241 | Tragic 10.3% |
| Alaska Natives | 1.0 /100 | #242 | Tragic 10.4% |
| Nepalese | 0.8 /100 | #243 | Tragic 10.4% |
| Cree | 0.7 /100 | #244 | Tragic 10.5% |
| Immigrants | Burma/Myanmar | 0.6 /100 | #245 | Tragic 10.5% |
| Cherokee | 0.5 /100 | #246 | Tragic 10.6% |
| Liberians | 0.4 /100 | #247 | Tragic 10.6% |
| Nicaraguans | 0.4 /100 | #248 | Tragic 10.6% |
| Cubans | 0.4 /100 | #249 | Tragic 10.6% |
| Salvadorans | 0.3 /100 | #250 | Tragic 10.7% |
| Iroquois | 0.3 /100 | #251 | Tragic 10.7% |
| Immigrants | Zaire | 0.3 /100 | #252 | Tragic 10.7% |
Demographics Similar to Pueblo by Family Poverty
In terms of family poverty, the demographic groups most similar to Pueblo are Lumbee (17.0%, a difference of 0.070%), Yuman (16.6%, a difference of 2.1%), Immigrants from Yemen (17.5%, a difference of 2.8%), Crow (16.1%, a difference of 5.4%), and Hopi (15.9%, a difference of 6.6%).
| Demographics | Rating | Rank | Family Poverty |
| Immigrants | Dominican Republic | 0.0 /100 | #333 | Tragic 14.4% |
| Houma | 0.0 /100 | #334 | Tragic 14.6% |
| Apache | 0.0 /100 | #335 | Tragic 14.7% |
| Sioux | 0.0 /100 | #336 | Tragic 15.9% |
| Hopi | 0.0 /100 | #337 | Tragic 15.9% |
| Crow | 0.0 /100 | #338 | Tragic 16.1% |
| Yuman | 0.0 /100 | #339 | Tragic 16.6% |
| Pueblo | 0.0 /100 | #340 | Tragic 17.0% |
| Lumbee | 0.0 /100 | #341 | Tragic 17.0% |
| Immigrants | Yemen | 0.0 /100 | #342 | Tragic 17.5% |
| Pima | 0.0 /100 | #343 | Tragic 18.4% |
| Yup'ik | 0.0 /100 | #344 | Tragic 18.7% |
| Navajo | 0.0 /100 | #345 | Tragic 18.8% |
| Puerto Ricans | 0.0 /100 | #346 | Tragic 20.3% |
| Tohono O'odham | 0.0 /100 | #347 | Tragic 20.4% |