Immigrants from Burma/Myanmar vs Immigrants from Congo Family Poverty
COMPARE
Immigrants from Burma/Myanmar
Immigrants from Congo
Family Poverty
Family Poverty Comparison
Immigrants from Burma/Myanmar
Immigrants from Congo
10.5%
FAMILY POVERTY
0.6/ 100
METRIC RATING
245th/ 347
METRIC RANK
11.9%
FAMILY POVERTY
0.0/ 100
METRIC RATING
307th/ 347
METRIC RANK
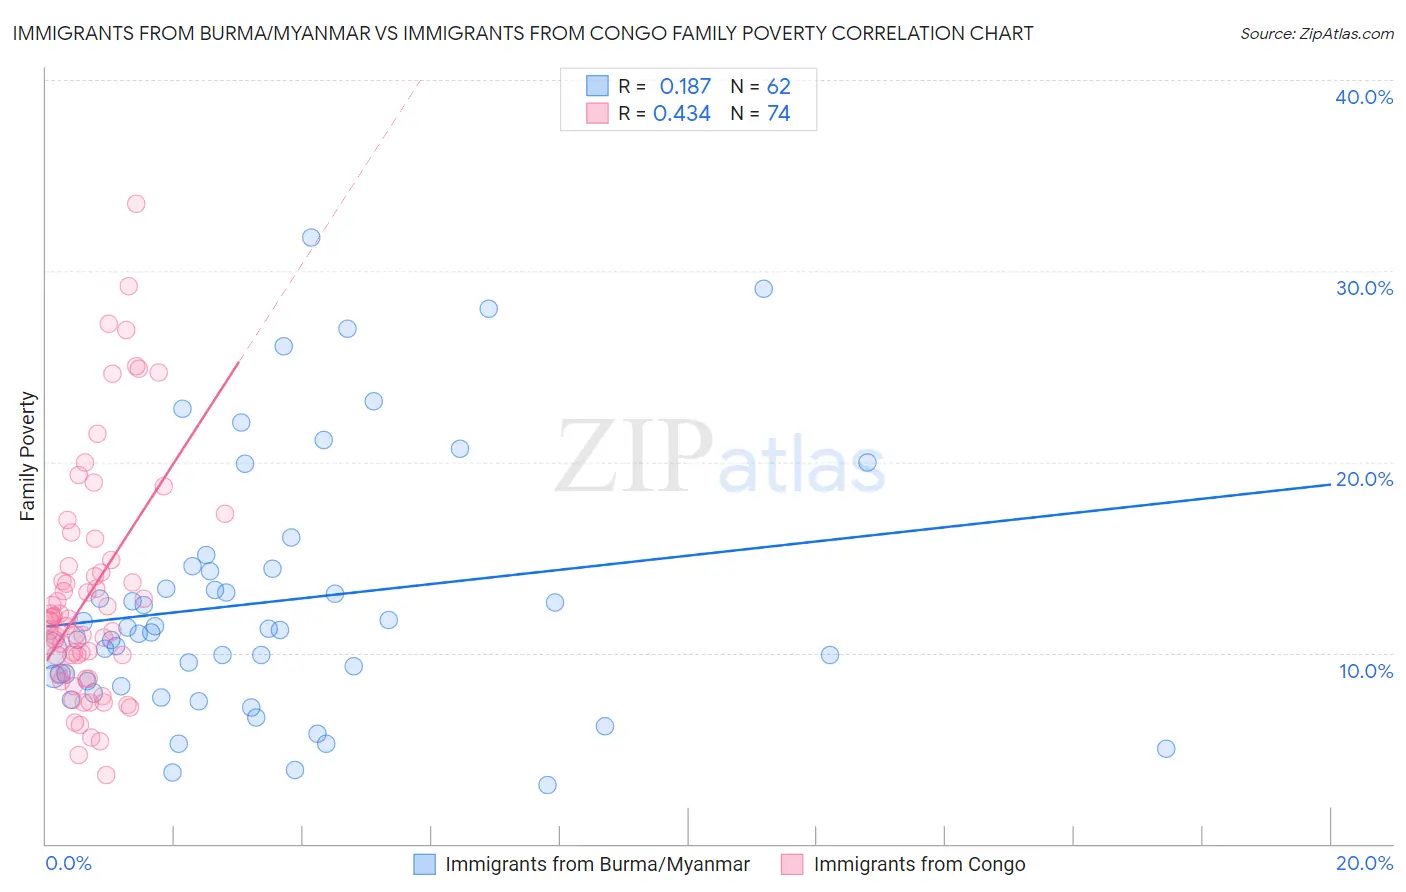
Immigrants from Burma/Myanmar vs Immigrants from Congo Family Poverty Correlation Chart
The statistical analysis conducted on geographies consisting of 172,175,970 people shows a poor positive correlation between the proportion of Immigrants from Burma/Myanmar and poverty level among families in the United States with a correlation coefficient (R) of 0.187 and weighted average of 10.5%. Similarly, the statistical analysis conducted on geographies consisting of 92,062,434 people shows a moderate positive correlation between the proportion of Immigrants from Congo and poverty level among families in the United States with a correlation coefficient (R) of 0.434 and weighted average of 11.9%, a difference of 13.0%.
Family Poverty Correlation Summary
| Measurement | Immigrants from Burma/Myanmar | Immigrants from Congo |
| Minimum | 3.0% | 3.6% |
| Maximum | 31.7% | 33.5% |
| Range | 28.7% | 29.9% |
| Mean | 12.7% | 13.1% |
| Median | 11.1% | 11.6% |
| Interquartile 25% (IQ1) | 8.5% | 9.0% |
| Interquartile 75% (IQ3) | 14.4% | 14.5% |
| Interquartile Range (IQR) | 5.8% | 5.5% |
| Standard Deviation (Sample) | 6.6% | 6.1% |
| Standard Deviation (Population) | 6.6% | 6.1% |
Similar Demographics by Family Poverty
Demographics Similar to Immigrants from Burma/Myanmar by Family Poverty
In terms of family poverty, the demographic groups most similar to Immigrants from Burma/Myanmar are Cree (10.5%, a difference of 0.61%), Cherokee (10.6%, a difference of 0.64%), Liberian (10.6%, a difference of 0.73%), Nicaraguan (10.6%, a difference of 0.93%), and Cuban (10.6%, a difference of 0.98%).
| Demographics | Rating | Rank | Family Poverty |
| French American Indians | 1.5 /100 | #238 | Tragic 10.2% |
| Potawatomi | 1.5 /100 | #239 | Tragic 10.2% |
| Immigrants | Azores | 1.4 /100 | #240 | Tragic 10.3% |
| Ghanaians | 1.3 /100 | #241 | Tragic 10.3% |
| Alaska Natives | 1.0 /100 | #242 | Tragic 10.4% |
| Nepalese | 0.8 /100 | #243 | Tragic 10.4% |
| Cree | 0.7 /100 | #244 | Tragic 10.5% |
| Immigrants | Burma/Myanmar | 0.6 /100 | #245 | Tragic 10.5% |
| Cherokee | 0.5 /100 | #246 | Tragic 10.6% |
| Liberians | 0.4 /100 | #247 | Tragic 10.6% |
| Nicaraguans | 0.4 /100 | #248 | Tragic 10.6% |
| Cubans | 0.4 /100 | #249 | Tragic 10.6% |
| Salvadorans | 0.3 /100 | #250 | Tragic 10.7% |
| Iroquois | 0.3 /100 | #251 | Tragic 10.7% |
| Immigrants | Zaire | 0.3 /100 | #252 | Tragic 10.7% |
Demographics Similar to Immigrants from Congo by Family Poverty
In terms of family poverty, the demographic groups most similar to Immigrants from Congo are Seminole (11.9%, a difference of 0.060%), Cajun (11.9%, a difference of 0.11%), Hispanic or Latino (12.0%, a difference of 0.50%), Immigrants from Guatemala (12.0%, a difference of 0.51%), and Mexican (11.8%, a difference of 0.67%).
| Demographics | Rating | Rank | Family Poverty |
| Immigrants | Bangladesh | 0.0 /100 | #300 | Tragic 11.7% |
| Bahamians | 0.0 /100 | #301 | Tragic 11.7% |
| Guatemalans | 0.0 /100 | #302 | Tragic 11.7% |
| Africans | 0.0 /100 | #303 | Tragic 11.8% |
| Immigrants | Latin America | 0.0 /100 | #304 | Tragic 11.8% |
| Mexicans | 0.0 /100 | #305 | Tragic 11.8% |
| Cajuns | 0.0 /100 | #306 | Tragic 11.9% |
| Immigrants | Congo | 0.0 /100 | #307 | Tragic 11.9% |
| Seminole | 0.0 /100 | #308 | Tragic 11.9% |
| Hispanics or Latinos | 0.0 /100 | #309 | Tragic 12.0% |
| Immigrants | Guatemala | 0.0 /100 | #310 | Tragic 12.0% |
| Ute | 0.0 /100 | #311 | Tragic 12.1% |
| Immigrants | Central America | 0.0 /100 | #312 | Tragic 12.1% |
| Immigrants | Caribbean | 0.0 /100 | #313 | Tragic 12.2% |
| Kiowa | 0.0 /100 | #314 | Tragic 12.2% |