Immigrants from Burma/Myanmar vs Comanche Family Poverty
COMPARE
Immigrants from Burma/Myanmar
Comanche
Family Poverty
Family Poverty Comparison
Immigrants from Burma/Myanmar
Comanche
10.5%
FAMILY POVERTY
0.6/ 100
METRIC RATING
245th/ 347
METRIC RANK
11.0%
FAMILY POVERTY
0.1/ 100
METRIC RATING
267th/ 347
METRIC RANK
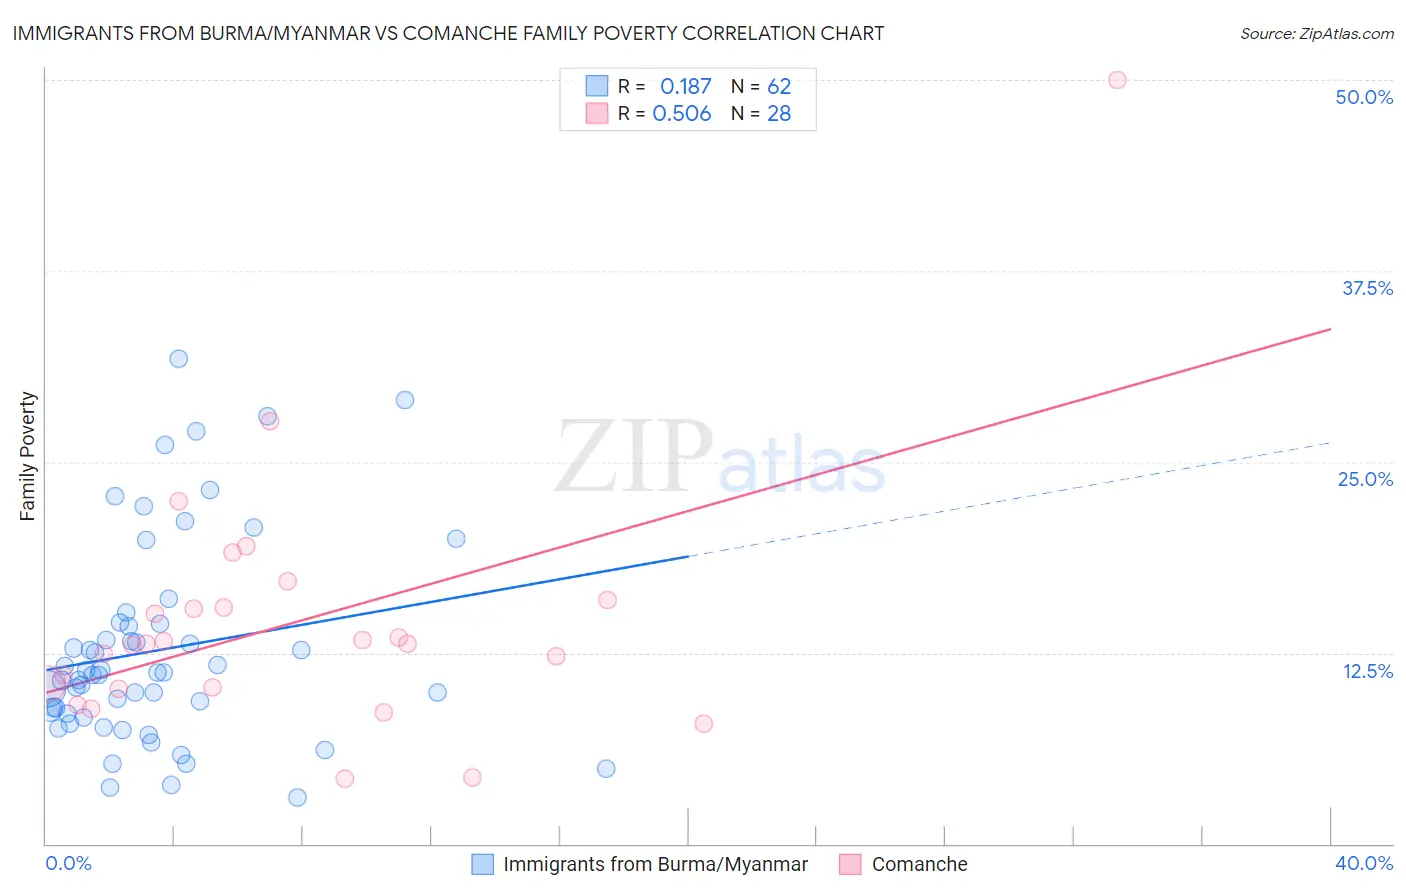
Immigrants from Burma/Myanmar vs Comanche Family Poverty Correlation Chart
The statistical analysis conducted on geographies consisting of 172,175,970 people shows a poor positive correlation between the proportion of Immigrants from Burma/Myanmar and poverty level among families in the United States with a correlation coefficient (R) of 0.187 and weighted average of 10.5%. Similarly, the statistical analysis conducted on geographies consisting of 109,722,823 people shows a substantial positive correlation between the proportion of Comanche and poverty level among families in the United States with a correlation coefficient (R) of 0.506 and weighted average of 11.0%, a difference of 4.9%.
Family Poverty Correlation Summary
| Measurement | Immigrants from Burma/Myanmar | Comanche |
| Minimum | 3.0% | 4.3% |
| Maximum | 31.7% | 50.0% |
| Range | 28.7% | 45.7% |
| Mean | 12.7% | 14.5% |
| Median | 11.1% | 13.1% |
| Interquartile 25% (IQ1) | 8.5% | 10.2% |
| Interquartile 75% (IQ3) | 14.4% | 15.7% |
| Interquartile Range (IQR) | 5.8% | 5.5% |
| Standard Deviation (Sample) | 6.6% | 8.6% |
| Standard Deviation (Population) | 6.6% | 8.4% |
Similar Demographics by Family Poverty
Demographics Similar to Immigrants from Burma/Myanmar by Family Poverty
In terms of family poverty, the demographic groups most similar to Immigrants from Burma/Myanmar are Cree (10.5%, a difference of 0.61%), Cherokee (10.6%, a difference of 0.64%), Liberian (10.6%, a difference of 0.73%), Nicaraguan (10.6%, a difference of 0.93%), and Cuban (10.6%, a difference of 0.98%).
| Demographics | Rating | Rank | Family Poverty |
| French American Indians | 1.5 /100 | #238 | Tragic 10.2% |
| Potawatomi | 1.5 /100 | #239 | Tragic 10.2% |
| Immigrants | Azores | 1.4 /100 | #240 | Tragic 10.3% |
| Ghanaians | 1.3 /100 | #241 | Tragic 10.3% |
| Alaska Natives | 1.0 /100 | #242 | Tragic 10.4% |
| Nepalese | 0.8 /100 | #243 | Tragic 10.4% |
| Cree | 0.7 /100 | #244 | Tragic 10.5% |
| Immigrants | Burma/Myanmar | 0.6 /100 | #245 | Tragic 10.5% |
| Cherokee | 0.5 /100 | #246 | Tragic 10.6% |
| Liberians | 0.4 /100 | #247 | Tragic 10.6% |
| Nicaraguans | 0.4 /100 | #248 | Tragic 10.6% |
| Cubans | 0.4 /100 | #249 | Tragic 10.6% |
| Salvadorans | 0.3 /100 | #250 | Tragic 10.7% |
| Iroquois | 0.3 /100 | #251 | Tragic 10.7% |
| Immigrants | Zaire | 0.3 /100 | #252 | Tragic 10.7% |
Demographics Similar to Comanche by Family Poverty
In terms of family poverty, the demographic groups most similar to Comanche are Immigrants from El Salvador (11.0%, a difference of 0.010%), Jamaican (11.1%, a difference of 0.10%), Immigrants from Ecuador (11.1%, a difference of 0.58%), Immigrants from Nicaragua (11.1%, a difference of 0.59%), and Immigrants from Bahamas (11.1%, a difference of 0.84%).
| Demographics | Rating | Rank | Family Poverty |
| Bangladeshis | 0.2 /100 | #260 | Tragic 10.9% |
| Shoshone | 0.2 /100 | #261 | Tragic 10.9% |
| Spanish American Indians | 0.2 /100 | #262 | Tragic 10.9% |
| Cape Verdeans | 0.1 /100 | #263 | Tragic 10.9% |
| Trinidadians and Tobagonians | 0.1 /100 | #264 | Tragic 10.9% |
| Immigrants | Trinidad and Tobago | 0.1 /100 | #265 | Tragic 10.9% |
| Immigrants | El Salvador | 0.1 /100 | #266 | Tragic 11.0% |
| Comanche | 0.1 /100 | #267 | Tragic 11.0% |
| Jamaicans | 0.1 /100 | #268 | Tragic 11.1% |
| Immigrants | Ecuador | 0.1 /100 | #269 | Tragic 11.1% |
| Immigrants | Nicaragua | 0.1 /100 | #270 | Tragic 11.1% |
| Immigrants | Bahamas | 0.1 /100 | #271 | Tragic 11.1% |
| Immigrants | Jamaica | 0.1 /100 | #272 | Tragic 11.2% |
| Somalis | 0.1 /100 | #273 | Tragic 11.2% |
| Spanish Americans | 0.1 /100 | #274 | Tragic 11.2% |