Icelander vs Immigrants from Mexico Receiving Food Stamps
COMPARE
Icelander
Immigrants from Mexico
Receiving Food Stamps
Receiving Food Stamps Comparison
Icelanders
Immigrants from Mexico
10.5%
RECEIVING FOOD STAMPS
95.4/ 100
METRIC RATING
113th/ 347
METRIC RANK
15.2%
RECEIVING FOOD STAMPS
0.0/ 100
METRIC RATING
287th/ 347
METRIC RANK
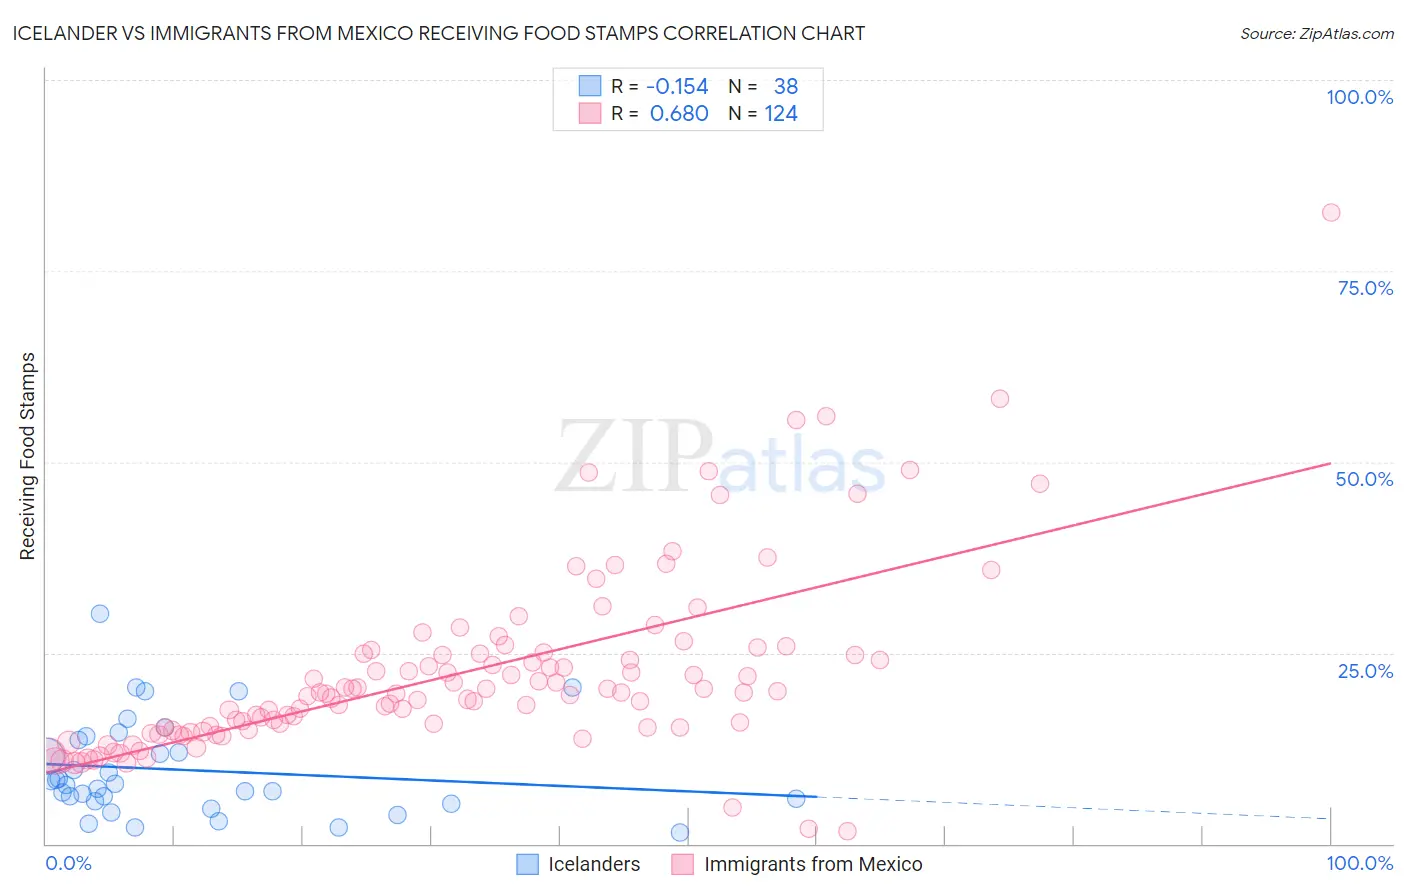
Icelander vs Immigrants from Mexico Receiving Food Stamps Correlation Chart
The statistical analysis conducted on geographies consisting of 159,460,125 people shows a poor negative correlation between the proportion of Icelanders and percentage of population receiving government assistance and/or food stamps in the United States with a correlation coefficient (R) of -0.154 and weighted average of 10.5%. Similarly, the statistical analysis conducted on geographies consisting of 512,033,306 people shows a significant positive correlation between the proportion of Immigrants from Mexico and percentage of population receiving government assistance and/or food stamps in the United States with a correlation coefficient (R) of 0.680 and weighted average of 15.2%, a difference of 44.5%.
Receiving Food Stamps Correlation Summary
| Measurement | Icelander | Immigrants from Mexico |
| Minimum | 1.4% | 1.6% |
| Maximum | 30.2% | 82.7% |
| Range | 28.8% | 81.1% |
| Mean | 9.6% | 22.3% |
| Median | 7.8% | 19.7% |
| Interquartile 25% (IQ1) | 5.5% | 15.0% |
| Interquartile 75% (IQ3) | 13.6% | 24.9% |
| Interquartile Range (IQR) | 8.1% | 9.9% |
| Standard Deviation (Sample) | 6.4% | 11.9% |
| Standard Deviation (Population) | 6.3% | 11.9% |
Similar Demographics by Receiving Food Stamps
Demographics Similar to Icelanders by Receiving Food Stamps
In terms of receiving food stamps, the demographic groups most similar to Icelanders are Scotch-Irish (10.5%, a difference of 0.30%), Mongolian (10.5%, a difference of 0.38%), Romanian (10.4%, a difference of 0.39%), Immigrants from Saudi Arabia (10.5%, a difference of 0.48%), and Pakistani (10.4%, a difference of 0.49%).
| Demographics | Rating | Rank | Receiving Food Stamps |
| Immigrants | Italy | 96.4 /100 | #106 | Exceptional 10.4% |
| Koreans | 96.3 /100 | #107 | Exceptional 10.4% |
| Carpatho Rusyns | 96.2 /100 | #108 | Exceptional 10.4% |
| Immigrants | Pakistan | 96.2 /100 | #109 | Exceptional 10.4% |
| Pakistanis | 95.9 /100 | #110 | Exceptional 10.4% |
| Romanians | 95.8 /100 | #111 | Exceptional 10.4% |
| Mongolians | 95.8 /100 | #112 | Exceptional 10.5% |
| Icelanders | 95.4 /100 | #113 | Exceptional 10.5% |
| Scotch-Irish | 95.1 /100 | #114 | Exceptional 10.5% |
| Immigrants | Saudi Arabia | 94.9 /100 | #115 | Exceptional 10.5% |
| Canadians | 94.8 /100 | #116 | Exceptional 10.5% |
| Immigrants | Nepal | 94.6 /100 | #117 | Exceptional 10.6% |
| Assyrians/Chaldeans/Syriacs | 94.1 /100 | #118 | Exceptional 10.6% |
| Immigrants | Poland | 93.9 /100 | #119 | Exceptional 10.6% |
| Ethiopians | 93.9 /100 | #120 | Exceptional 10.6% |
Demographics Similar to Immigrants from Mexico by Receiving Food Stamps
In terms of receiving food stamps, the demographic groups most similar to Immigrants from Mexico are African (15.1%, a difference of 0.23%), Immigrants from Liberia (15.1%, a difference of 0.37%), Immigrants from Belize (15.2%, a difference of 0.46%), Immigrants from Ecuador (15.0%, a difference of 0.75%), and Bangladeshi (15.0%, a difference of 0.76%).
| Demographics | Rating | Rank | Receiving Food Stamps |
| Ecuadorians | 0.0 /100 | #280 | Tragic 14.9% |
| Spanish American Indians | 0.0 /100 | #281 | Tragic 14.9% |
| Immigrants | Central America | 0.0 /100 | #282 | Tragic 15.0% |
| Bangladeshis | 0.0 /100 | #283 | Tragic 15.0% |
| Immigrants | Ecuador | 0.0 /100 | #284 | Tragic 15.0% |
| Immigrants | Liberia | 0.0 /100 | #285 | Tragic 15.1% |
| Africans | 0.0 /100 | #286 | Tragic 15.1% |
| Immigrants | Mexico | 0.0 /100 | #287 | Tragic 15.2% |
| Immigrants | Belize | 0.0 /100 | #288 | Tragic 15.2% |
| Immigrants | Senegal | 0.0 /100 | #289 | Tragic 15.3% |
| Senegalese | 0.0 /100 | #290 | Tragic 15.4% |
| Hondurans | 0.0 /100 | #291 | Tragic 15.5% |
| Alaska Natives | 0.0 /100 | #292 | Tragic 15.6% |
| Vietnamese | 0.0 /100 | #293 | Tragic 15.7% |
| Immigrants | Latin America | 0.0 /100 | #294 | Tragic 15.7% |