Icelander vs Trinidadian and Tobagonian Receiving Food Stamps
COMPARE
Icelander
Trinidadian and Tobagonian
Receiving Food Stamps
Receiving Food Stamps Comparison
Icelanders
Trinidadians and Tobagonians
10.5%
RECEIVING FOOD STAMPS
95.4/ 100
METRIC RATING
113th/ 347
METRIC RANK
16.0%
RECEIVING FOOD STAMPS
0.0/ 100
METRIC RATING
301st/ 347
METRIC RANK
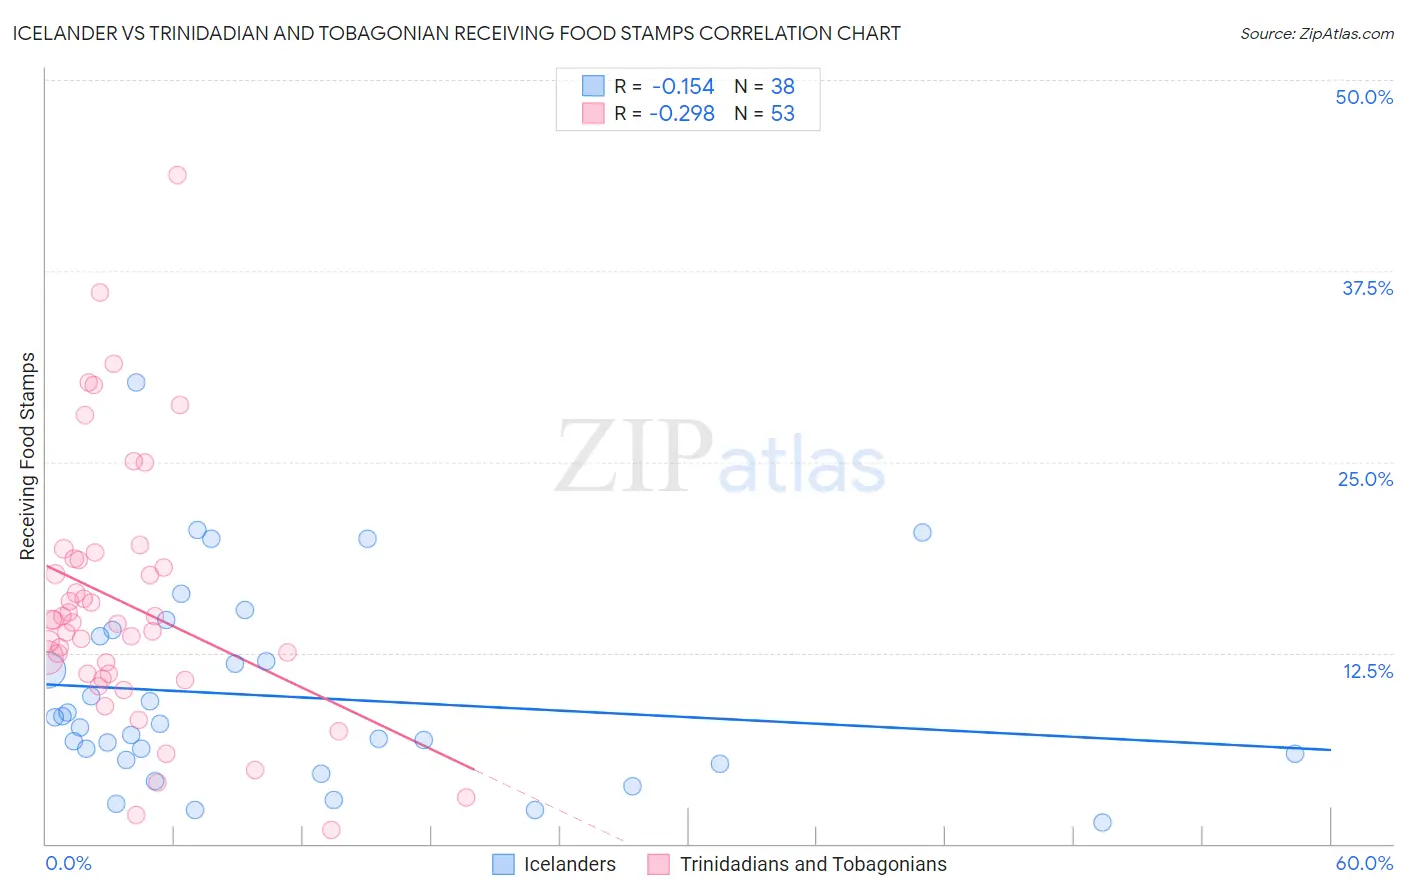
Icelander vs Trinidadian and Tobagonian Receiving Food Stamps Correlation Chart
The statistical analysis conducted on geographies consisting of 159,460,125 people shows a poor negative correlation between the proportion of Icelanders and percentage of population receiving government assistance and/or food stamps in the United States with a correlation coefficient (R) of -0.154 and weighted average of 10.5%. Similarly, the statistical analysis conducted on geographies consisting of 219,495,740 people shows a weak negative correlation between the proportion of Trinidadians and Tobagonians and percentage of population receiving government assistance and/or food stamps in the United States with a correlation coefficient (R) of -0.298 and weighted average of 16.0%, a difference of 52.3%.
Receiving Food Stamps Correlation Summary
| Measurement | Icelander | Trinidadian and Tobagonian |
| Minimum | 1.4% | 0.90% |
| Maximum | 30.2% | 43.8% |
| Range | 28.8% | 42.9% |
| Mean | 9.6% | 15.7% |
| Median | 7.8% | 14.5% |
| Interquartile 25% (IQ1) | 5.5% | 10.9% |
| Interquartile 75% (IQ3) | 13.6% | 18.6% |
| Interquartile Range (IQR) | 8.1% | 7.7% |
| Standard Deviation (Sample) | 6.4% | 8.5% |
| Standard Deviation (Population) | 6.3% | 8.4% |
Similar Demographics by Receiving Food Stamps
Demographics Similar to Icelanders by Receiving Food Stamps
In terms of receiving food stamps, the demographic groups most similar to Icelanders are Scotch-Irish (10.5%, a difference of 0.30%), Mongolian (10.5%, a difference of 0.38%), Romanian (10.4%, a difference of 0.39%), Immigrants from Saudi Arabia (10.5%, a difference of 0.48%), and Pakistani (10.4%, a difference of 0.49%).
| Demographics | Rating | Rank | Receiving Food Stamps |
| Immigrants | Italy | 96.4 /100 | #106 | Exceptional 10.4% |
| Koreans | 96.3 /100 | #107 | Exceptional 10.4% |
| Carpatho Rusyns | 96.2 /100 | #108 | Exceptional 10.4% |
| Immigrants | Pakistan | 96.2 /100 | #109 | Exceptional 10.4% |
| Pakistanis | 95.9 /100 | #110 | Exceptional 10.4% |
| Romanians | 95.8 /100 | #111 | Exceptional 10.4% |
| Mongolians | 95.8 /100 | #112 | Exceptional 10.5% |
| Icelanders | 95.4 /100 | #113 | Exceptional 10.5% |
| Scotch-Irish | 95.1 /100 | #114 | Exceptional 10.5% |
| Immigrants | Saudi Arabia | 94.9 /100 | #115 | Exceptional 10.5% |
| Canadians | 94.8 /100 | #116 | Exceptional 10.5% |
| Immigrants | Nepal | 94.6 /100 | #117 | Exceptional 10.6% |
| Assyrians/Chaldeans/Syriacs | 94.1 /100 | #118 | Exceptional 10.6% |
| Immigrants | Poland | 93.9 /100 | #119 | Exceptional 10.6% |
| Ethiopians | 93.9 /100 | #120 | Exceptional 10.6% |
Demographics Similar to Trinidadians and Tobagonians by Receiving Food Stamps
In terms of receiving food stamps, the demographic groups most similar to Trinidadians and Tobagonians are Immigrants from Bangladesh (15.9%, a difference of 0.45%), Hispanic or Latino (15.8%, a difference of 0.89%), Immigrants from West Indies (16.1%, a difference of 0.94%), Nicaraguan (16.1%, a difference of 1.0%), and Immigrants from Trinidad and Tobago (15.8%, a difference of 1.2%).
| Demographics | Rating | Rank | Receiving Food Stamps |
| Immigrants | Latin America | 0.0 /100 | #294 | Tragic 15.7% |
| Immigrants | Honduras | 0.0 /100 | #295 | Tragic 15.7% |
| Tsimshian | 0.0 /100 | #296 | Tragic 15.7% |
| Immigrants | Bahamas | 0.0 /100 | #297 | Tragic 15.8% |
| Immigrants | Trinidad and Tobago | 0.0 /100 | #298 | Tragic 15.8% |
| Hispanics or Latinos | 0.0 /100 | #299 | Tragic 15.8% |
| Immigrants | Bangladesh | 0.0 /100 | #300 | Tragic 15.9% |
| Trinidadians and Tobagonians | 0.0 /100 | #301 | Tragic 16.0% |
| Immigrants | West Indies | 0.0 /100 | #302 | Tragic 16.1% |
| Nicaraguans | 0.0 /100 | #303 | Tragic 16.1% |
| West Indians | 0.0 /100 | #304 | Tragic 16.3% |
| Immigrants | Azores | 0.0 /100 | #305 | Tragic 16.4% |
| Jamaicans | 0.0 /100 | #306 | Tragic 16.4% |
| Houma | 0.0 /100 | #307 | Tragic 16.5% |
| Barbadians | 0.0 /100 | #308 | Tragic 16.5% |