Icelander vs Immigrants from Sweden Receiving Food Stamps
COMPARE
Icelander
Immigrants from Sweden
Receiving Food Stamps
Receiving Food Stamps Comparison
Icelanders
Immigrants from Sweden
10.5%
RECEIVING FOOD STAMPS
95.4/ 100
METRIC RATING
113th/ 347
METRIC RANK
9.3%
RECEIVING FOOD STAMPS
99.7/ 100
METRIC RATING
30th/ 347
METRIC RANK
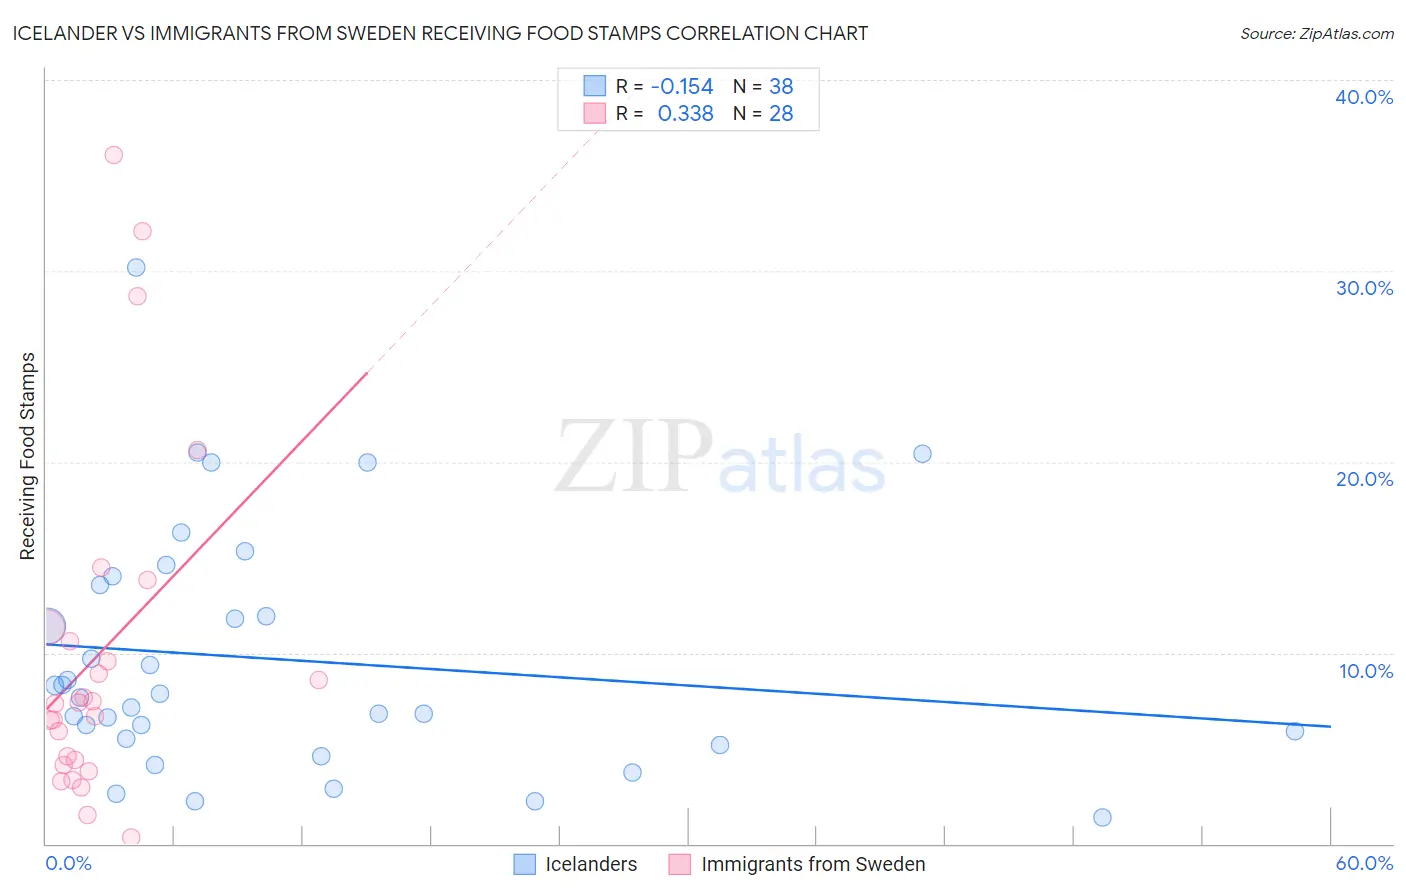
Icelander vs Immigrants from Sweden Receiving Food Stamps Correlation Chart
The statistical analysis conducted on geographies consisting of 159,460,125 people shows a poor negative correlation between the proportion of Icelanders and percentage of population receiving government assistance and/or food stamps in the United States with a correlation coefficient (R) of -0.154 and weighted average of 10.5%. Similarly, the statistical analysis conducted on geographies consisting of 164,382,691 people shows a mild positive correlation between the proportion of Immigrants from Sweden and percentage of population receiving government assistance and/or food stamps in the United States with a correlation coefficient (R) of 0.338 and weighted average of 9.3%, a difference of 13.1%.
Receiving Food Stamps Correlation Summary
| Measurement | Icelander | Immigrants from Sweden |
| Minimum | 1.4% | 0.30% |
| Maximum | 30.2% | 36.1% |
| Range | 28.8% | 35.8% |
| Mean | 9.6% | 9.9% |
| Median | 7.8% | 7.4% |
| Interquartile 25% (IQ1) | 5.5% | 4.2% |
| Interquartile 75% (IQ3) | 13.6% | 11.0% |
| Interquartile Range (IQR) | 8.1% | 6.7% |
| Standard Deviation (Sample) | 6.4% | 9.0% |
| Standard Deviation (Population) | 6.3% | 8.8% |
Similar Demographics by Receiving Food Stamps
Demographics Similar to Icelanders by Receiving Food Stamps
In terms of receiving food stamps, the demographic groups most similar to Icelanders are Scotch-Irish (10.5%, a difference of 0.30%), Mongolian (10.5%, a difference of 0.38%), Romanian (10.4%, a difference of 0.39%), Immigrants from Saudi Arabia (10.5%, a difference of 0.48%), and Pakistani (10.4%, a difference of 0.49%).
| Demographics | Rating | Rank | Receiving Food Stamps |
| Immigrants | Italy | 96.4 /100 | #106 | Exceptional 10.4% |
| Koreans | 96.3 /100 | #107 | Exceptional 10.4% |
| Carpatho Rusyns | 96.2 /100 | #108 | Exceptional 10.4% |
| Immigrants | Pakistan | 96.2 /100 | #109 | Exceptional 10.4% |
| Pakistanis | 95.9 /100 | #110 | Exceptional 10.4% |
| Romanians | 95.8 /100 | #111 | Exceptional 10.4% |
| Mongolians | 95.8 /100 | #112 | Exceptional 10.5% |
| Icelanders | 95.4 /100 | #113 | Exceptional 10.5% |
| Scotch-Irish | 95.1 /100 | #114 | Exceptional 10.5% |
| Immigrants | Saudi Arabia | 94.9 /100 | #115 | Exceptional 10.5% |
| Canadians | 94.8 /100 | #116 | Exceptional 10.5% |
| Immigrants | Nepal | 94.6 /100 | #117 | Exceptional 10.6% |
| Assyrians/Chaldeans/Syriacs | 94.1 /100 | #118 | Exceptional 10.6% |
| Immigrants | Poland | 93.9 /100 | #119 | Exceptional 10.6% |
| Ethiopians | 93.9 /100 | #120 | Exceptional 10.6% |
Demographics Similar to Immigrants from Sweden by Receiving Food Stamps
In terms of receiving food stamps, the demographic groups most similar to Immigrants from Sweden are Immigrants from Lithuania (9.2%, a difference of 0.37%), Immigrants from Eastern Asia (9.3%, a difference of 0.41%), Czech (9.2%, a difference of 0.64%), Bhutanese (9.2%, a difference of 0.66%), and Bolivian (9.3%, a difference of 0.72%).
| Demographics | Rating | Rank | Receiving Food Stamps |
| Eastern Europeans | 99.8 /100 | #23 | Exceptional 9.2% |
| Immigrants | Northern Europe | 99.8 /100 | #24 | Exceptional 9.2% |
| Immigrants | Ireland | 99.8 /100 | #25 | Exceptional 9.2% |
| Swedes | 99.8 /100 | #26 | Exceptional 9.2% |
| Bhutanese | 99.8 /100 | #27 | Exceptional 9.2% |
| Czechs | 99.8 /100 | #28 | Exceptional 9.2% |
| Immigrants | Lithuania | 99.8 /100 | #29 | Exceptional 9.2% |
| Immigrants | Sweden | 99.7 /100 | #30 | Exceptional 9.3% |
| Immigrants | Eastern Asia | 99.7 /100 | #31 | Exceptional 9.3% |
| Bolivians | 99.7 /100 | #32 | Exceptional 9.3% |
| Zimbabweans | 99.6 /100 | #33 | Exceptional 9.5% |
| Turks | 99.6 /100 | #34 | Exceptional 9.5% |
| Immigrants | Austria | 99.6 /100 | #35 | Exceptional 9.5% |
| Estonians | 99.6 /100 | #36 | Exceptional 9.5% |
| Europeans | 99.6 /100 | #37 | Exceptional 9.5% |