Icelander vs Mexican American Indian Receiving Food Stamps
COMPARE
Icelander
Mexican American Indian
Receiving Food Stamps
Receiving Food Stamps Comparison
Icelanders
Mexican American Indians
10.5%
RECEIVING FOOD STAMPS
95.4/ 100
METRIC RATING
113th/ 347
METRIC RANK
13.8%
RECEIVING FOOD STAMPS
0.7/ 100
METRIC RATING
247th/ 347
METRIC RANK
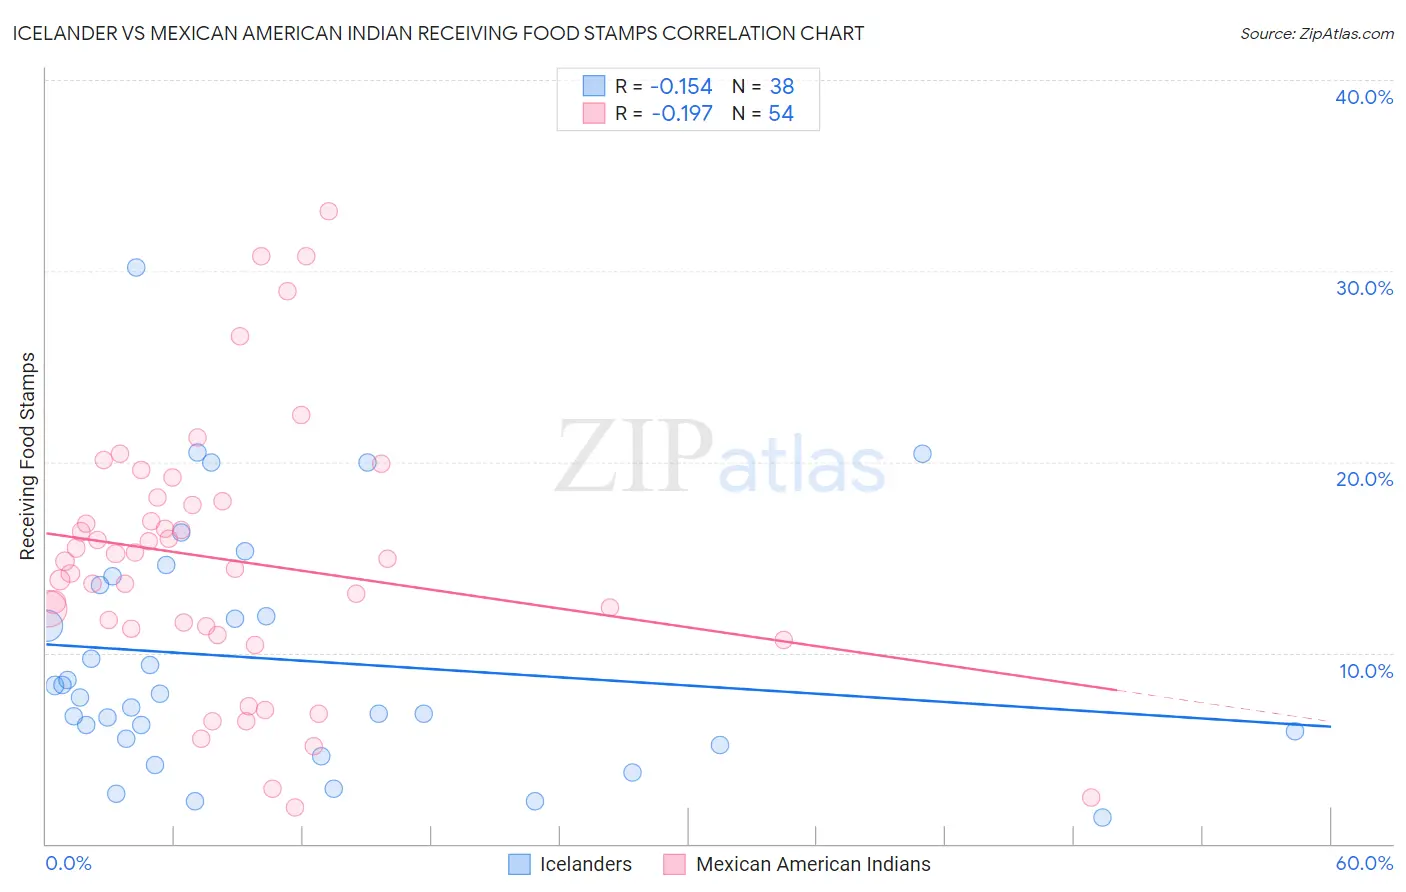
Icelander vs Mexican American Indian Receiving Food Stamps Correlation Chart
The statistical analysis conducted on geographies consisting of 159,460,125 people shows a poor negative correlation between the proportion of Icelanders and percentage of population receiving government assistance and/or food stamps in the United States with a correlation coefficient (R) of -0.154 and weighted average of 10.5%. Similarly, the statistical analysis conducted on geographies consisting of 317,251,944 people shows a poor negative correlation between the proportion of Mexican American Indians and percentage of population receiving government assistance and/or food stamps in the United States with a correlation coefficient (R) of -0.197 and weighted average of 13.8%, a difference of 31.1%.
Receiving Food Stamps Correlation Summary
| Measurement | Icelander | Mexican American Indian |
| Minimum | 1.4% | 1.9% |
| Maximum | 30.2% | 33.1% |
| Range | 28.8% | 31.2% |
| Mean | 9.6% | 14.9% |
| Median | 7.8% | 14.8% |
| Interquartile 25% (IQ1) | 5.5% | 11.3% |
| Interquartile 75% (IQ3) | 13.6% | 17.9% |
| Interquartile Range (IQR) | 8.1% | 6.7% |
| Standard Deviation (Sample) | 6.4% | 6.9% |
| Standard Deviation (Population) | 6.3% | 6.9% |
Similar Demographics by Receiving Food Stamps
Demographics Similar to Icelanders by Receiving Food Stamps
In terms of receiving food stamps, the demographic groups most similar to Icelanders are Scotch-Irish (10.5%, a difference of 0.30%), Mongolian (10.5%, a difference of 0.38%), Romanian (10.4%, a difference of 0.39%), Immigrants from Saudi Arabia (10.5%, a difference of 0.48%), and Pakistani (10.4%, a difference of 0.49%).
| Demographics | Rating | Rank | Receiving Food Stamps |
| Immigrants | Italy | 96.4 /100 | #106 | Exceptional 10.4% |
| Koreans | 96.3 /100 | #107 | Exceptional 10.4% |
| Carpatho Rusyns | 96.2 /100 | #108 | Exceptional 10.4% |
| Immigrants | Pakistan | 96.2 /100 | #109 | Exceptional 10.4% |
| Pakistanis | 95.9 /100 | #110 | Exceptional 10.4% |
| Romanians | 95.8 /100 | #111 | Exceptional 10.4% |
| Mongolians | 95.8 /100 | #112 | Exceptional 10.5% |
| Icelanders | 95.4 /100 | #113 | Exceptional 10.5% |
| Scotch-Irish | 95.1 /100 | #114 | Exceptional 10.5% |
| Immigrants | Saudi Arabia | 94.9 /100 | #115 | Exceptional 10.5% |
| Canadians | 94.8 /100 | #116 | Exceptional 10.5% |
| Immigrants | Nepal | 94.6 /100 | #117 | Exceptional 10.6% |
| Assyrians/Chaldeans/Syriacs | 94.1 /100 | #118 | Exceptional 10.6% |
| Immigrants | Poland | 93.9 /100 | #119 | Exceptional 10.6% |
| Ethiopians | 93.9 /100 | #120 | Exceptional 10.6% |
Demographics Similar to Mexican American Indians by Receiving Food Stamps
In terms of receiving food stamps, the demographic groups most similar to Mexican American Indians are Immigrants from Laos (13.8%, a difference of 0.10%), Cree (13.7%, a difference of 0.27%), Immigrants from Somalia (13.7%, a difference of 0.51%), Cajun (13.7%, a difference of 0.55%), and Somali (13.7%, a difference of 0.71%).
| Demographics | Rating | Rank | Receiving Food Stamps |
| Iroquois | 1.2 /100 | #240 | Tragic 13.5% |
| Choctaw | 1.0 /100 | #241 | Tragic 13.6% |
| Immigrants | Panama | 1.0 /100 | #242 | Tragic 13.6% |
| Somalis | 0.9 /100 | #243 | Tragic 13.7% |
| Cajuns | 0.9 /100 | #244 | Tragic 13.7% |
| Immigrants | Somalia | 0.9 /100 | #245 | Tragic 13.7% |
| Cree | 0.8 /100 | #246 | Tragic 13.7% |
| Mexican American Indians | 0.7 /100 | #247 | Tragic 13.8% |
| Immigrants | Laos | 0.7 /100 | #248 | Tragic 13.8% |
| Indonesians | 0.6 /100 | #249 | Tragic 13.9% |
| Immigrants | Cambodia | 0.5 /100 | #250 | Tragic 13.9% |
| Yaqui | 0.5 /100 | #251 | Tragic 13.9% |
| Ghanaians | 0.5 /100 | #252 | Tragic 14.0% |
| Spanish Americans | 0.4 /100 | #253 | Tragic 14.0% |
| Marshallese | 0.3 /100 | #254 | Tragic 14.1% |