Armenian vs Cree Single Mother Poverty
COMPARE
Armenian
Cree
Single Mother Poverty
Single Mother Poverty Comparison
Armenians
Cree
26.8%
SINGLE MOTHER POVERTY
99.9/ 100
METRIC RATING
42nd/ 347
METRIC RANK
32.2%
SINGLE MOTHER POVERTY
0.0/ 100
METRIC RATING
281st/ 347
METRIC RANK
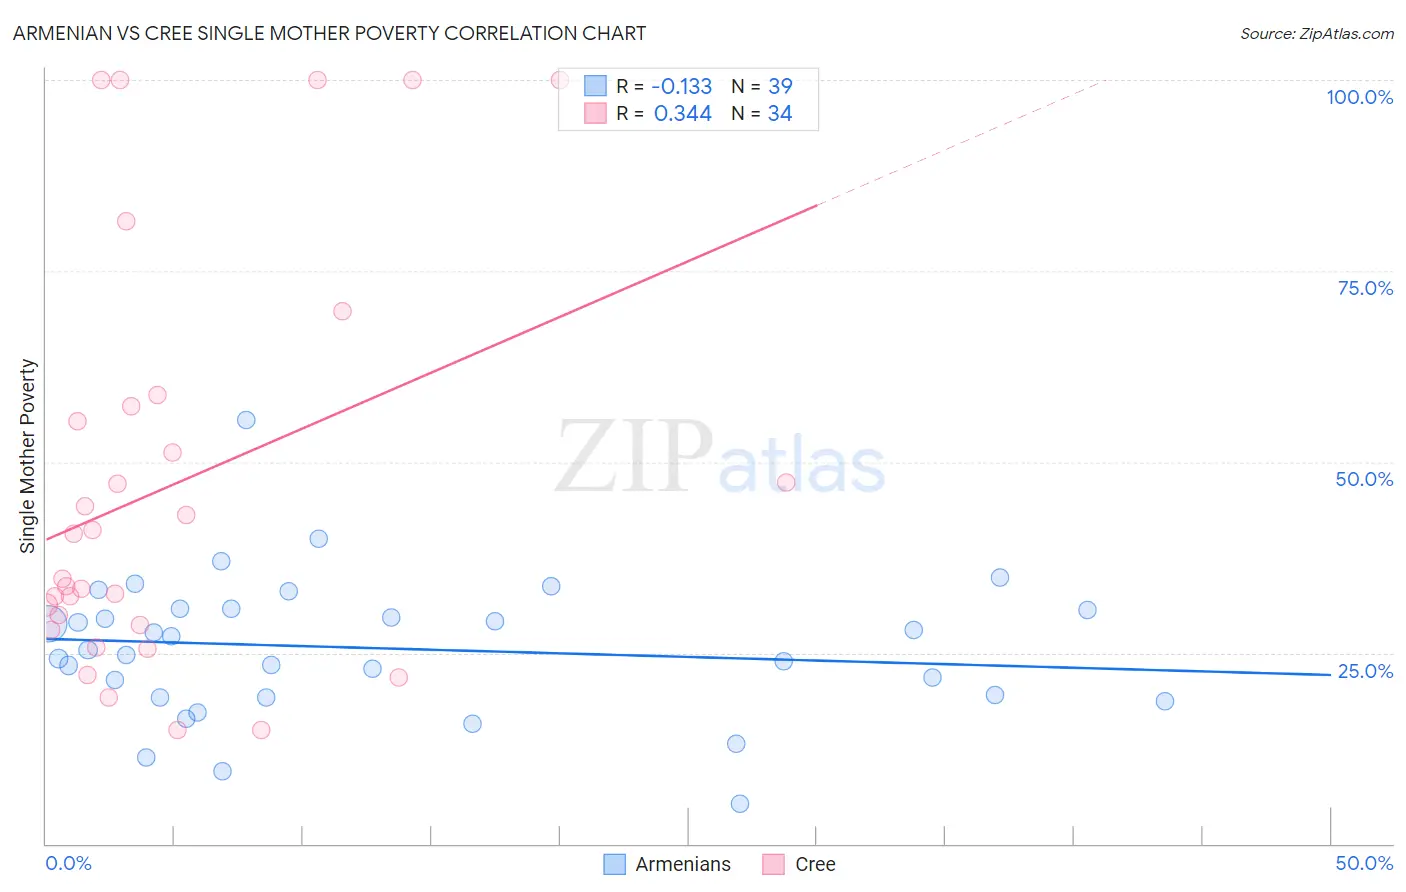
Armenian vs Cree Single Mother Poverty Correlation Chart
The statistical analysis conducted on geographies consisting of 302,870,774 people shows a poor negative correlation between the proportion of Armenians and poverty level among single mothers in the United States with a correlation coefficient (R) of -0.133 and weighted average of 26.8%. Similarly, the statistical analysis conducted on geographies consisting of 75,775,779 people shows a mild positive correlation between the proportion of Cree and poverty level among single mothers in the United States with a correlation coefficient (R) of 0.344 and weighted average of 32.2%, a difference of 20.0%.
Single Mother Poverty Correlation Summary
| Measurement | Armenian | Cree |
| Minimum | 5.2% | 14.9% |
| Maximum | 55.5% | 100.0% |
| Range | 50.3% | 85.1% |
| Mean | 25.6% | 47.0% |
| Median | 25.4% | 37.6% |
| Interquartile 25% (IQ1) | 19.2% | 28.6% |
| Interquartile 75% (IQ3) | 30.7% | 57.4% |
| Interquartile Range (IQR) | 11.5% | 28.8% |
| Standard Deviation (Sample) | 9.2% | 26.7% |
| Standard Deviation (Population) | 9.1% | 26.3% |
Similar Demographics by Single Mother Poverty
Demographics Similar to Armenians by Single Mother Poverty
In terms of single mother poverty, the demographic groups most similar to Armenians are Tsimshian (26.8%, a difference of 0.080%), Immigrants from Sierra Leone (26.9%, a difference of 0.22%), Immigrants from Greece (26.7%, a difference of 0.23%), Latvian (26.9%, a difference of 0.29%), and Immigrants from Vietnam (26.7%, a difference of 0.31%).
| Demographics | Rating | Rank | Single Mother Poverty |
| Maltese | 99.9 /100 | #35 | Exceptional 26.6% |
| Okinawans | 99.9 /100 | #36 | Exceptional 26.6% |
| Immigrants | Israel | 99.9 /100 | #37 | Exceptional 26.6% |
| Immigrants | Fiji | 99.9 /100 | #38 | Exceptional 26.6% |
| Sri Lankans | 99.9 /100 | #39 | Exceptional 26.7% |
| Immigrants | Vietnam | 99.9 /100 | #40 | Exceptional 26.7% |
| Immigrants | Greece | 99.9 /100 | #41 | Exceptional 26.7% |
| Armenians | 99.9 /100 | #42 | Exceptional 26.8% |
| Tsimshian | 99.9 /100 | #43 | Exceptional 26.8% |
| Immigrants | Sierra Leone | 99.9 /100 | #44 | Exceptional 26.9% |
| Latvians | 99.9 /100 | #45 | Exceptional 26.9% |
| Immigrants | Serbia | 99.9 /100 | #46 | Exceptional 26.9% |
| Egyptians | 99.8 /100 | #47 | Exceptional 26.9% |
| Immigrants | Poland | 99.8 /100 | #48 | Exceptional 26.9% |
| Cambodians | 99.8 /100 | #49 | Exceptional 27.0% |
Demographics Similar to Cree by Single Mother Poverty
In terms of single mother poverty, the demographic groups most similar to Cree are Nonimmigrants (32.2%, a difference of 0.030%), Immigrants from the Azores (32.2%, a difference of 0.11%), Marshallese (32.1%, a difference of 0.24%), Spanish American (32.3%, a difference of 0.36%), and Immigrants from Zaire (32.0%, a difference of 0.64%).
| Demographics | Rating | Rank | Single Mother Poverty |
| Bangladeshis | 0.1 /100 | #274 | Tragic 31.7% |
| Central Americans | 0.1 /100 | #275 | Tragic 31.8% |
| Delaware | 0.0 /100 | #276 | Tragic 31.8% |
| Mexican American Indians | 0.0 /100 | #277 | Tragic 31.9% |
| Immigrants | Zaire | 0.0 /100 | #278 | Tragic 32.0% |
| Marshallese | 0.0 /100 | #279 | Tragic 32.1% |
| Immigrants | Nonimmigrants | 0.0 /100 | #280 | Tragic 32.2% |
| Cree | 0.0 /100 | #281 | Tragic 32.2% |
| Immigrants | Azores | 0.0 /100 | #282 | Tragic 32.2% |
| Spanish Americans | 0.0 /100 | #283 | Tragic 32.3% |
| Indonesians | 0.0 /100 | #284 | Tragic 32.4% |
| Immigrants | Latin America | 0.0 /100 | #285 | Tragic 32.4% |
| Yup'ik | 0.0 /100 | #286 | Tragic 32.5% |
| Immigrants | Dominica | 0.0 /100 | #287 | Tragic 32.5% |
| Somalis | 0.0 /100 | #288 | Tragic 32.6% |