Armenian vs Immigrants from Chile Single Mother Poverty
COMPARE
Armenian
Immigrants from Chile
Single Mother Poverty
Single Mother Poverty Comparison
Armenians
Immigrants from Chile
26.8%
SINGLE MOTHER POVERTY
99.9/ 100
METRIC RATING
42nd/ 347
METRIC RANK
28.4%
SINGLE MOTHER POVERTY
90.8/ 100
METRIC RATING
126th/ 347
METRIC RANK
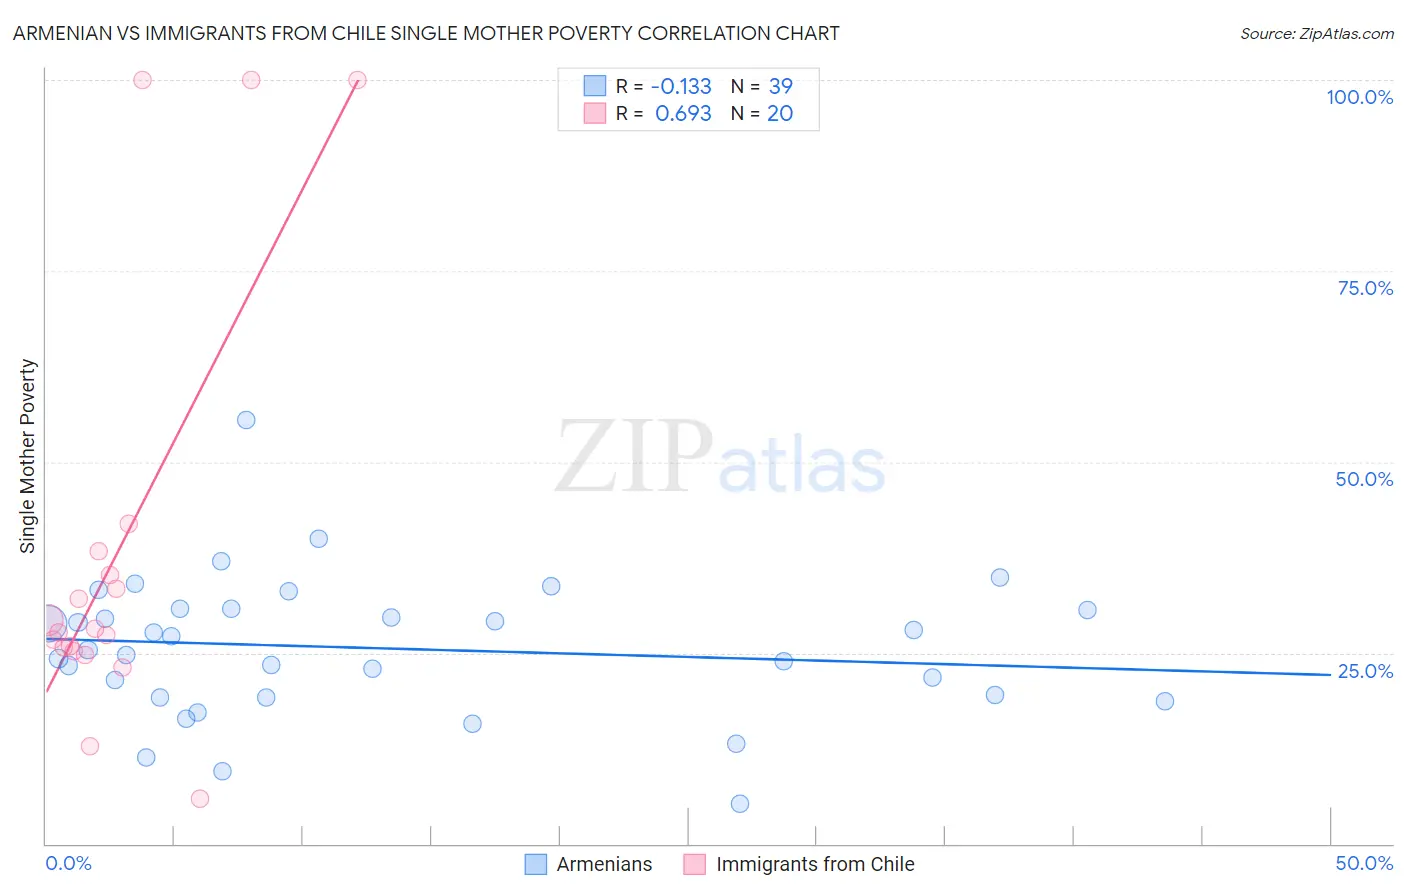
Armenian vs Immigrants from Chile Single Mother Poverty Correlation Chart
The statistical analysis conducted on geographies consisting of 302,870,774 people shows a poor negative correlation between the proportion of Armenians and poverty level among single mothers in the United States with a correlation coefficient (R) of -0.133 and weighted average of 26.8%. Similarly, the statistical analysis conducted on geographies consisting of 215,689,782 people shows a significant positive correlation between the proportion of Immigrants from Chile and poverty level among single mothers in the United States with a correlation coefficient (R) of 0.693 and weighted average of 28.4%, a difference of 5.8%.
Single Mother Poverty Correlation Summary
| Measurement | Armenian | Immigrants from Chile |
| Minimum | 5.2% | 5.9% |
| Maximum | 55.5% | 100.0% |
| Range | 50.3% | 94.1% |
| Mean | 25.6% | 38.1% |
| Median | 25.4% | 27.9% |
| Interquartile 25% (IQ1) | 19.2% | 25.4% |
| Interquartile 75% (IQ3) | 30.7% | 36.7% |
| Interquartile Range (IQR) | 11.5% | 11.3% |
| Standard Deviation (Sample) | 9.2% | 27.8% |
| Standard Deviation (Population) | 9.1% | 27.1% |
Similar Demographics by Single Mother Poverty
Demographics Similar to Armenians by Single Mother Poverty
In terms of single mother poverty, the demographic groups most similar to Armenians are Tsimshian (26.8%, a difference of 0.080%), Immigrants from Sierra Leone (26.9%, a difference of 0.22%), Immigrants from Greece (26.7%, a difference of 0.23%), Latvian (26.9%, a difference of 0.29%), and Immigrants from Vietnam (26.7%, a difference of 0.31%).
| Demographics | Rating | Rank | Single Mother Poverty |
| Maltese | 99.9 /100 | #35 | Exceptional 26.6% |
| Okinawans | 99.9 /100 | #36 | Exceptional 26.6% |
| Immigrants | Israel | 99.9 /100 | #37 | Exceptional 26.6% |
| Immigrants | Fiji | 99.9 /100 | #38 | Exceptional 26.6% |
| Sri Lankans | 99.9 /100 | #39 | Exceptional 26.7% |
| Immigrants | Vietnam | 99.9 /100 | #40 | Exceptional 26.7% |
| Immigrants | Greece | 99.9 /100 | #41 | Exceptional 26.7% |
| Armenians | 99.9 /100 | #42 | Exceptional 26.8% |
| Tsimshian | 99.9 /100 | #43 | Exceptional 26.8% |
| Immigrants | Sierra Leone | 99.9 /100 | #44 | Exceptional 26.9% |
| Latvians | 99.9 /100 | #45 | Exceptional 26.9% |
| Immigrants | Serbia | 99.9 /100 | #46 | Exceptional 26.9% |
| Egyptians | 99.8 /100 | #47 | Exceptional 26.9% |
| Immigrants | Poland | 99.8 /100 | #48 | Exceptional 26.9% |
| Cambodians | 99.8 /100 | #49 | Exceptional 27.0% |
Demographics Similar to Immigrants from Chile by Single Mother Poverty
In terms of single mother poverty, the demographic groups most similar to Immigrants from Chile are Kenyan (28.4%, a difference of 0.010%), Polish (28.4%, a difference of 0.010%), Immigrants from England (28.4%, a difference of 0.040%), South American (28.4%, a difference of 0.070%), and Norwegian (28.4%, a difference of 0.070%).
| Demographics | Rating | Rank | Single Mother Poverty |
| Immigrants | Syria | 92.4 /100 | #119 | Exceptional 28.3% |
| Cypriots | 92.3 /100 | #120 | Exceptional 28.3% |
| Immigrants | Afghanistan | 92.1 /100 | #121 | Exceptional 28.3% |
| Colombians | 91.8 /100 | #122 | Exceptional 28.3% |
| Uruguayans | 91.7 /100 | #123 | Exceptional 28.3% |
| Immigrants | Switzerland | 91.7 /100 | #124 | Exceptional 28.3% |
| Kenyans | 90.9 /100 | #125 | Exceptional 28.4% |
| Immigrants | Chile | 90.8 /100 | #126 | Exceptional 28.4% |
| Poles | 90.8 /100 | #127 | Exceptional 28.4% |
| Immigrants | England | 90.5 /100 | #128 | Exceptional 28.4% |
| South Americans | 90.4 /100 | #129 | Exceptional 28.4% |
| Norwegians | 90.4 /100 | #130 | Exceptional 28.4% |
| Immigrants | Austria | 90.3 /100 | #131 | Exceptional 28.4% |
| Immigrants | Morocco | 89.5 /100 | #132 | Excellent 28.4% |
| Swedes | 89.4 /100 | #133 | Excellent 28.4% |