Yuman vs Salvadoran Single Female Poverty
COMPARE
Yuman
Salvadoran
Single Female Poverty
Single Female Poverty Comparison
Yuman
Salvadorans
29.4%
SINGLE FEMALE POVERTY
0.0/ 100
METRIC RATING
337th/ 347
METRIC RANK
21.9%
SINGLE FEMALE POVERTY
5.5/ 100
METRIC RATING
228th/ 347
METRIC RANK
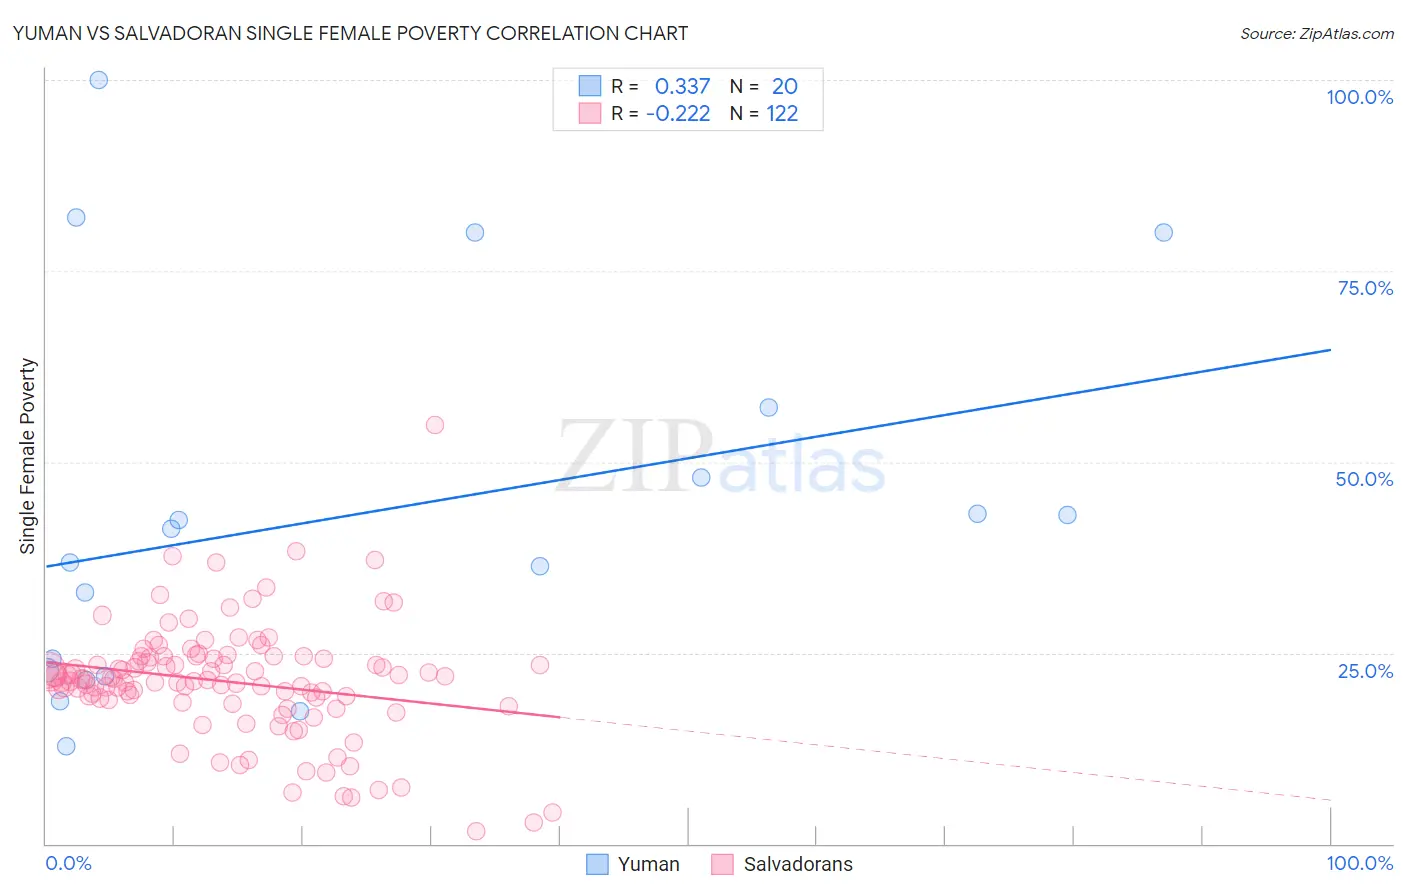
Yuman vs Salvadoran Single Female Poverty Correlation Chart
The statistical analysis conducted on geographies consisting of 40,574,686 people shows a mild positive correlation between the proportion of Yuman and poverty level among single females in the United States with a correlation coefficient (R) of 0.337 and weighted average of 29.4%. Similarly, the statistical analysis conducted on geographies consisting of 394,529,574 people shows a weak negative correlation between the proportion of Salvadorans and poverty level among single females in the United States with a correlation coefficient (R) of -0.222 and weighted average of 21.9%, a difference of 34.2%.
Single Female Poverty Correlation Summary
| Measurement | Yuman | Salvadoran |
| Minimum | 12.7% | 1.6% |
| Maximum | 100.0% | 54.8% |
| Range | 87.3% | 53.2% |
| Mean | 43.1% | 21.2% |
| Median | 39.0% | 21.5% |
| Interquartile 25% (IQ1) | 22.3% | 18.8% |
| Interquartile 75% (IQ3) | 52.6% | 24.3% |
| Interquartile Range (IQR) | 30.3% | 5.5% |
| Standard Deviation (Sample) | 24.9% | 7.6% |
| Standard Deviation (Population) | 24.2% | 7.5% |
Similar Demographics by Single Female Poverty
Demographics Similar to Yuman by Single Female Poverty
In terms of single female poverty, the demographic groups most similar to Yuman are Colville (29.1%, a difference of 1.3%), Immigrants from Yemen (28.9%, a difference of 1.8%), Pueblo (28.6%, a difference of 2.9%), Pima (30.3%, a difference of 3.0%), and Cheyenne (30.4%, a difference of 3.2%).
| Demographics | Rating | Rank | Single Female Poverty |
| Hopi | 0.0 /100 | #330 | Tragic 28.0% |
| Natives/Alaskans | 0.0 /100 | #331 | Tragic 28.2% |
| Yakama | 0.0 /100 | #332 | Tragic 28.3% |
| Ute | 0.0 /100 | #333 | Tragic 28.4% |
| Pueblo | 0.0 /100 | #334 | Tragic 28.6% |
| Immigrants | Yemen | 0.0 /100 | #335 | Tragic 28.9% |
| Colville | 0.0 /100 | #336 | Tragic 29.1% |
| Yuman | 0.0 /100 | #337 | Tragic 29.4% |
| Pima | 0.0 /100 | #338 | Tragic 30.3% |
| Cheyenne | 0.0 /100 | #339 | Tragic 30.4% |
| Cajuns | 0.0 /100 | #340 | Tragic 30.6% |
| Sioux | 0.0 /100 | #341 | Tragic 31.3% |
| Navajo | 0.0 /100 | #342 | Tragic 31.7% |
| Crow | 0.0 /100 | #343 | Tragic 32.4% |
| Lumbee | 0.0 /100 | #344 | Tragic 33.0% |
Demographics Similar to Salvadorans by Single Female Poverty
In terms of single female poverty, the demographic groups most similar to Salvadorans are Tlingit-Haida (21.9%, a difference of 0.030%), Immigrants from Western Africa (22.0%, a difference of 0.050%), Immigrants from Portugal (21.9%, a difference of 0.10%), Immigrants from Ghana (21.9%, a difference of 0.10%), and Welsh (22.0%, a difference of 0.14%).
| Demographics | Rating | Rank | Single Female Poverty |
| Immigrants | Grenada | 8.0 /100 | #221 | Tragic 21.8% |
| Immigrants | Eritrea | 7.9 /100 | #222 | Tragic 21.8% |
| Scottish | 7.3 /100 | #223 | Tragic 21.8% |
| Barbadians | 7.2 /100 | #224 | Tragic 21.8% |
| English | 6.4 /100 | #225 | Tragic 21.9% |
| Immigrants | Portugal | 5.8 /100 | #226 | Tragic 21.9% |
| Immigrants | Ghana | 5.8 /100 | #227 | Tragic 21.9% |
| Salvadorans | 5.5 /100 | #228 | Tragic 21.9% |
| Tlingit-Haida | 5.4 /100 | #229 | Tragic 21.9% |
| Immigrants | Western Africa | 5.3 /100 | #230 | Tragic 22.0% |
| Welsh | 5.0 /100 | #231 | Tragic 22.0% |
| Immigrants | Thailand | 5.0 /100 | #232 | Tragic 22.0% |
| Spaniards | 4.7 /100 | #233 | Tragic 22.0% |
| Spanish | 4.7 /100 | #234 | Tragic 22.0% |
| Dutch | 4.6 /100 | #235 | Tragic 22.0% |