Yuman vs Apache Disability
COMPARE
Yuman
Apache
Disability
Disability Comparison
Yuman
Apache
14.6%
DISABILITY
0.0/ 100
METRIC RATING
334th/ 347
METRIC RANK
13.9%
DISABILITY
0.0/ 100
METRIC RATING
320th/ 347
METRIC RANK
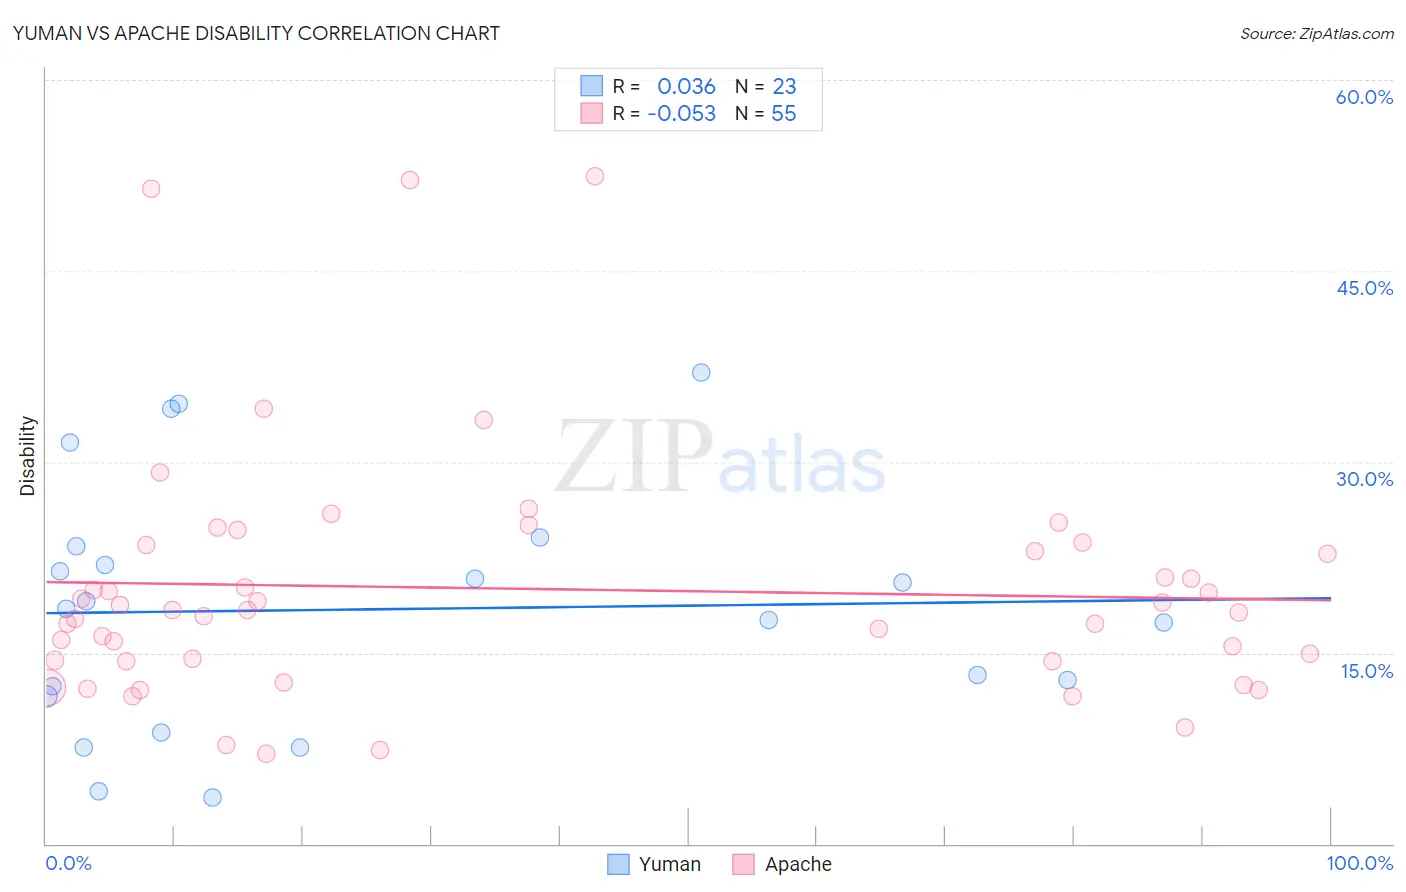
Yuman vs Apache Disability Correlation Chart
The statistical analysis conducted on geographies consisting of 40,663,643 people shows no correlation between the proportion of Yuman and percentage of population with a disability in the United States with a correlation coefficient (R) of 0.036 and weighted average of 14.6%. Similarly, the statistical analysis conducted on geographies consisting of 231,070,506 people shows a slight negative correlation between the proportion of Apache and percentage of population with a disability in the United States with a correlation coefficient (R) of -0.053 and weighted average of 13.9%, a difference of 5.5%.
Disability Correlation Summary
| Measurement | Yuman | Apache |
| Minimum | 3.6% | 7.1% |
| Maximum | 37.0% | 52.4% |
| Range | 33.4% | 45.3% |
| Mean | 18.4% | 20.0% |
| Median | 18.4% | 18.3% |
| Interquartile 25% (IQ1) | 11.6% | 14.4% |
| Interquartile 75% (IQ3) | 23.4% | 23.5% |
| Interquartile Range (IQR) | 11.8% | 9.1% |
| Standard Deviation (Sample) | 9.6% | 9.7% |
| Standard Deviation (Population) | 9.4% | 9.6% |
Demographics Similar to Yuman and Apache by Disability
In terms of disability, the demographic groups most similar to Yuman are Cajun (14.6%, a difference of 0.12%), Tohono O'odham (14.8%, a difference of 1.0%), Pueblo (14.4%, a difference of 1.2%), Alaskan Athabascan (14.4%, a difference of 1.2%), and Cherokee (14.8%, a difference of 1.5%). Similarly, the demographic groups most similar to Apache are Paiute (13.9%, a difference of 0.13%), Iroquois (13.8%, a difference of 0.29%), Menominee (13.8%, a difference of 0.51%), American (13.9%, a difference of 0.55%), and Immigrants from Cabo Verde (13.7%, a difference of 1.1%).
| Demographics | Rating | Rank | Disability |
| Immigrants | Cabo Verde | 0.0 /100 | #317 | Tragic 13.7% |
| Menominee | 0.0 /100 | #318 | Tragic 13.8% |
| Iroquois | 0.0 /100 | #319 | Tragic 13.8% |
| Apache | 0.0 /100 | #320 | Tragic 13.9% |
| Paiute | 0.0 /100 | #321 | Tragic 13.9% |
| Americans | 0.0 /100 | #322 | Tragic 13.9% |
| Comanche | 0.0 /100 | #323 | Tragic 14.1% |
| Chippewa | 0.0 /100 | #324 | Tragic 14.1% |
| Natives/Alaskans | 0.0 /100 | #325 | Tragic 14.2% |
| Osage | 0.0 /100 | #326 | Tragic 14.2% |
| Ottawa | 0.0 /100 | #327 | Tragic 14.2% |
| Immigrants | Azores | 0.0 /100 | #328 | Tragic 14.2% |
| Potawatomi | 0.0 /100 | #329 | Tragic 14.2% |
| Navajo | 0.0 /100 | #330 | Tragic 14.3% |
| Alaskan Athabascans | 0.0 /100 | #331 | Tragic 14.4% |
| Pueblo | 0.0 /100 | #332 | Tragic 14.4% |
| Cajuns | 0.0 /100 | #333 | Tragic 14.6% |
| Yuman | 0.0 /100 | #334 | Tragic 14.6% |
| Tohono O'odham | 0.0 /100 | #335 | Tragic 14.8% |
| Cherokee | 0.0 /100 | #336 | Tragic 14.8% |
| Seminole | 0.0 /100 | #337 | Tragic 14.9% |