Yuman vs Immigrants from Congo Single Female Poverty
COMPARE
Yuman
Immigrants from Congo
Single Female Poverty
Single Female Poverty Comparison
Yuman
Immigrants from Congo
29.4%
SINGLE FEMALE POVERTY
0.0/ 100
METRIC RATING
337th/ 347
METRIC RANK
25.3%
SINGLE FEMALE POVERTY
0.0/ 100
METRIC RATING
304th/ 347
METRIC RANK
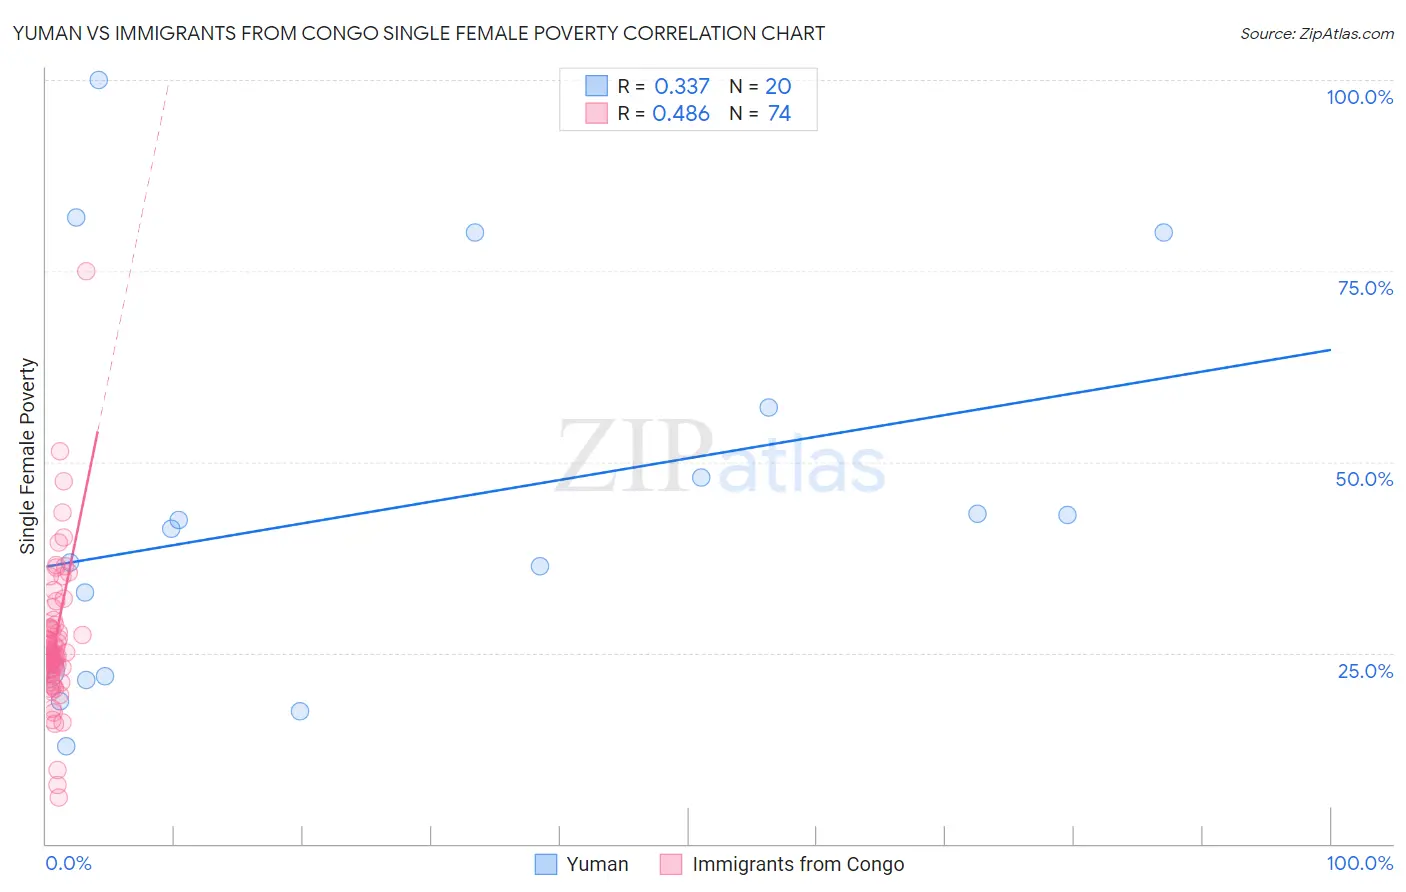
Yuman vs Immigrants from Congo Single Female Poverty Correlation Chart
The statistical analysis conducted on geographies consisting of 40,574,686 people shows a mild positive correlation between the proportion of Yuman and poverty level among single females in the United States with a correlation coefficient (R) of 0.337 and weighted average of 29.4%. Similarly, the statistical analysis conducted on geographies consisting of 91,983,877 people shows a moderate positive correlation between the proportion of Immigrants from Congo and poverty level among single females in the United States with a correlation coefficient (R) of 0.486 and weighted average of 25.3%, a difference of 16.4%.
Single Female Poverty Correlation Summary
| Measurement | Yuman | Immigrants from Congo |
| Minimum | 12.7% | 6.1% |
| Maximum | 100.0% | 75.0% |
| Range | 87.3% | 68.9% |
| Mean | 43.1% | 26.6% |
| Median | 39.0% | 24.9% |
| Interquartile 25% (IQ1) | 22.3% | 22.7% |
| Interquartile 75% (IQ3) | 52.6% | 28.3% |
| Interquartile Range (IQR) | 30.3% | 5.6% |
| Standard Deviation (Sample) | 24.9% | 9.6% |
| Standard Deviation (Population) | 24.2% | 9.5% |
Similar Demographics by Single Female Poverty
Demographics Similar to Yuman by Single Female Poverty
In terms of single female poverty, the demographic groups most similar to Yuman are Colville (29.1%, a difference of 1.3%), Immigrants from Yemen (28.9%, a difference of 1.8%), Pueblo (28.6%, a difference of 2.9%), Pima (30.3%, a difference of 3.0%), and Cheyenne (30.4%, a difference of 3.2%).
| Demographics | Rating | Rank | Single Female Poverty |
| Hopi | 0.0 /100 | #330 | Tragic 28.0% |
| Natives/Alaskans | 0.0 /100 | #331 | Tragic 28.2% |
| Yakama | 0.0 /100 | #332 | Tragic 28.3% |
| Ute | 0.0 /100 | #333 | Tragic 28.4% |
| Pueblo | 0.0 /100 | #334 | Tragic 28.6% |
| Immigrants | Yemen | 0.0 /100 | #335 | Tragic 28.9% |
| Colville | 0.0 /100 | #336 | Tragic 29.1% |
| Yuman | 0.0 /100 | #337 | Tragic 29.4% |
| Pima | 0.0 /100 | #338 | Tragic 30.3% |
| Cheyenne | 0.0 /100 | #339 | Tragic 30.4% |
| Cajuns | 0.0 /100 | #340 | Tragic 30.6% |
| Sioux | 0.0 /100 | #341 | Tragic 31.3% |
| Navajo | 0.0 /100 | #342 | Tragic 31.7% |
| Crow | 0.0 /100 | #343 | Tragic 32.4% |
| Lumbee | 0.0 /100 | #344 | Tragic 33.0% |
Demographics Similar to Immigrants from Congo by Single Female Poverty
In terms of single female poverty, the demographic groups most similar to Immigrants from Congo are Immigrants from Dominican Republic (25.3%, a difference of 0.010%), Immigrants from Mexico (25.3%, a difference of 0.11%), Somali (25.2%, a difference of 0.27%), Potawatomi (25.4%, a difference of 0.34%), and Aleut (25.4%, a difference of 0.50%).
| Demographics | Rating | Rank | Single Female Poverty |
| Immigrants | Central America | 0.0 /100 | #297 | Tragic 24.8% |
| Yaqui | 0.0 /100 | #298 | Tragic 24.9% |
| Mexicans | 0.0 /100 | #299 | Tragic 25.0% |
| Blackfeet | 0.0 /100 | #300 | Tragic 25.1% |
| Hondurans | 0.0 /100 | #301 | Tragic 25.1% |
| Shoshone | 0.0 /100 | #302 | Tragic 25.1% |
| Somalis | 0.0 /100 | #303 | Tragic 25.2% |
| Immigrants | Congo | 0.0 /100 | #304 | Tragic 25.3% |
| Immigrants | Dominican Republic | 0.0 /100 | #305 | Tragic 25.3% |
| Immigrants | Mexico | 0.0 /100 | #306 | Tragic 25.3% |
| Potawatomi | 0.0 /100 | #307 | Tragic 25.4% |
| Aleuts | 0.0 /100 | #308 | Tragic 25.4% |
| Dominicans | 0.0 /100 | #309 | Tragic 25.4% |
| Central American Indians | 0.0 /100 | #310 | Tragic 25.5% |
| Immigrants | Honduras | 0.0 /100 | #311 | Tragic 25.5% |