Yuman vs Immigrants from Kuwait Single Female Poverty
COMPARE
Yuman
Immigrants from Kuwait
Single Female Poverty
Single Female Poverty Comparison
Yuman
Immigrants from Kuwait
29.4%
SINGLE FEMALE POVERTY
0.0/ 100
METRIC RATING
337th/ 347
METRIC RANK
20.3%
SINGLE FEMALE POVERTY
90.4/ 100
METRIC RATING
139th/ 347
METRIC RANK
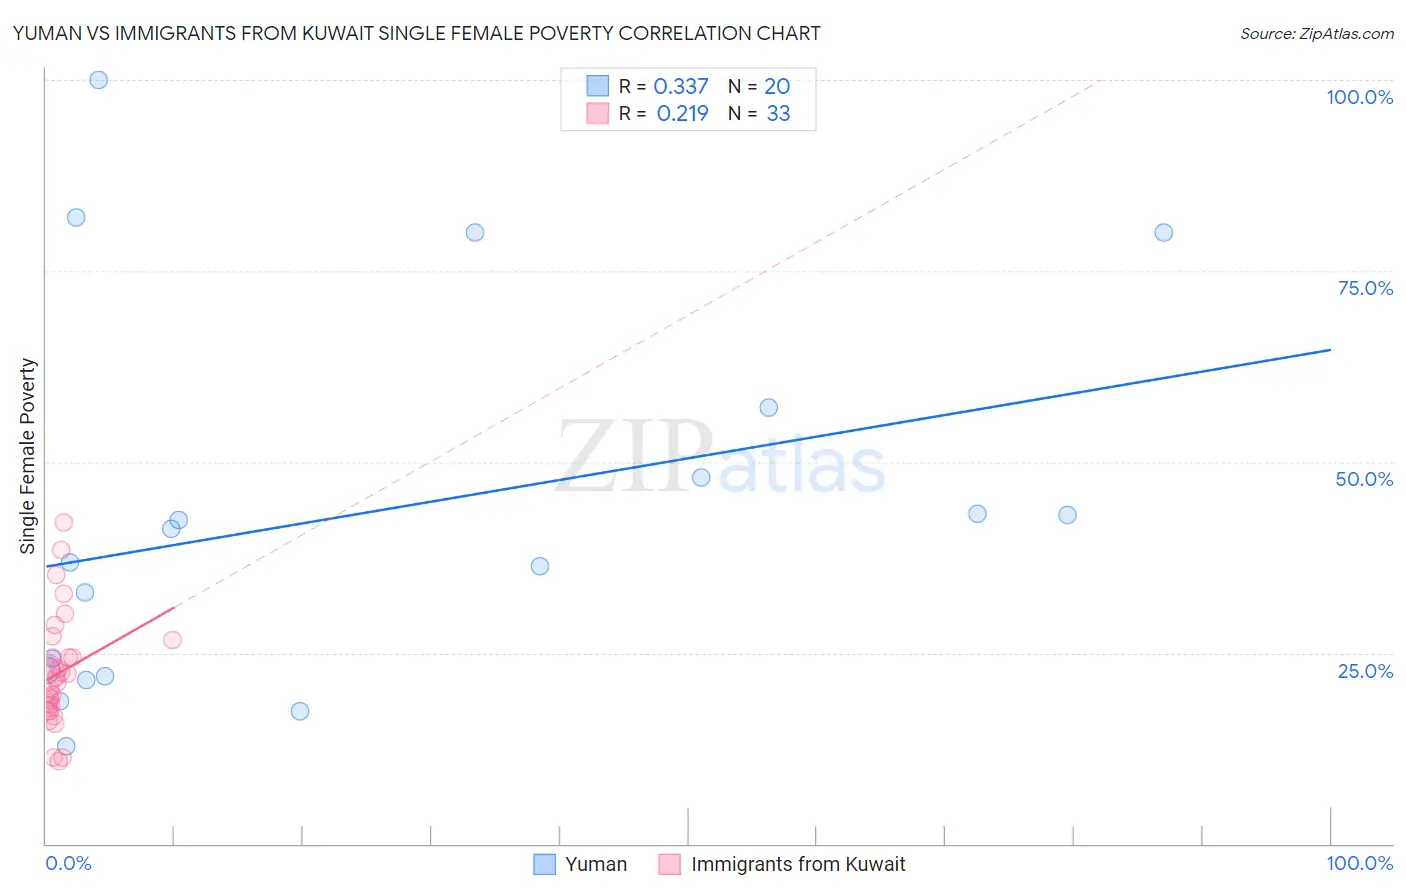
Yuman vs Immigrants from Kuwait Single Female Poverty Correlation Chart
The statistical analysis conducted on geographies consisting of 40,574,686 people shows a mild positive correlation between the proportion of Yuman and poverty level among single females in the United States with a correlation coefficient (R) of 0.337 and weighted average of 29.4%. Similarly, the statistical analysis conducted on geographies consisting of 136,370,378 people shows a weak positive correlation between the proportion of Immigrants from Kuwait and poverty level among single females in the United States with a correlation coefficient (R) of 0.219 and weighted average of 20.3%, a difference of 45.2%.
Single Female Poverty Correlation Summary
| Measurement | Yuman | Immigrants from Kuwait |
| Minimum | 12.7% | 10.8% |
| Maximum | 100.0% | 42.0% |
| Range | 87.3% | 31.3% |
| Mean | 43.1% | 22.4% |
| Median | 39.0% | 21.7% |
| Interquartile 25% (IQ1) | 22.3% | 17.7% |
| Interquartile 75% (IQ3) | 52.6% | 25.5% |
| Interquartile Range (IQR) | 30.3% | 7.9% |
| Standard Deviation (Sample) | 24.9% | 7.3% |
| Standard Deviation (Population) | 24.2% | 7.2% |
Similar Demographics by Single Female Poverty
Demographics Similar to Yuman by Single Female Poverty
In terms of single female poverty, the demographic groups most similar to Yuman are Colville (29.1%, a difference of 1.3%), Immigrants from Yemen (28.9%, a difference of 1.8%), Pueblo (28.6%, a difference of 2.9%), Pima (30.3%, a difference of 3.0%), and Cheyenne (30.4%, a difference of 3.2%).
| Demographics | Rating | Rank | Single Female Poverty |
| Hopi | 0.0 /100 | #330 | Tragic 28.0% |
| Natives/Alaskans | 0.0 /100 | #331 | Tragic 28.2% |
| Yakama | 0.0 /100 | #332 | Tragic 28.3% |
| Ute | 0.0 /100 | #333 | Tragic 28.4% |
| Pueblo | 0.0 /100 | #334 | Tragic 28.6% |
| Immigrants | Yemen | 0.0 /100 | #335 | Tragic 28.9% |
| Colville | 0.0 /100 | #336 | Tragic 29.1% |
| Yuman | 0.0 /100 | #337 | Tragic 29.4% |
| Pima | 0.0 /100 | #338 | Tragic 30.3% |
| Cheyenne | 0.0 /100 | #339 | Tragic 30.4% |
| Cajuns | 0.0 /100 | #340 | Tragic 30.6% |
| Sioux | 0.0 /100 | #341 | Tragic 31.3% |
| Navajo | 0.0 /100 | #342 | Tragic 31.7% |
| Crow | 0.0 /100 | #343 | Tragic 32.4% |
| Lumbee | 0.0 /100 | #344 | Tragic 33.0% |
Demographics Similar to Immigrants from Kuwait by Single Female Poverty
In terms of single female poverty, the demographic groups most similar to Immigrants from Kuwait are Slovene (20.3%, a difference of 0.010%), Syrian (20.3%, a difference of 0.010%), Immigrants from Nepal (20.3%, a difference of 0.040%), Immigrants from Canada (20.2%, a difference of 0.15%), and Immigrants from Iraq (20.2%, a difference of 0.16%).
| Demographics | Rating | Rank | Single Female Poverty |
| Uruguayans | 92.1 /100 | #132 | Exceptional 20.2% |
| Immigrants | England | 91.9 /100 | #133 | Exceptional 20.2% |
| Immigrants | Venezuela | 91.5 /100 | #134 | Exceptional 20.2% |
| Immigrants | Iraq | 91.2 /100 | #135 | Exceptional 20.2% |
| Immigrants | Canada | 91.2 /100 | #136 | Exceptional 20.2% |
| Immigrants | Nepal | 90.6 /100 | #137 | Exceptional 20.3% |
| Slovenes | 90.5 /100 | #138 | Exceptional 20.3% |
| Immigrants | Kuwait | 90.4 /100 | #139 | Exceptional 20.3% |
| Syrians | 90.4 /100 | #140 | Exceptional 20.3% |
| Immigrants | North America | 89.5 /100 | #141 | Excellent 20.3% |
| Immigrants | Uganda | 89.1 /100 | #142 | Excellent 20.3% |
| Australians | 88.4 /100 | #143 | Excellent 20.3% |
| Immigrants | Uzbekistan | 88.3 /100 | #144 | Excellent 20.3% |
| Austrians | 85.8 /100 | #145 | Excellent 20.4% |
| Venezuelans | 85.5 /100 | #146 | Excellent 20.4% |