Yuman vs Apache 8th Grade
COMPARE
Yuman
Apache
8th Grade
8th Grade Comparison
Yuman
Apache
94.9%
8TH GRADE
0.4/ 100
METRIC RATING
265th/ 347
METRIC RANK
95.5%
8TH GRADE
19.4/ 100
METRIC RATING
202nd/ 347
METRIC RANK
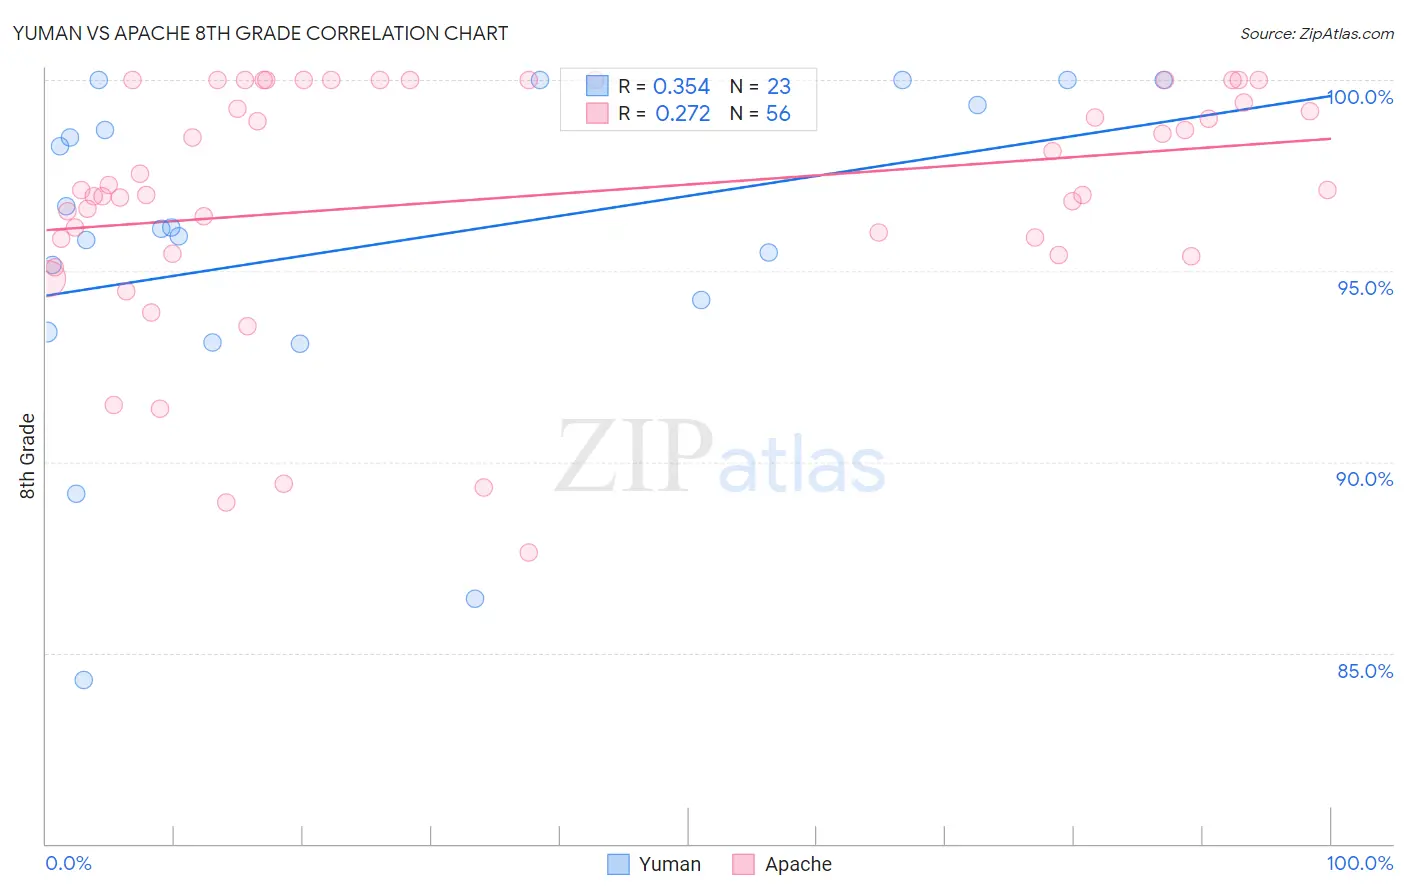
Yuman vs Apache 8th Grade Correlation Chart
The statistical analysis conducted on geographies consisting of 40,696,349 people shows a mild positive correlation between the proportion of Yuman and percentage of population with at least 8th grade education in the United States with a correlation coefficient (R) of 0.354 and weighted average of 94.9%. Similarly, the statistical analysis conducted on geographies consisting of 231,143,094 people shows a weak positive correlation between the proportion of Apache and percentage of population with at least 8th grade education in the United States with a correlation coefficient (R) of 0.272 and weighted average of 95.5%, a difference of 0.68%.
8th Grade Correlation Summary
| Measurement | Yuman | Apache |
| Minimum | 84.3% | 87.6% |
| Maximum | 100.0% | 100.0% |
| Range | 15.7% | 12.4% |
| Mean | 95.6% | 96.9% |
| Median | 96.1% | 97.1% |
| Interquartile 25% (IQ1) | 93.4% | 95.7% |
| Interquartile 75% (IQ3) | 99.3% | 100.0% |
| Interquartile Range (IQR) | 5.9% | 4.3% |
| Standard Deviation (Sample) | 4.3% | 3.2% |
| Standard Deviation (Population) | 4.2% | 3.1% |
Similar Demographics by 8th Grade
Demographics Similar to Yuman by 8th Grade
In terms of 8th grade, the demographic groups most similar to Yuman are South American (94.9%, a difference of 0.0%), Immigrants from Nigeria (94.9%, a difference of 0.010%), Immigrants from Hong Kong (94.9%, a difference of 0.010%), Immigrants from Costa Rica (94.9%, a difference of 0.030%), and West Indian (94.8%, a difference of 0.040%).
| Demographics | Rating | Rank | 8th Grade |
| Immigrants | Congo | 0.6 /100 | #258 | Tragic 94.9% |
| Ghanaians | 0.6 /100 | #259 | Tragic 94.9% |
| Immigrants | Jamaica | 0.6 /100 | #260 | Tragic 94.9% |
| Immigrants | Costa Rica | 0.5 /100 | #261 | Tragic 94.9% |
| Immigrants | Nigeria | 0.4 /100 | #262 | Tragic 94.9% |
| Immigrants | Hong Kong | 0.4 /100 | #263 | Tragic 94.9% |
| South Americans | 0.4 /100 | #264 | Tragic 94.9% |
| Yuman | 0.4 /100 | #265 | Tragic 94.9% |
| West Indians | 0.3 /100 | #266 | Tragic 94.8% |
| Immigrants | Ghana | 0.3 /100 | #267 | Tragic 94.8% |
| Immigrants | Uruguay | 0.3 /100 | #268 | Tragic 94.8% |
| Immigrants | Thailand | 0.2 /100 | #269 | Tragic 94.8% |
| Immigrants | Uzbekistan | 0.2 /100 | #270 | Tragic 94.8% |
| Immigrants | Afghanistan | 0.2 /100 | #271 | Tragic 94.8% |
| Immigrants | South America | 0.2 /100 | #272 | Tragic 94.8% |
Demographics Similar to Apache by 8th Grade
In terms of 8th grade, the demographic groups most similar to Apache are Immigrants from Argentina (95.5%, a difference of 0.010%), Moroccan (95.5%, a difference of 0.020%), Paraguayan (95.5%, a difference of 0.030%), Immigrants from Northern Africa (95.5%, a difference of 0.030%), and Argentinean (95.5%, a difference of 0.030%).
| Demographics | Rating | Rank | 8th Grade |
| Immigrants | Zaire | 25.2 /100 | #195 | Fair 95.6% |
| Assyrians/Chaldeans/Syriacs | 24.5 /100 | #196 | Fair 95.6% |
| Sierra Leoneans | 24.3 /100 | #197 | Fair 95.6% |
| Paraguayans | 22.6 /100 | #198 | Fair 95.5% |
| Immigrants | Northern Africa | 22.5 /100 | #199 | Fair 95.5% |
| Argentineans | 22.2 /100 | #200 | Fair 95.5% |
| Immigrants | Argentina | 20.6 /100 | #201 | Fair 95.5% |
| Apache | 19.4 /100 | #202 | Poor 95.5% |
| Moroccans | 17.4 /100 | #203 | Poor 95.5% |
| Hawaiians | 16.7 /100 | #204 | Poor 95.5% |
| Immigrants | Bahamas | 16.7 /100 | #205 | Poor 95.5% |
| Comanche | 16.3 /100 | #206 | Poor 95.5% |
| Immigrants | Sudan | 15.1 /100 | #207 | Poor 95.5% |
| Portuguese | 14.3 /100 | #208 | Poor 95.5% |
| Immigrants | Lebanon | 13.7 /100 | #209 | Poor 95.4% |