Scandinavian vs Immigrants from Oceania Family Poverty
COMPARE
Scandinavian
Immigrants from Oceania
Family Poverty
Family Poverty Comparison
Scandinavians
Immigrants from Oceania
7.6%
FAMILY POVERTY
99.1/ 100
METRIC RATING
42nd/ 347
METRIC RANK
8.7%
FAMILY POVERTY
71.2/ 100
METRIC RATING
156th/ 347
METRIC RANK
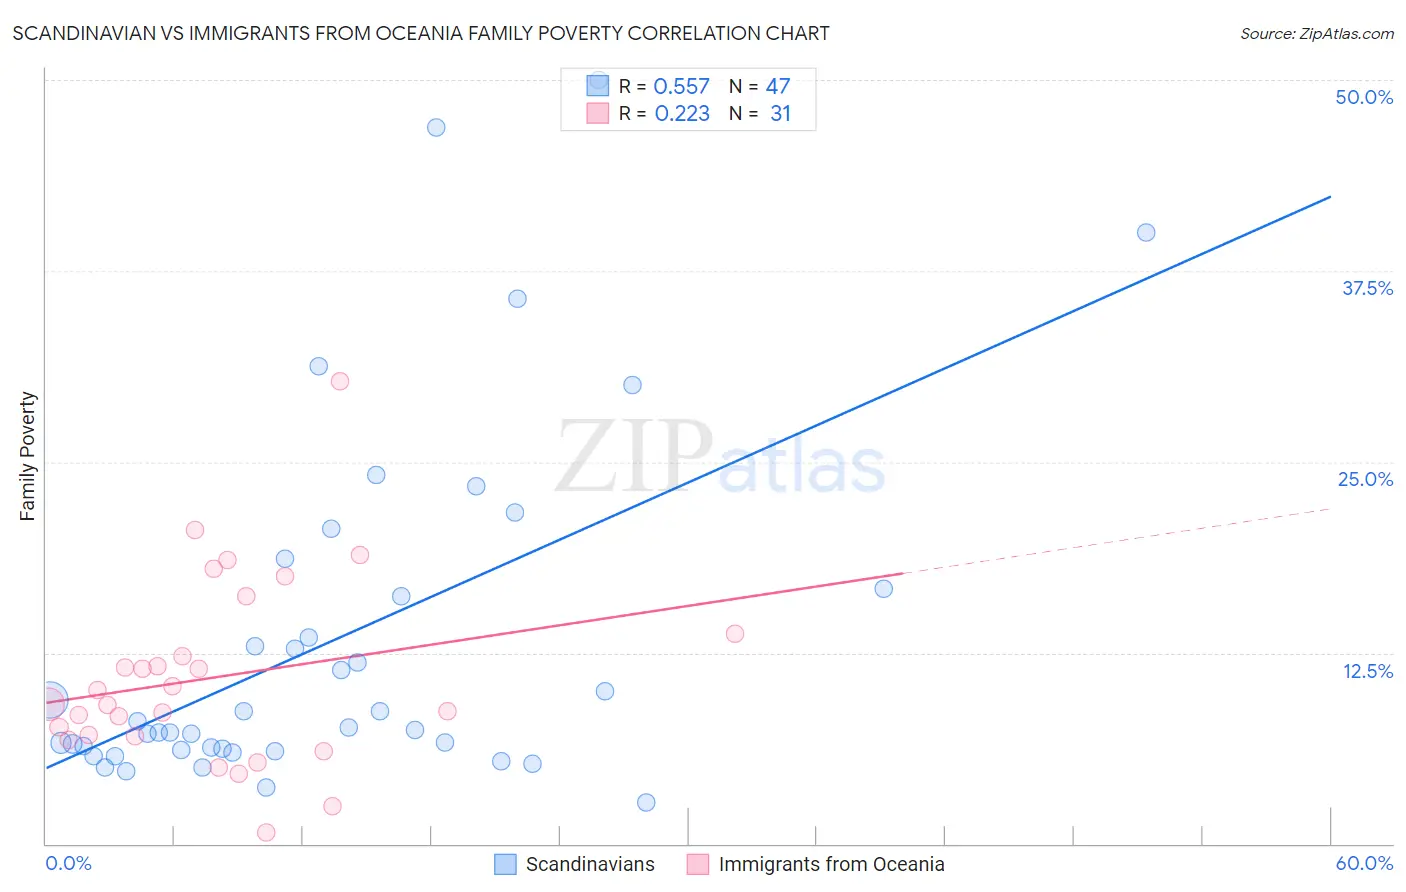
Scandinavian vs Immigrants from Oceania Family Poverty Correlation Chart
The statistical analysis conducted on geographies consisting of 470,471,633 people shows a substantial positive correlation between the proportion of Scandinavians and poverty level among families in the United States with a correlation coefficient (R) of 0.557 and weighted average of 7.6%. Similarly, the statistical analysis conducted on geographies consisting of 304,831,685 people shows a weak positive correlation between the proportion of Immigrants from Oceania and poverty level among families in the United States with a correlation coefficient (R) of 0.223 and weighted average of 8.7%, a difference of 14.7%.
Family Poverty Correlation Summary
| Measurement | Scandinavian | Immigrants from Oceania |
| Minimum | 2.7% | 0.73% |
| Maximum | 50.0% | 30.3% |
| Range | 47.3% | 29.6% |
| Mean | 13.3% | 10.9% |
| Median | 7.6% | 9.1% |
| Interquartile 25% (IQ1) | 6.2% | 7.0% |
| Interquartile 75% (IQ3) | 16.7% | 13.8% |
| Interquartile Range (IQR) | 10.5% | 6.7% |
| Standard Deviation (Sample) | 11.5% | 6.1% |
| Standard Deviation (Population) | 11.4% | 6.0% |
Similar Demographics by Family Poverty
Demographics Similar to Scandinavians by Family Poverty
In terms of family poverty, the demographic groups most similar to Scandinavians are Immigrants from Austria (7.6%, a difference of 0.24%), German (7.7%, a difference of 0.53%), Immigrants from Australia (7.6%, a difference of 0.63%), Okinawan (7.7%, a difference of 0.65%), and Tongan (7.7%, a difference of 0.67%).
| Demographics | Rating | Rank | Family Poverty |
| Greeks | 99.4 /100 | #35 | Exceptional 7.5% |
| Turks | 99.4 /100 | #36 | Exceptional 7.5% |
| Estonians | 99.4 /100 | #37 | Exceptional 7.5% |
| Bolivians | 99.3 /100 | #38 | Exceptional 7.5% |
| Carpatho Rusyns | 99.3 /100 | #39 | Exceptional 7.5% |
| Slovenes | 99.3 /100 | #40 | Exceptional 7.5% |
| Immigrants | Australia | 99.2 /100 | #41 | Exceptional 7.6% |
| Scandinavians | 99.1 /100 | #42 | Exceptional 7.6% |
| Immigrants | Austria | 99.1 /100 | #43 | Exceptional 7.6% |
| Germans | 99.0 /100 | #44 | Exceptional 7.7% |
| Okinawans | 98.9 /100 | #45 | Exceptional 7.7% |
| Tongans | 98.9 /100 | #46 | Exceptional 7.7% |
| Immigrants | Czechoslovakia | 98.9 /100 | #47 | Exceptional 7.7% |
| Immigrants | Sri Lanka | 98.9 /100 | #48 | Exceptional 7.7% |
| Immigrants | Bolivia | 98.9 /100 | #49 | Exceptional 7.7% |
Demographics Similar to Immigrants from Oceania by Family Poverty
In terms of family poverty, the demographic groups most similar to Immigrants from Oceania are Tsimshian (8.8%, a difference of 0.30%), White/Caucasian (8.8%, a difference of 0.34%), Immigrants from Kuwait (8.7%, a difference of 0.40%), Peruvian (8.8%, a difference of 0.50%), and Hungarian (8.8%, a difference of 0.64%).
| Demographics | Rating | Rank | Family Poverty |
| Mongolians | 80.4 /100 | #149 | Excellent 8.6% |
| Syrians | 80.3 /100 | #150 | Excellent 8.6% |
| Brazilians | 80.1 /100 | #151 | Excellent 8.6% |
| Samoans | 79.8 /100 | #152 | Good 8.6% |
| Immigrants | Spain | 79.1 /100 | #153 | Good 8.6% |
| Immigrants | Vietnam | 75.4 /100 | #154 | Good 8.7% |
| Immigrants | Kuwait | 73.6 /100 | #155 | Good 8.7% |
| Immigrants | Oceania | 71.2 /100 | #156 | Good 8.7% |
| Tsimshian | 69.3 /100 | #157 | Good 8.8% |
| Whites/Caucasians | 69.1 /100 | #158 | Good 8.8% |
| Peruvians | 68.0 /100 | #159 | Good 8.8% |
| Hungarians | 67.2 /100 | #160 | Good 8.8% |
| Immigrants | Northern Africa | 66.9 /100 | #161 | Good 8.8% |
| Ethiopians | 66.3 /100 | #162 | Good 8.8% |
| Pennsylvania Germans | 66.0 /100 | #163 | Good 8.8% |