Scandinavian vs Immigrants from Hong Kong Family Poverty
COMPARE
Scandinavian
Immigrants from Hong Kong
Family Poverty
Family Poverty Comparison
Scandinavians
Immigrants from Hong Kong
7.6%
FAMILY POVERTY
99.1/ 100
METRIC RATING
42nd/ 347
METRIC RANK
7.3%
FAMILY POVERTY
99.7/ 100
METRIC RATING
20th/ 347
METRIC RANK
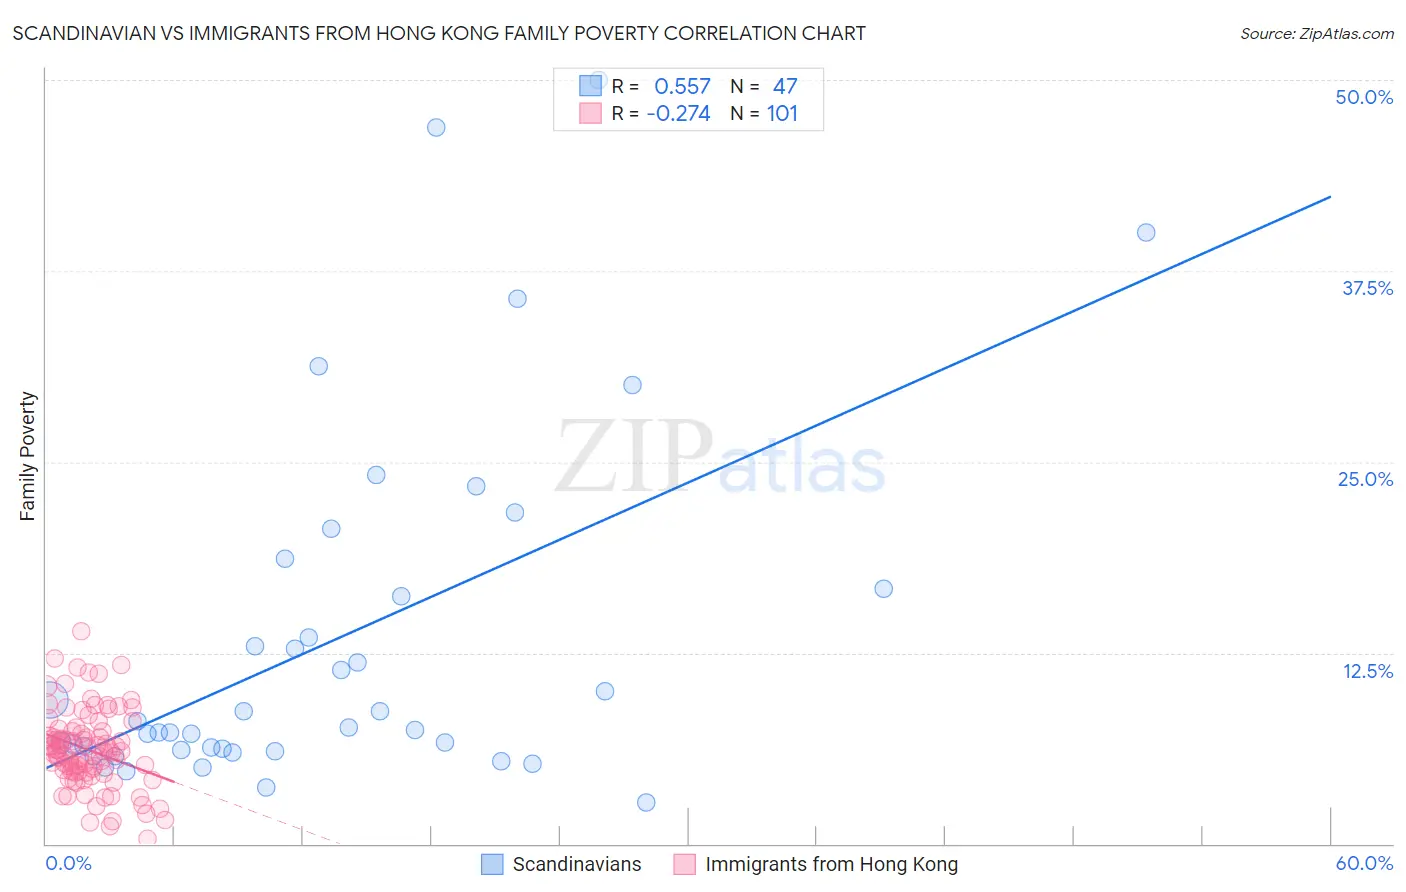
Scandinavian vs Immigrants from Hong Kong Family Poverty Correlation Chart
The statistical analysis conducted on geographies consisting of 470,471,633 people shows a substantial positive correlation between the proportion of Scandinavians and poverty level among families in the United States with a correlation coefficient (R) of 0.557 and weighted average of 7.6%. Similarly, the statistical analysis conducted on geographies consisting of 253,546,628 people shows a weak negative correlation between the proportion of Immigrants from Hong Kong and poverty level among families in the United States with a correlation coefficient (R) of -0.274 and weighted average of 7.3%, a difference of 5.0%.
Family Poverty Correlation Summary
| Measurement | Scandinavian | Immigrants from Hong Kong |
| Minimum | 2.7% | 0.35% |
| Maximum | 50.0% | 13.9% |
| Range | 47.3% | 13.5% |
| Mean | 13.3% | 6.2% |
| Median | 7.6% | 6.1% |
| Interquartile 25% (IQ1) | 6.2% | 4.7% |
| Interquartile 75% (IQ3) | 16.7% | 7.4% |
| Interquartile Range (IQR) | 10.5% | 2.6% |
| Standard Deviation (Sample) | 11.5% | 2.6% |
| Standard Deviation (Population) | 11.4% | 2.5% |
Similar Demographics by Family Poverty
Demographics Similar to Scandinavians by Family Poverty
In terms of family poverty, the demographic groups most similar to Scandinavians are Immigrants from Austria (7.6%, a difference of 0.24%), German (7.7%, a difference of 0.53%), Immigrants from Australia (7.6%, a difference of 0.63%), Okinawan (7.7%, a difference of 0.65%), and Tongan (7.7%, a difference of 0.67%).
| Demographics | Rating | Rank | Family Poverty |
| Greeks | 99.4 /100 | #35 | Exceptional 7.5% |
| Turks | 99.4 /100 | #36 | Exceptional 7.5% |
| Estonians | 99.4 /100 | #37 | Exceptional 7.5% |
| Bolivians | 99.3 /100 | #38 | Exceptional 7.5% |
| Carpatho Rusyns | 99.3 /100 | #39 | Exceptional 7.5% |
| Slovenes | 99.3 /100 | #40 | Exceptional 7.5% |
| Immigrants | Australia | 99.2 /100 | #41 | Exceptional 7.6% |
| Scandinavians | 99.1 /100 | #42 | Exceptional 7.6% |
| Immigrants | Austria | 99.1 /100 | #43 | Exceptional 7.6% |
| Germans | 99.0 /100 | #44 | Exceptional 7.7% |
| Okinawans | 98.9 /100 | #45 | Exceptional 7.7% |
| Tongans | 98.9 /100 | #46 | Exceptional 7.7% |
| Immigrants | Czechoslovakia | 98.9 /100 | #47 | Exceptional 7.7% |
| Immigrants | Sri Lanka | 98.9 /100 | #48 | Exceptional 7.7% |
| Immigrants | Bolivia | 98.9 /100 | #49 | Exceptional 7.7% |
Demographics Similar to Immigrants from Hong Kong by Family Poverty
In terms of family poverty, the demographic groups most similar to Immigrants from Hong Kong are Eastern European (7.2%, a difference of 0.16%), Immigrants from Iran (7.3%, a difference of 0.20%), Immigrants from Lithuania (7.2%, a difference of 0.46%), Luxembourger (7.2%, a difference of 0.48%), and Danish (7.3%, a difference of 0.64%).
| Demographics | Rating | Rank | Family Poverty |
| Swedes | 99.8 /100 | #13 | Exceptional 7.1% |
| Iranians | 99.8 /100 | #14 | Exceptional 7.1% |
| Lithuanians | 99.8 /100 | #15 | Exceptional 7.2% |
| Immigrants | South Central Asia | 99.8 /100 | #16 | Exceptional 7.2% |
| Luxembourgers | 99.8 /100 | #17 | Exceptional 7.2% |
| Immigrants | Lithuania | 99.8 /100 | #18 | Exceptional 7.2% |
| Eastern Europeans | 99.7 /100 | #19 | Exceptional 7.2% |
| Immigrants | Hong Kong | 99.7 /100 | #20 | Exceptional 7.3% |
| Immigrants | Iran | 99.7 /100 | #21 | Exceptional 7.3% |
| Danes | 99.7 /100 | #22 | Exceptional 7.3% |
| Assyrians/Chaldeans/Syriacs | 99.7 /100 | #23 | Exceptional 7.3% |
| Croatians | 99.7 /100 | #24 | Exceptional 7.3% |
| Burmese | 99.7 /100 | #25 | Exceptional 7.3% |
| Cypriots | 99.6 /100 | #26 | Exceptional 7.3% |
| Immigrants | Scotland | 99.6 /100 | #27 | Exceptional 7.3% |