Carpatho Rusyn vs Immigrants from Oceania Family Poverty
COMPARE
Carpatho Rusyn
Immigrants from Oceania
Family Poverty
Family Poverty Comparison
Carpatho Rusyns
Immigrants from Oceania
7.5%
FAMILY POVERTY
99.3/ 100
METRIC RATING
39th/ 347
METRIC RANK
8.7%
FAMILY POVERTY
71.2/ 100
METRIC RATING
156th/ 347
METRIC RANK
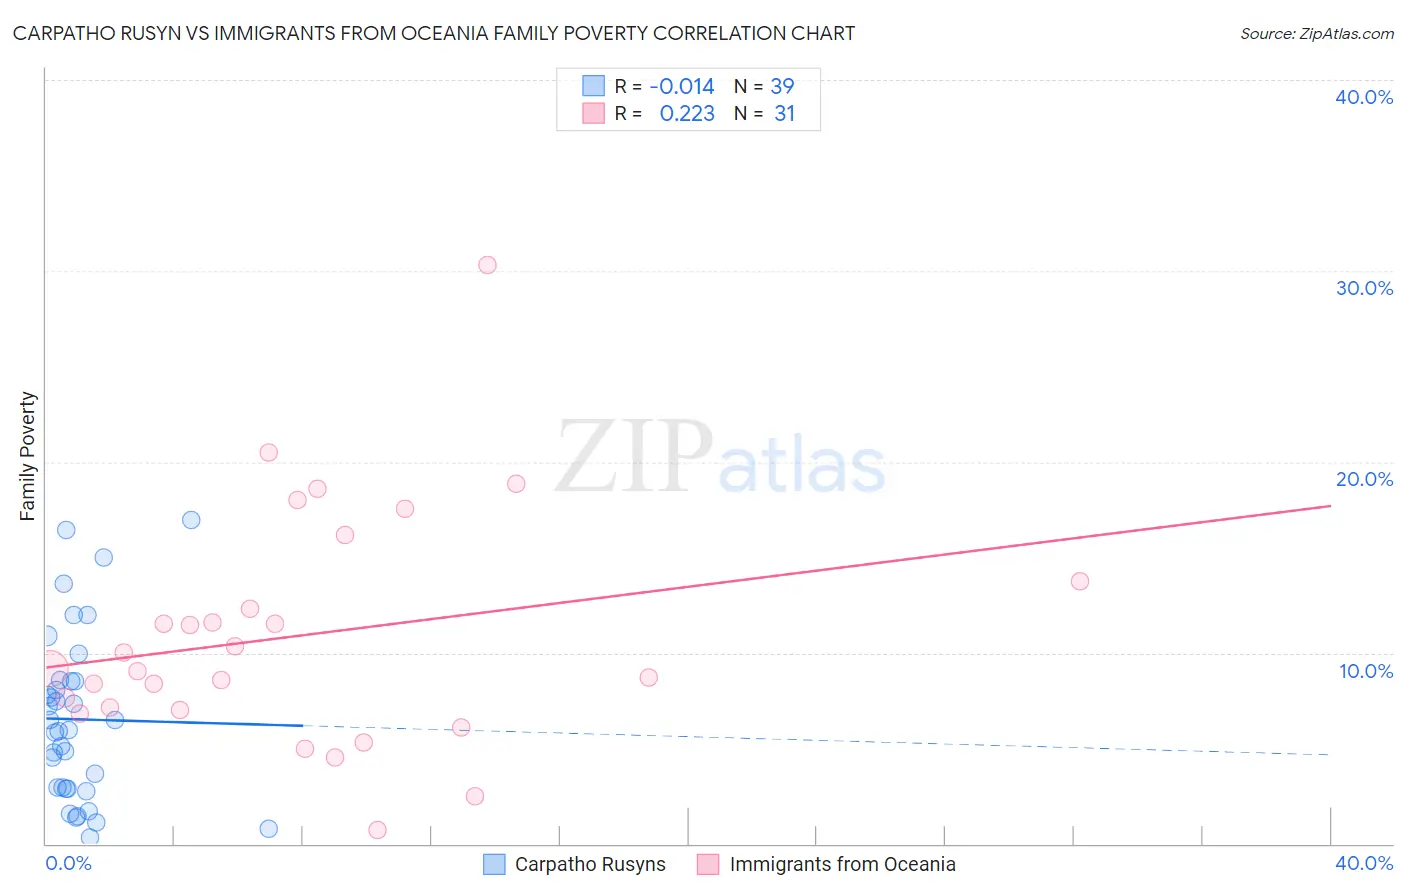
Carpatho Rusyn vs Immigrants from Oceania Family Poverty Correlation Chart
The statistical analysis conducted on geographies consisting of 58,816,515 people shows no correlation between the proportion of Carpatho Rusyns and poverty level among families in the United States with a correlation coefficient (R) of -0.014 and weighted average of 7.5%. Similarly, the statistical analysis conducted on geographies consisting of 304,831,685 people shows a weak positive correlation between the proportion of Immigrants from Oceania and poverty level among families in the United States with a correlation coefficient (R) of 0.223 and weighted average of 8.7%, a difference of 15.9%.
Family Poverty Correlation Summary
| Measurement | Carpatho Rusyn | Immigrants from Oceania |
| Minimum | 0.31% | 0.73% |
| Maximum | 16.9% | 30.3% |
| Range | 16.6% | 29.6% |
| Mean | 6.5% | 10.9% |
| Median | 5.9% | 9.1% |
| Interquartile 25% (IQ1) | 2.9% | 7.0% |
| Interquartile 75% (IQ3) | 8.5% | 13.8% |
| Interquartile Range (IQR) | 5.6% | 6.7% |
| Standard Deviation (Sample) | 4.4% | 6.1% |
| Standard Deviation (Population) | 4.3% | 6.0% |
Similar Demographics by Family Poverty
Demographics Similar to Carpatho Rusyns by Family Poverty
In terms of family poverty, the demographic groups most similar to Carpatho Rusyns are Slovene (7.5%, a difference of 0.040%), Bolivian (7.5%, a difference of 0.060%), Estonian (7.5%, a difference of 0.31%), Immigrants from Australia (7.6%, a difference of 0.34%), and Turkish (7.5%, a difference of 0.47%).
| Demographics | Rating | Rank | Family Poverty |
| Poles | 99.5 /100 | #32 | Exceptional 7.4% |
| Immigrants | Japan | 99.5 /100 | #33 | Exceptional 7.4% |
| Russians | 99.5 /100 | #34 | Exceptional 7.5% |
| Greeks | 99.4 /100 | #35 | Exceptional 7.5% |
| Turks | 99.4 /100 | #36 | Exceptional 7.5% |
| Estonians | 99.4 /100 | #37 | Exceptional 7.5% |
| Bolivians | 99.3 /100 | #38 | Exceptional 7.5% |
| Carpatho Rusyns | 99.3 /100 | #39 | Exceptional 7.5% |
| Slovenes | 99.3 /100 | #40 | Exceptional 7.5% |
| Immigrants | Australia | 99.2 /100 | #41 | Exceptional 7.6% |
| Scandinavians | 99.1 /100 | #42 | Exceptional 7.6% |
| Immigrants | Austria | 99.1 /100 | #43 | Exceptional 7.6% |
| Germans | 99.0 /100 | #44 | Exceptional 7.7% |
| Okinawans | 98.9 /100 | #45 | Exceptional 7.7% |
| Tongans | 98.9 /100 | #46 | Exceptional 7.7% |
Demographics Similar to Immigrants from Oceania by Family Poverty
In terms of family poverty, the demographic groups most similar to Immigrants from Oceania are Tsimshian (8.8%, a difference of 0.30%), White/Caucasian (8.8%, a difference of 0.34%), Immigrants from Kuwait (8.7%, a difference of 0.40%), Peruvian (8.8%, a difference of 0.50%), and Hungarian (8.8%, a difference of 0.64%).
| Demographics | Rating | Rank | Family Poverty |
| Mongolians | 80.4 /100 | #149 | Excellent 8.6% |
| Syrians | 80.3 /100 | #150 | Excellent 8.6% |
| Brazilians | 80.1 /100 | #151 | Excellent 8.6% |
| Samoans | 79.8 /100 | #152 | Good 8.6% |
| Immigrants | Spain | 79.1 /100 | #153 | Good 8.6% |
| Immigrants | Vietnam | 75.4 /100 | #154 | Good 8.7% |
| Immigrants | Kuwait | 73.6 /100 | #155 | Good 8.7% |
| Immigrants | Oceania | 71.2 /100 | #156 | Good 8.7% |
| Tsimshian | 69.3 /100 | #157 | Good 8.8% |
| Whites/Caucasians | 69.1 /100 | #158 | Good 8.8% |
| Peruvians | 68.0 /100 | #159 | Good 8.8% |
| Hungarians | 67.2 /100 | #160 | Good 8.8% |
| Immigrants | Northern Africa | 66.9 /100 | #161 | Good 8.8% |
| Ethiopians | 66.3 /100 | #162 | Good 8.8% |
| Pennsylvania Germans | 66.0 /100 | #163 | Good 8.8% |