Scandinavian vs Paraguayan Family Poverty
COMPARE
Scandinavian
Paraguayan
Family Poverty
Family Poverty Comparison
Scandinavians
Paraguayans
7.6%
FAMILY POVERTY
99.1/ 100
METRIC RATING
42nd/ 347
METRIC RANK
8.3%
FAMILY POVERTY
91.2/ 100
METRIC RATING
122nd/ 347
METRIC RANK
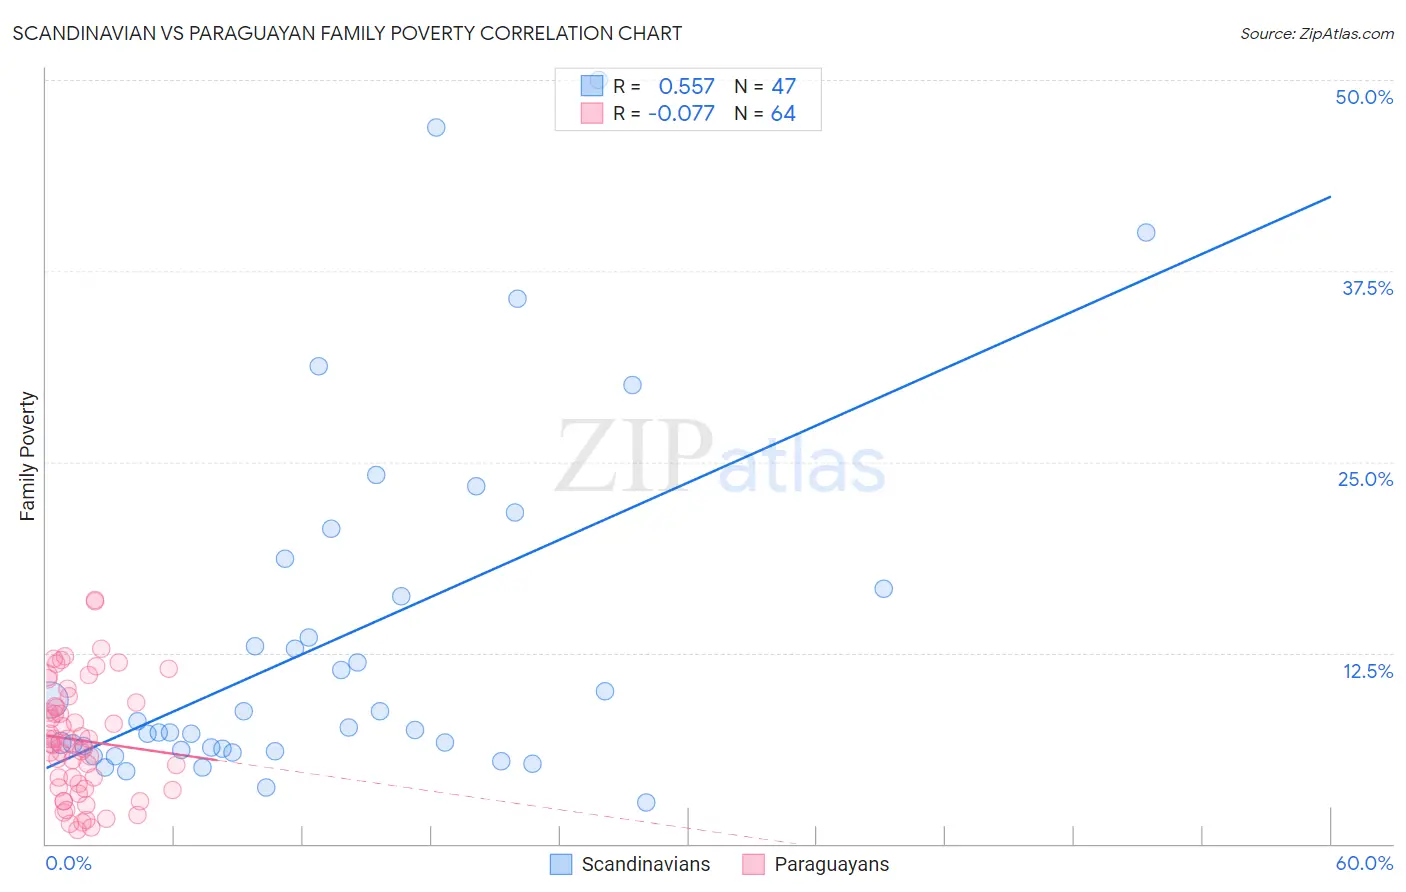
Scandinavian vs Paraguayan Family Poverty Correlation Chart
The statistical analysis conducted on geographies consisting of 470,471,633 people shows a substantial positive correlation between the proportion of Scandinavians and poverty level among families in the United States with a correlation coefficient (R) of 0.557 and weighted average of 7.6%. Similarly, the statistical analysis conducted on geographies consisting of 95,035,993 people shows a slight negative correlation between the proportion of Paraguayans and poverty level among families in the United States with a correlation coefficient (R) of -0.077 and weighted average of 8.3%, a difference of 9.2%.
Family Poverty Correlation Summary
| Measurement | Scandinavian | Paraguayan |
| Minimum | 2.7% | 0.93% |
| Maximum | 50.0% | 16.0% |
| Range | 47.3% | 15.0% |
| Mean | 13.3% | 6.8% |
| Median | 7.6% | 6.6% |
| Interquartile 25% (IQ1) | 6.2% | 3.6% |
| Interquartile 75% (IQ3) | 16.7% | 9.1% |
| Interquartile Range (IQR) | 10.5% | 5.5% |
| Standard Deviation (Sample) | 11.5% | 3.7% |
| Standard Deviation (Population) | 11.4% | 3.7% |
Similar Demographics by Family Poverty
Demographics Similar to Scandinavians by Family Poverty
In terms of family poverty, the demographic groups most similar to Scandinavians are Immigrants from Austria (7.6%, a difference of 0.24%), German (7.7%, a difference of 0.53%), Immigrants from Australia (7.6%, a difference of 0.63%), Okinawan (7.7%, a difference of 0.65%), and Tongan (7.7%, a difference of 0.67%).
| Demographics | Rating | Rank | Family Poverty |
| Greeks | 99.4 /100 | #35 | Exceptional 7.5% |
| Turks | 99.4 /100 | #36 | Exceptional 7.5% |
| Estonians | 99.4 /100 | #37 | Exceptional 7.5% |
| Bolivians | 99.3 /100 | #38 | Exceptional 7.5% |
| Carpatho Rusyns | 99.3 /100 | #39 | Exceptional 7.5% |
| Slovenes | 99.3 /100 | #40 | Exceptional 7.5% |
| Immigrants | Australia | 99.2 /100 | #41 | Exceptional 7.6% |
| Scandinavians | 99.1 /100 | #42 | Exceptional 7.6% |
| Immigrants | Austria | 99.1 /100 | #43 | Exceptional 7.6% |
| Germans | 99.0 /100 | #44 | Exceptional 7.7% |
| Okinawans | 98.9 /100 | #45 | Exceptional 7.7% |
| Tongans | 98.9 /100 | #46 | Exceptional 7.7% |
| Immigrants | Czechoslovakia | 98.9 /100 | #47 | Exceptional 7.7% |
| Immigrants | Sri Lanka | 98.9 /100 | #48 | Exceptional 7.7% |
| Immigrants | Bolivia | 98.9 /100 | #49 | Exceptional 7.7% |
Demographics Similar to Paraguayans by Family Poverty
In terms of family poverty, the demographic groups most similar to Paraguayans are Native Hawaiian (8.3%, a difference of 0.010%), Palestinian (8.3%, a difference of 0.070%), Soviet Union (8.3%, a difference of 0.17%), Immigrants from Egypt (8.3%, a difference of 0.18%), and Pakistani (8.3%, a difference of 0.21%).
| Demographics | Rating | Rank | Family Poverty |
| Immigrants | Israel | 93.5 /100 | #115 | Exceptional 8.2% |
| South Africans | 93.4 /100 | #116 | Exceptional 8.2% |
| Immigrants | Russia | 93.2 /100 | #117 | Exceptional 8.2% |
| Immigrants | Western Europe | 92.9 /100 | #118 | Exceptional 8.2% |
| French | 92.8 /100 | #119 | Exceptional 8.3% |
| Immigrants | Egypt | 91.6 /100 | #120 | Exceptional 8.3% |
| Native Hawaiians | 91.3 /100 | #121 | Exceptional 8.3% |
| Paraguayans | 91.2 /100 | #122 | Exceptional 8.3% |
| Palestinians | 91.1 /100 | #123 | Exceptional 8.3% |
| Soviet Union | 90.8 /100 | #124 | Exceptional 8.3% |
| Pakistanis | 90.8 /100 | #125 | Exceptional 8.3% |
| Icelanders | 90.3 /100 | #126 | Exceptional 8.3% |
| Immigrants | Hungary | 89.9 /100 | #127 | Excellent 8.4% |
| Argentineans | 89.6 /100 | #128 | Excellent 8.4% |
| Portuguese | 89.2 /100 | #129 | Excellent 8.4% |