Yugoslavian vs Immigrants from Oceania Family Poverty
COMPARE
Yugoslavian
Immigrants from Oceania
Family Poverty
Family Poverty Comparison
Yugoslavians
Immigrants from Oceania
8.5%
FAMILY POVERTY
83.5/ 100
METRIC RATING
142nd/ 347
METRIC RANK
8.7%
FAMILY POVERTY
71.2/ 100
METRIC RATING
156th/ 347
METRIC RANK
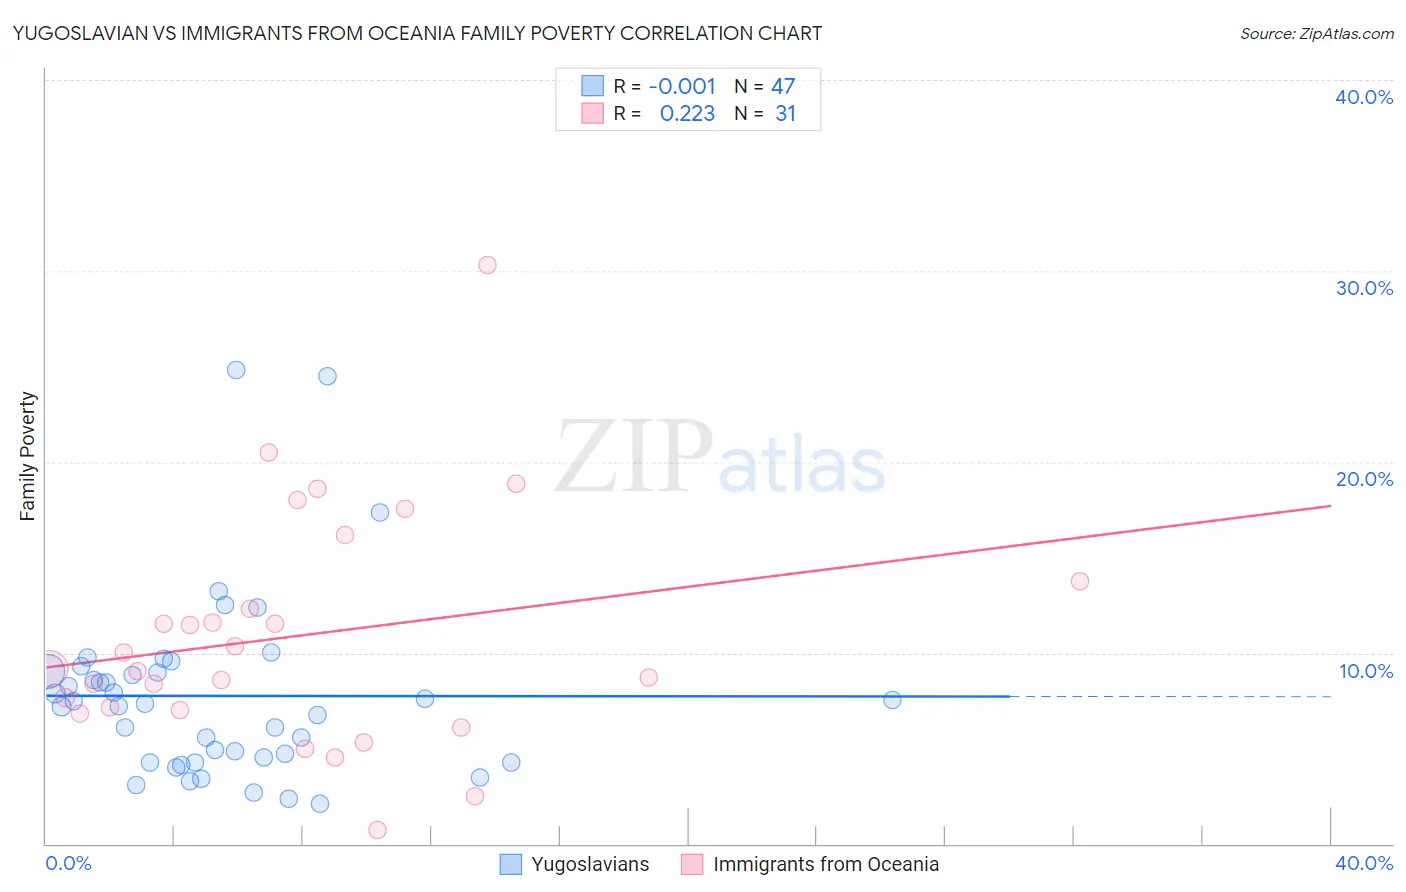
Yugoslavian vs Immigrants from Oceania Family Poverty Correlation Chart
The statistical analysis conducted on geographies consisting of 285,303,830 people shows no correlation between the proportion of Yugoslavians and poverty level among families in the United States with a correlation coefficient (R) of -0.001 and weighted average of 8.5%. Similarly, the statistical analysis conducted on geographies consisting of 304,831,685 people shows a weak positive correlation between the proportion of Immigrants from Oceania and poverty level among families in the United States with a correlation coefficient (R) of 0.223 and weighted average of 8.7%, a difference of 2.5%.
Family Poverty Correlation Summary
| Measurement | Yugoslavian | Immigrants from Oceania |
| Minimum | 2.1% | 0.73% |
| Maximum | 24.8% | 30.3% |
| Range | 22.7% | 29.6% |
| Mean | 7.7% | 10.9% |
| Median | 7.3% | 9.1% |
| Interquartile 25% (IQ1) | 4.3% | 7.0% |
| Interquartile 75% (IQ3) | 9.0% | 13.8% |
| Interquartile Range (IQR) | 4.8% | 6.7% |
| Standard Deviation (Sample) | 4.8% | 6.1% |
| Standard Deviation (Population) | 4.7% | 6.0% |
Demographics Similar to Yugoslavians and Immigrants from Oceania by Family Poverty
In terms of family poverty, the demographic groups most similar to Yugoslavians are Immigrants from Germany (8.5%, a difference of 0.030%), Albanian (8.5%, a difference of 0.050%), Immigrants from South Eastern Asia (8.5%, a difference of 0.070%), Immigrants from Belarus (8.5%, a difference of 0.080%), and Immigrants from Ukraine (8.5%, a difference of 0.11%). Similarly, the demographic groups most similar to Immigrants from Oceania are Tsimshian (8.8%, a difference of 0.30%), White/Caucasian (8.8%, a difference of 0.34%), Immigrants from Kuwait (8.7%, a difference of 0.40%), Peruvian (8.8%, a difference of 0.50%), and Immigrants from Vietnam (8.7%, a difference of 0.74%).
| Demographics | Rating | Rank | Family Poverty |
| Immigrants | Nepal | 84.2 /100 | #139 | Excellent 8.5% |
| Immigrants | Kazakhstan | 84.1 /100 | #140 | Excellent 8.5% |
| Immigrants | Ukraine | 83.9 /100 | #141 | Excellent 8.5% |
| Yugoslavians | 83.5 /100 | #142 | Excellent 8.5% |
| Immigrants | Germany | 83.3 /100 | #143 | Excellent 8.5% |
| Albanians | 83.3 /100 | #144 | Excellent 8.5% |
| Immigrants | South Eastern Asia | 83.2 /100 | #145 | Excellent 8.5% |
| Immigrants | Belarus | 83.2 /100 | #146 | Excellent 8.5% |
| Immigrants | Jordan | 83.0 /100 | #147 | Excellent 8.5% |
| Scotch-Irish | 82.2 /100 | #148 | Excellent 8.6% |
| Mongolians | 80.4 /100 | #149 | Excellent 8.6% |
| Syrians | 80.3 /100 | #150 | Excellent 8.6% |
| Brazilians | 80.1 /100 | #151 | Excellent 8.6% |
| Samoans | 79.8 /100 | #152 | Good 8.6% |
| Immigrants | Spain | 79.1 /100 | #153 | Good 8.6% |
| Immigrants | Vietnam | 75.4 /100 | #154 | Good 8.7% |
| Immigrants | Kuwait | 73.6 /100 | #155 | Good 8.7% |
| Immigrants | Oceania | 71.2 /100 | #156 | Good 8.7% |
| Tsimshian | 69.3 /100 | #157 | Good 8.8% |
| Whites/Caucasians | 69.1 /100 | #158 | Good 8.8% |
| Peruvians | 68.0 /100 | #159 | Good 8.8% |