Scandinavian vs Immigrants from Nepal Family Poverty
COMPARE
Scandinavian
Immigrants from Nepal
Family Poverty
Family Poverty Comparison
Scandinavians
Immigrants from Nepal
7.6%
FAMILY POVERTY
99.1/ 100
METRIC RATING
42nd/ 347
METRIC RANK
8.5%
FAMILY POVERTY
84.2/ 100
METRIC RATING
139th/ 347
METRIC RANK
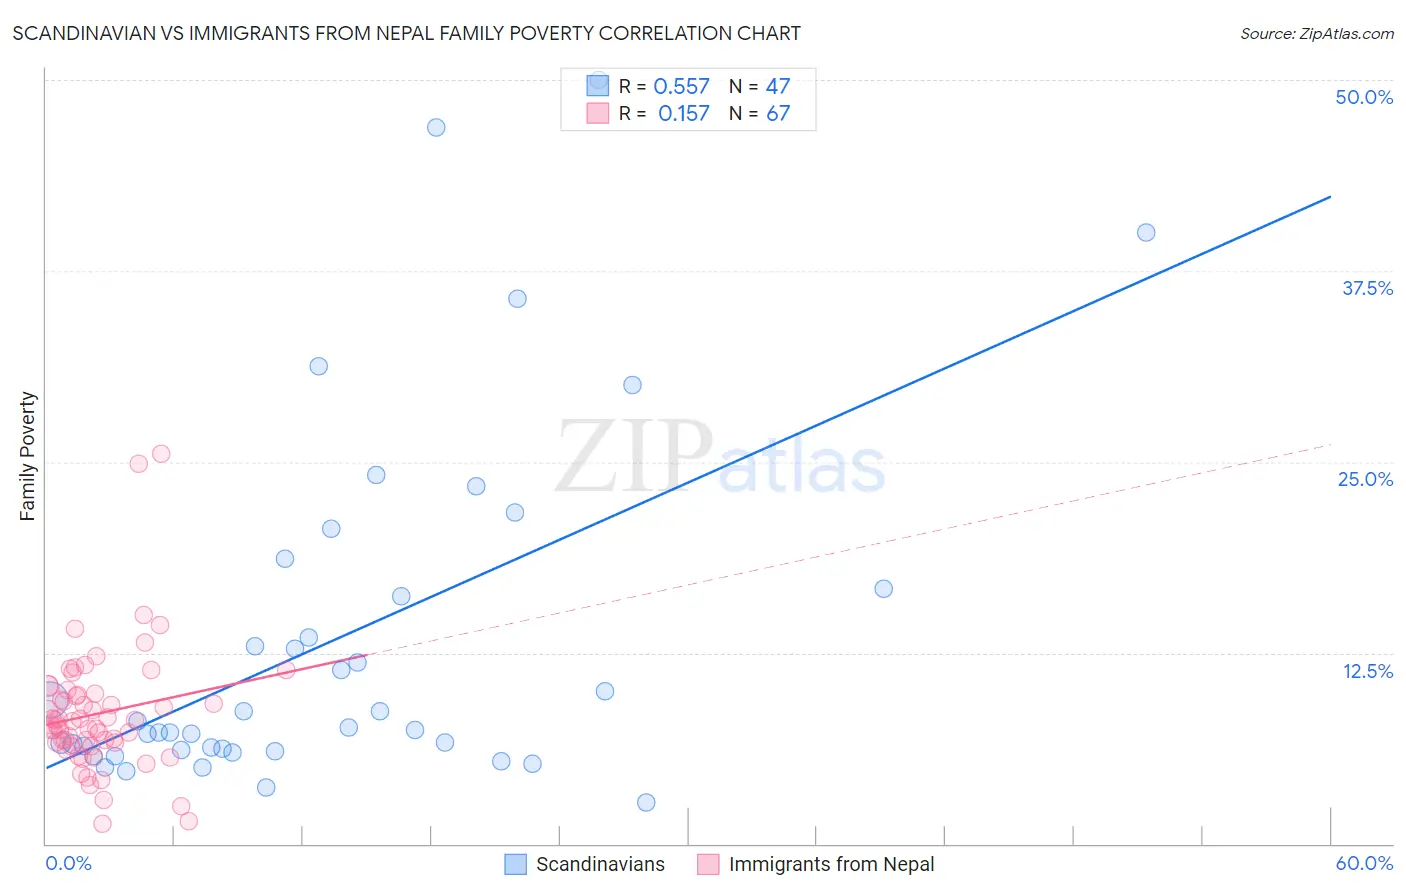
Scandinavian vs Immigrants from Nepal Family Poverty Correlation Chart
The statistical analysis conducted on geographies consisting of 470,471,633 people shows a substantial positive correlation between the proportion of Scandinavians and poverty level among families in the United States with a correlation coefficient (R) of 0.557 and weighted average of 7.6%. Similarly, the statistical analysis conducted on geographies consisting of 186,522,018 people shows a poor positive correlation between the proportion of Immigrants from Nepal and poverty level among families in the United States with a correlation coefficient (R) of 0.157 and weighted average of 8.5%, a difference of 11.8%.
Family Poverty Correlation Summary
| Measurement | Scandinavian | Immigrants from Nepal |
| Minimum | 2.7% | 1.3% |
| Maximum | 50.0% | 25.5% |
| Range | 47.3% | 24.2% |
| Mean | 13.3% | 8.5% |
| Median | 7.6% | 8.0% |
| Interquartile 25% (IQ1) | 6.2% | 6.6% |
| Interquartile 75% (IQ3) | 16.7% | 9.8% |
| Interquartile Range (IQR) | 10.5% | 3.2% |
| Standard Deviation (Sample) | 11.5% | 4.1% |
| Standard Deviation (Population) | 11.4% | 4.1% |
Similar Demographics by Family Poverty
Demographics Similar to Scandinavians by Family Poverty
In terms of family poverty, the demographic groups most similar to Scandinavians are Immigrants from Austria (7.6%, a difference of 0.24%), German (7.7%, a difference of 0.53%), Immigrants from Australia (7.6%, a difference of 0.63%), Okinawan (7.7%, a difference of 0.65%), and Tongan (7.7%, a difference of 0.67%).
| Demographics | Rating | Rank | Family Poverty |
| Greeks | 99.4 /100 | #35 | Exceptional 7.5% |
| Turks | 99.4 /100 | #36 | Exceptional 7.5% |
| Estonians | 99.4 /100 | #37 | Exceptional 7.5% |
| Bolivians | 99.3 /100 | #38 | Exceptional 7.5% |
| Carpatho Rusyns | 99.3 /100 | #39 | Exceptional 7.5% |
| Slovenes | 99.3 /100 | #40 | Exceptional 7.5% |
| Immigrants | Australia | 99.2 /100 | #41 | Exceptional 7.6% |
| Scandinavians | 99.1 /100 | #42 | Exceptional 7.6% |
| Immigrants | Austria | 99.1 /100 | #43 | Exceptional 7.6% |
| Germans | 99.0 /100 | #44 | Exceptional 7.7% |
| Okinawans | 98.9 /100 | #45 | Exceptional 7.7% |
| Tongans | 98.9 /100 | #46 | Exceptional 7.7% |
| Immigrants | Czechoslovakia | 98.9 /100 | #47 | Exceptional 7.7% |
| Immigrants | Sri Lanka | 98.9 /100 | #48 | Exceptional 7.7% |
| Immigrants | Bolivia | 98.9 /100 | #49 | Exceptional 7.7% |
Demographics Similar to Immigrants from Nepal by Family Poverty
In terms of family poverty, the demographic groups most similar to Immigrants from Nepal are Immigrants from Kazakhstan (8.5%, a difference of 0.030%), Immigrants from Ukraine (8.5%, a difference of 0.060%), Armenian (8.5%, a difference of 0.12%), Yugoslavian (8.5%, a difference of 0.17%), and Immigrants from Germany (8.5%, a difference of 0.21%).
| Demographics | Rating | Rank | Family Poverty |
| Immigrants | Argentina | 88.2 /100 | #132 | Excellent 8.4% |
| Sri Lankans | 86.6 /100 | #133 | Excellent 8.5% |
| Chileans | 86.6 /100 | #134 | Excellent 8.5% |
| Immigrants | Malaysia | 86.5 /100 | #135 | Excellent 8.5% |
| Immigrants | Brazil | 86.3 /100 | #136 | Excellent 8.5% |
| Immigrants | Southern Europe | 86.0 /100 | #137 | Excellent 8.5% |
| Armenians | 84.6 /100 | #138 | Excellent 8.5% |
| Immigrants | Nepal | 84.2 /100 | #139 | Excellent 8.5% |
| Immigrants | Kazakhstan | 84.1 /100 | #140 | Excellent 8.5% |
| Immigrants | Ukraine | 83.9 /100 | #141 | Excellent 8.5% |
| Yugoslavians | 83.5 /100 | #142 | Excellent 8.5% |
| Immigrants | Germany | 83.3 /100 | #143 | Excellent 8.5% |
| Albanians | 83.3 /100 | #144 | Excellent 8.5% |
| Immigrants | South Eastern Asia | 83.2 /100 | #145 | Excellent 8.5% |
| Immigrants | Belarus | 83.2 /100 | #146 | Excellent 8.5% |