Scandinavian vs Trinidadian and Tobagonian Family Poverty
COMPARE
Scandinavian
Trinidadian and Tobagonian
Family Poverty
Family Poverty Comparison
Scandinavians
Trinidadians and Tobagonians
7.6%
FAMILY POVERTY
99.1/ 100
METRIC RATING
42nd/ 347
METRIC RANK
10.9%
FAMILY POVERTY
0.1/ 100
METRIC RATING
264th/ 347
METRIC RANK
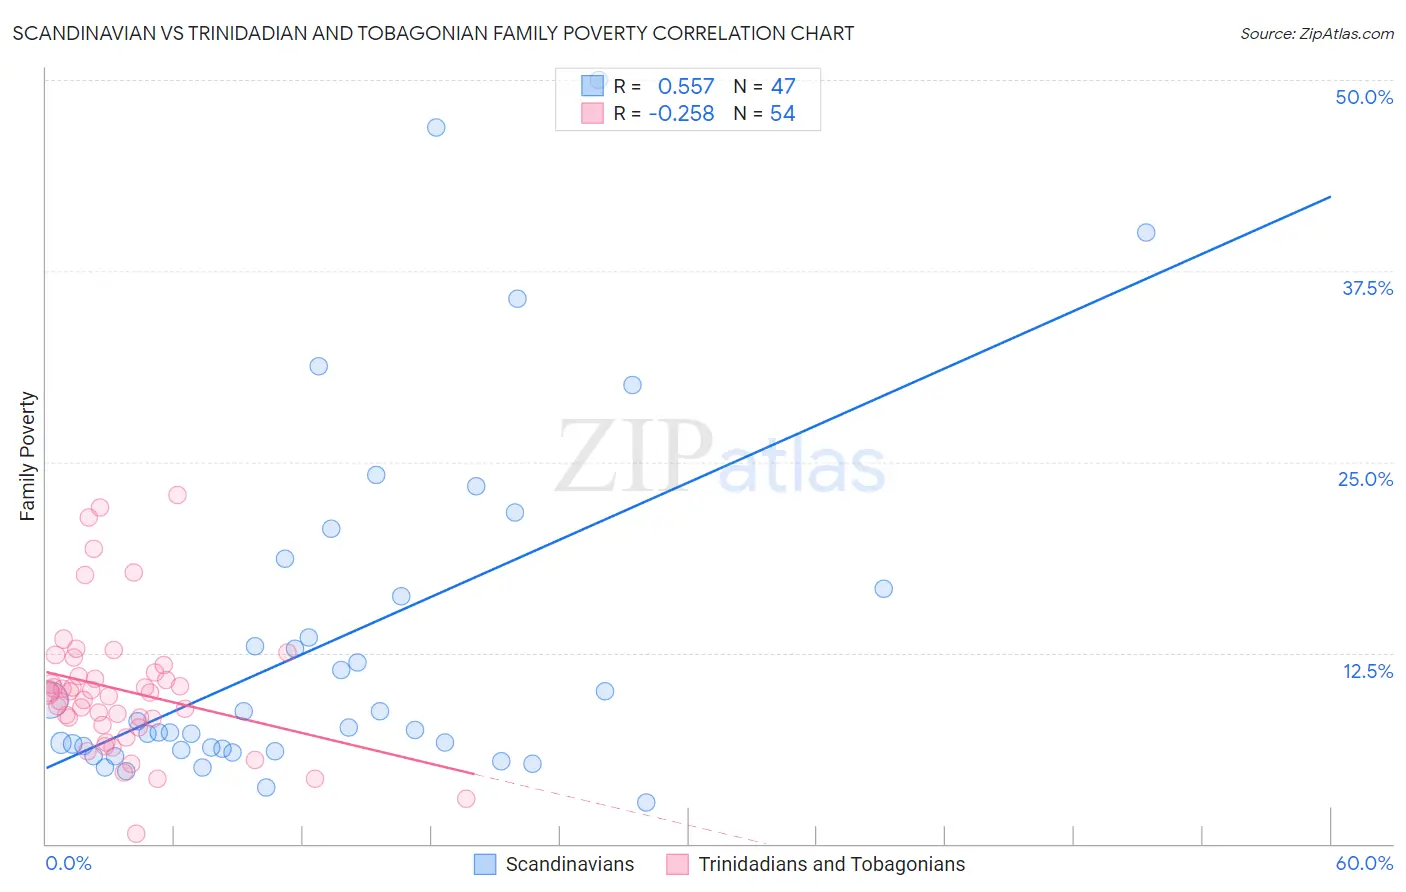
Scandinavian vs Trinidadian and Tobagonian Family Poverty Correlation Chart
The statistical analysis conducted on geographies consisting of 470,471,633 people shows a substantial positive correlation between the proportion of Scandinavians and poverty level among families in the United States with a correlation coefficient (R) of 0.557 and weighted average of 7.6%. Similarly, the statistical analysis conducted on geographies consisting of 219,444,154 people shows a weak negative correlation between the proportion of Trinidadians and Tobagonians and poverty level among families in the United States with a correlation coefficient (R) of -0.258 and weighted average of 10.9%, a difference of 43.7%.
Family Poverty Correlation Summary
| Measurement | Scandinavian | Trinidadian and Tobagonian |
| Minimum | 2.7% | 0.64% |
| Maximum | 50.0% | 22.8% |
| Range | 47.3% | 22.2% |
| Mean | 13.3% | 10.1% |
| Median | 7.6% | 9.9% |
| Interquartile 25% (IQ1) | 6.2% | 7.8% |
| Interquartile 75% (IQ3) | 16.7% | 11.2% |
| Interquartile Range (IQR) | 10.5% | 3.5% |
| Standard Deviation (Sample) | 11.5% | 4.5% |
| Standard Deviation (Population) | 11.4% | 4.4% |
Similar Demographics by Family Poverty
Demographics Similar to Scandinavians by Family Poverty
In terms of family poverty, the demographic groups most similar to Scandinavians are Immigrants from Austria (7.6%, a difference of 0.24%), German (7.7%, a difference of 0.53%), Immigrants from Australia (7.6%, a difference of 0.63%), Okinawan (7.7%, a difference of 0.65%), and Tongan (7.7%, a difference of 0.67%).
| Demographics | Rating | Rank | Family Poverty |
| Greeks | 99.4 /100 | #35 | Exceptional 7.5% |
| Turks | 99.4 /100 | #36 | Exceptional 7.5% |
| Estonians | 99.4 /100 | #37 | Exceptional 7.5% |
| Bolivians | 99.3 /100 | #38 | Exceptional 7.5% |
| Carpatho Rusyns | 99.3 /100 | #39 | Exceptional 7.5% |
| Slovenes | 99.3 /100 | #40 | Exceptional 7.5% |
| Immigrants | Australia | 99.2 /100 | #41 | Exceptional 7.6% |
| Scandinavians | 99.1 /100 | #42 | Exceptional 7.6% |
| Immigrants | Austria | 99.1 /100 | #43 | Exceptional 7.6% |
| Germans | 99.0 /100 | #44 | Exceptional 7.7% |
| Okinawans | 98.9 /100 | #45 | Exceptional 7.7% |
| Tongans | 98.9 /100 | #46 | Exceptional 7.7% |
| Immigrants | Czechoslovakia | 98.9 /100 | #47 | Exceptional 7.7% |
| Immigrants | Sri Lanka | 98.9 /100 | #48 | Exceptional 7.7% |
| Immigrants | Bolivia | 98.9 /100 | #49 | Exceptional 7.7% |
Demographics Similar to Trinidadians and Tobagonians by Family Poverty
In terms of family poverty, the demographic groups most similar to Trinidadians and Tobagonians are Cape Verdean (10.9%, a difference of 0.020%), Immigrants from Trinidad and Tobago (10.9%, a difference of 0.060%), Spanish American Indian (10.9%, a difference of 0.28%), Shoshone (10.9%, a difference of 0.41%), and Bangladeshi (10.9%, a difference of 0.44%).
| Demographics | Rating | Rank | Family Poverty |
| Immigrants | Ghana | 0.2 /100 | #257 | Tragic 10.8% |
| Sub-Saharan Africans | 0.2 /100 | #258 | Tragic 10.9% |
| Mexican American Indians | 0.2 /100 | #259 | Tragic 10.9% |
| Bangladeshis | 0.2 /100 | #260 | Tragic 10.9% |
| Shoshone | 0.2 /100 | #261 | Tragic 10.9% |
| Spanish American Indians | 0.2 /100 | #262 | Tragic 10.9% |
| Cape Verdeans | 0.1 /100 | #263 | Tragic 10.9% |
| Trinidadians and Tobagonians | 0.1 /100 | #264 | Tragic 10.9% |
| Immigrants | Trinidad and Tobago | 0.1 /100 | #265 | Tragic 10.9% |
| Immigrants | El Salvador | 0.1 /100 | #266 | Tragic 11.0% |
| Comanche | 0.1 /100 | #267 | Tragic 11.0% |
| Jamaicans | 0.1 /100 | #268 | Tragic 11.1% |
| Immigrants | Ecuador | 0.1 /100 | #269 | Tragic 11.1% |
| Immigrants | Nicaragua | 0.1 /100 | #270 | Tragic 11.1% |
| Immigrants | Bahamas | 0.1 /100 | #271 | Tragic 11.1% |