Scandinavian vs British West Indian Family Poverty
COMPARE
Scandinavian
British West Indian
Family Poverty
Family Poverty Comparison
Scandinavians
British West Indians
7.6%
FAMILY POVERTY
99.1/ 100
METRIC RATING
42nd/ 347
METRIC RANK
12.4%
FAMILY POVERTY
0.0/ 100
METRIC RATING
319th/ 347
METRIC RANK
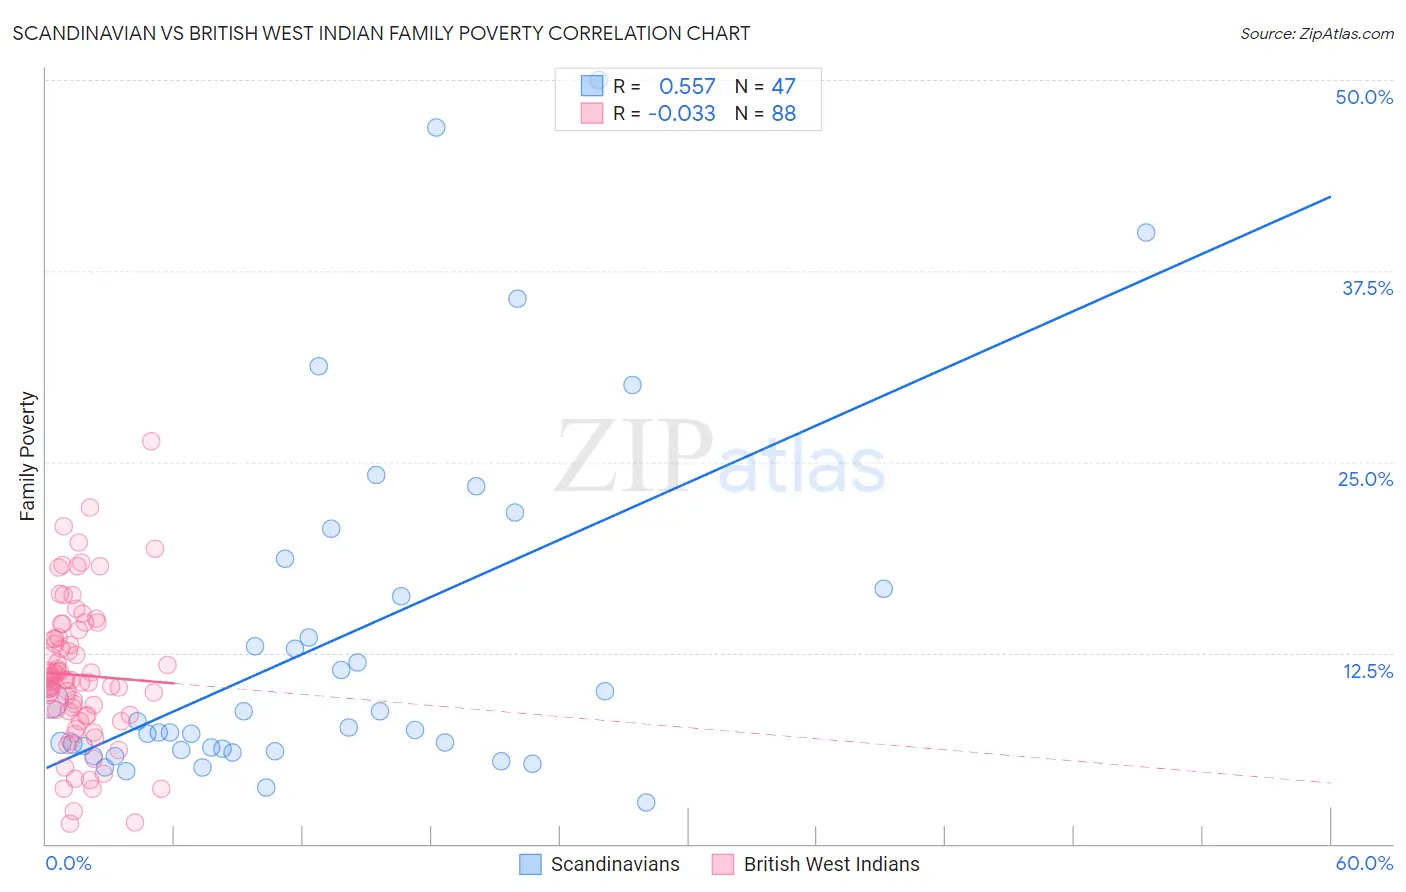
Scandinavian vs British West Indian Family Poverty Correlation Chart
The statistical analysis conducted on geographies consisting of 470,471,633 people shows a substantial positive correlation between the proportion of Scandinavians and poverty level among families in the United States with a correlation coefficient (R) of 0.557 and weighted average of 7.6%. Similarly, the statistical analysis conducted on geographies consisting of 152,513,896 people shows no correlation between the proportion of British West Indians and poverty level among families in the United States with a correlation coefficient (R) of -0.033 and weighted average of 12.4%, a difference of 62.8%.
Family Poverty Correlation Summary
| Measurement | Scandinavian | British West Indian |
| Minimum | 2.7% | 1.3% |
| Maximum | 50.0% | 26.4% |
| Range | 47.3% | 25.0% |
| Mean | 13.3% | 11.0% |
| Median | 7.6% | 10.6% |
| Interquartile 25% (IQ1) | 6.2% | 8.4% |
| Interquartile 75% (IQ3) | 16.7% | 13.5% |
| Interquartile Range (IQR) | 10.5% | 5.1% |
| Standard Deviation (Sample) | 11.5% | 4.7% |
| Standard Deviation (Population) | 11.4% | 4.7% |
Similar Demographics by Family Poverty
Demographics Similar to Scandinavians by Family Poverty
In terms of family poverty, the demographic groups most similar to Scandinavians are Immigrants from Austria (7.6%, a difference of 0.24%), German (7.7%, a difference of 0.53%), Immigrants from Australia (7.6%, a difference of 0.63%), Okinawan (7.7%, a difference of 0.65%), and Tongan (7.7%, a difference of 0.67%).
| Demographics | Rating | Rank | Family Poverty |
| Greeks | 99.4 /100 | #35 | Exceptional 7.5% |
| Turks | 99.4 /100 | #36 | Exceptional 7.5% |
| Estonians | 99.4 /100 | #37 | Exceptional 7.5% |
| Bolivians | 99.3 /100 | #38 | Exceptional 7.5% |
| Carpatho Rusyns | 99.3 /100 | #39 | Exceptional 7.5% |
| Slovenes | 99.3 /100 | #40 | Exceptional 7.5% |
| Immigrants | Australia | 99.2 /100 | #41 | Exceptional 7.6% |
| Scandinavians | 99.1 /100 | #42 | Exceptional 7.6% |
| Immigrants | Austria | 99.1 /100 | #43 | Exceptional 7.6% |
| Germans | 99.0 /100 | #44 | Exceptional 7.7% |
| Okinawans | 98.9 /100 | #45 | Exceptional 7.7% |
| Tongans | 98.9 /100 | #46 | Exceptional 7.7% |
| Immigrants | Czechoslovakia | 98.9 /100 | #47 | Exceptional 7.7% |
| Immigrants | Sri Lanka | 98.9 /100 | #48 | Exceptional 7.7% |
| Immigrants | Bolivia | 98.9 /100 | #49 | Exceptional 7.7% |
Demographics Similar to British West Indians by Family Poverty
In terms of family poverty, the demographic groups most similar to British West Indians are U.S. Virgin Islander (12.4%, a difference of 0.050%), Immigrants from Grenada (12.4%, a difference of 0.060%), Honduran (12.4%, a difference of 0.27%), Inupiat (12.5%, a difference of 0.48%), and Immigrants from Mexico (12.3%, a difference of 1.0%).
| Demographics | Rating | Rank | Family Poverty |
| Immigrants | Central America | 0.0 /100 | #312 | Tragic 12.1% |
| Immigrants | Caribbean | 0.0 /100 | #313 | Tragic 12.2% |
| Kiowa | 0.0 /100 | #314 | Tragic 12.2% |
| Immigrants | Mexico | 0.0 /100 | #315 | Tragic 12.3% |
| Hondurans | 0.0 /100 | #316 | Tragic 12.4% |
| Immigrants | Grenada | 0.0 /100 | #317 | Tragic 12.4% |
| U.S. Virgin Islanders | 0.0 /100 | #318 | Tragic 12.4% |
| British West Indians | 0.0 /100 | #319 | Tragic 12.4% |
| Inupiat | 0.0 /100 | #320 | Tragic 12.5% |
| Arapaho | 0.0 /100 | #321 | Tragic 12.7% |
| Immigrants | Honduras | 0.0 /100 | #322 | Tragic 12.7% |
| Menominee | 0.0 /100 | #323 | Tragic 12.7% |
| Immigrants | Dominica | 0.0 /100 | #324 | Tragic 12.7% |
| Paiute | 0.0 /100 | #325 | Tragic 13.0% |
| Colville | 0.0 /100 | #326 | Tragic 13.0% |