Scandinavian vs Immigrants from Canada Family Poverty
COMPARE
Scandinavian
Immigrants from Canada
Family Poverty
Family Poverty Comparison
Scandinavians
Immigrants from Canada
7.6%
FAMILY POVERTY
99.1/ 100
METRIC RATING
42nd/ 347
METRIC RANK
7.8%
FAMILY POVERTY
98.2/ 100
METRIC RATING
70th/ 347
METRIC RANK
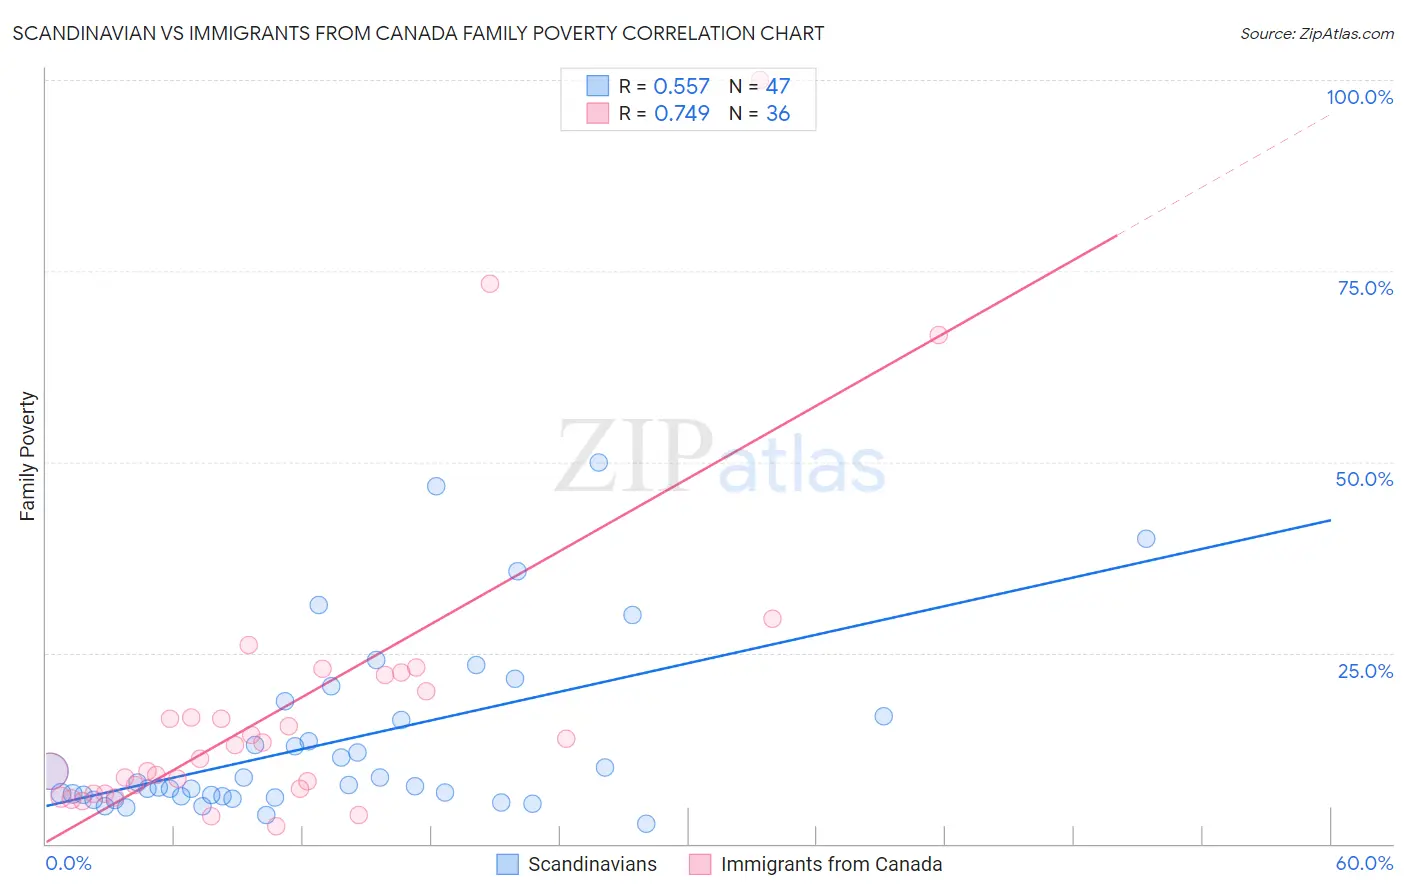
Scandinavian vs Immigrants from Canada Family Poverty Correlation Chart
The statistical analysis conducted on geographies consisting of 470,471,633 people shows a substantial positive correlation between the proportion of Scandinavians and poverty level among families in the United States with a correlation coefficient (R) of 0.557 and weighted average of 7.6%. Similarly, the statistical analysis conducted on geographies consisting of 457,293,796 people shows a strong positive correlation between the proportion of Immigrants from Canada and poverty level among families in the United States with a correlation coefficient (R) of 0.749 and weighted average of 7.8%, a difference of 2.7%.
Family Poverty Correlation Summary
| Measurement | Scandinavian | Immigrants from Canada |
| Minimum | 2.7% | 2.3% |
| Maximum | 50.0% | 100.0% |
| Range | 47.3% | 97.7% |
| Mean | 13.3% | 18.1% |
| Median | 7.6% | 12.1% |
| Interquartile 25% (IQ1) | 6.2% | 6.9% |
| Interquartile 75% (IQ3) | 16.7% | 21.0% |
| Interquartile Range (IQR) | 10.5% | 14.2% |
| Standard Deviation (Sample) | 11.5% | 20.6% |
| Standard Deviation (Population) | 11.4% | 20.3% |
Similar Demographics by Family Poverty
Demographics Similar to Scandinavians by Family Poverty
In terms of family poverty, the demographic groups most similar to Scandinavians are Immigrants from Austria (7.6%, a difference of 0.24%), German (7.7%, a difference of 0.53%), Immigrants from Australia (7.6%, a difference of 0.63%), Okinawan (7.7%, a difference of 0.65%), and Tongan (7.7%, a difference of 0.67%).
| Demographics | Rating | Rank | Family Poverty |
| Greeks | 99.4 /100 | #35 | Exceptional 7.5% |
| Turks | 99.4 /100 | #36 | Exceptional 7.5% |
| Estonians | 99.4 /100 | #37 | Exceptional 7.5% |
| Bolivians | 99.3 /100 | #38 | Exceptional 7.5% |
| Carpatho Rusyns | 99.3 /100 | #39 | Exceptional 7.5% |
| Slovenes | 99.3 /100 | #40 | Exceptional 7.5% |
| Immigrants | Australia | 99.2 /100 | #41 | Exceptional 7.6% |
| Scandinavians | 99.1 /100 | #42 | Exceptional 7.6% |
| Immigrants | Austria | 99.1 /100 | #43 | Exceptional 7.6% |
| Germans | 99.0 /100 | #44 | Exceptional 7.7% |
| Okinawans | 98.9 /100 | #45 | Exceptional 7.7% |
| Tongans | 98.9 /100 | #46 | Exceptional 7.7% |
| Immigrants | Czechoslovakia | 98.9 /100 | #47 | Exceptional 7.7% |
| Immigrants | Sri Lanka | 98.9 /100 | #48 | Exceptional 7.7% |
| Immigrants | Bolivia | 98.9 /100 | #49 | Exceptional 7.7% |
Demographics Similar to Immigrants from Canada by Family Poverty
In terms of family poverty, the demographic groups most similar to Immigrants from Canada are Cambodian (7.8%, a difference of 0.020%), Immigrants from Belgium (7.8%, a difference of 0.040%), Australian (7.8%, a difference of 0.060%), Immigrants from Romania (7.8%, a difference of 0.080%), and Austrian (7.8%, a difference of 0.080%).
| Demographics | Rating | Rank | Family Poverty |
| Zimbabweans | 98.4 /100 | #63 | Exceptional 7.8% |
| Koreans | 98.3 /100 | #64 | Exceptional 7.8% |
| Immigrants | Bulgaria | 98.3 /100 | #65 | Exceptional 7.8% |
| Dutch | 98.3 /100 | #66 | Exceptional 7.8% |
| Northern Europeans | 98.3 /100 | #67 | Exceptional 7.8% |
| Australians | 98.2 /100 | #68 | Exceptional 7.8% |
| Immigrants | Belgium | 98.2 /100 | #69 | Exceptional 7.8% |
| Immigrants | Canada | 98.2 /100 | #70 | Exceptional 7.8% |
| Cambodians | 98.2 /100 | #71 | Exceptional 7.8% |
| Immigrants | Romania | 98.2 /100 | #72 | Exceptional 7.8% |
| Austrians | 98.2 /100 | #73 | Exceptional 7.8% |
| Immigrants | China | 98.1 /100 | #74 | Exceptional 7.8% |
| Immigrants | Croatia | 98.1 /100 | #75 | Exceptional 7.8% |
| Immigrants | Latvia | 98.0 /100 | #76 | Exceptional 7.9% |
| Ukrainians | 98.0 /100 | #77 | Exceptional 7.9% |