Scandinavian vs Delaware Family Poverty
COMPARE
Scandinavian
Delaware
Family Poverty
Family Poverty Comparison
Scandinavians
Delaware
7.6%
FAMILY POVERTY
99.1/ 100
METRIC RATING
42nd/ 347
METRIC RANK
9.2%
FAMILY POVERTY
35.4/ 100
METRIC RATING
187th/ 347
METRIC RANK
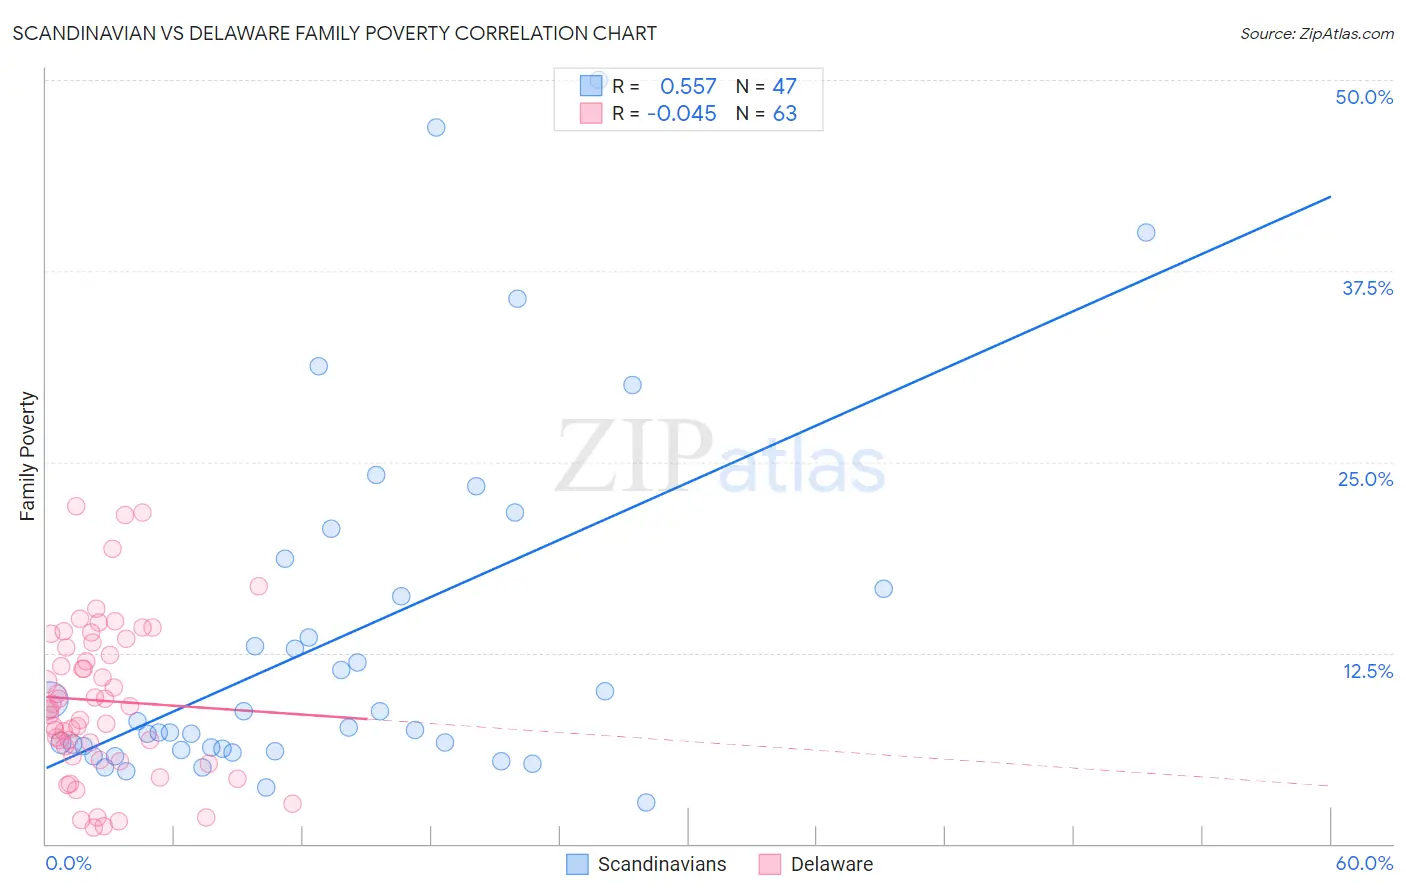
Scandinavian vs Delaware Family Poverty Correlation Chart
The statistical analysis conducted on geographies consisting of 470,471,633 people shows a substantial positive correlation between the proportion of Scandinavians and poverty level among families in the United States with a correlation coefficient (R) of 0.557 and weighted average of 7.6%. Similarly, the statistical analysis conducted on geographies consisting of 96,157,993 people shows no correlation between the proportion of Delaware and poverty level among families in the United States with a correlation coefficient (R) of -0.045 and weighted average of 9.2%, a difference of 20.6%.
Family Poverty Correlation Summary
| Measurement | Scandinavian | Delaware |
| Minimum | 2.7% | 1.0% |
| Maximum | 50.0% | 22.1% |
| Range | 47.3% | 21.0% |
| Mean | 13.3% | 9.4% |
| Median | 7.6% | 8.8% |
| Interquartile 25% (IQ1) | 6.2% | 5.7% |
| Interquartile 75% (IQ3) | 16.7% | 13.2% |
| Interquartile Range (IQR) | 10.5% | 7.4% |
| Standard Deviation (Sample) | 11.5% | 5.1% |
| Standard Deviation (Population) | 11.4% | 5.1% |
Similar Demographics by Family Poverty
Demographics Similar to Scandinavians by Family Poverty
In terms of family poverty, the demographic groups most similar to Scandinavians are Immigrants from Austria (7.6%, a difference of 0.24%), German (7.7%, a difference of 0.53%), Immigrants from Australia (7.6%, a difference of 0.63%), Okinawan (7.7%, a difference of 0.65%), and Tongan (7.7%, a difference of 0.67%).
| Demographics | Rating | Rank | Family Poverty |
| Greeks | 99.4 /100 | #35 | Exceptional 7.5% |
| Turks | 99.4 /100 | #36 | Exceptional 7.5% |
| Estonians | 99.4 /100 | #37 | Exceptional 7.5% |
| Bolivians | 99.3 /100 | #38 | Exceptional 7.5% |
| Carpatho Rusyns | 99.3 /100 | #39 | Exceptional 7.5% |
| Slovenes | 99.3 /100 | #40 | Exceptional 7.5% |
| Immigrants | Australia | 99.2 /100 | #41 | Exceptional 7.6% |
| Scandinavians | 99.1 /100 | #42 | Exceptional 7.6% |
| Immigrants | Austria | 99.1 /100 | #43 | Exceptional 7.6% |
| Germans | 99.0 /100 | #44 | Exceptional 7.7% |
| Okinawans | 98.9 /100 | #45 | Exceptional 7.7% |
| Tongans | 98.9 /100 | #46 | Exceptional 7.7% |
| Immigrants | Czechoslovakia | 98.9 /100 | #47 | Exceptional 7.7% |
| Immigrants | Sri Lanka | 98.9 /100 | #48 | Exceptional 7.7% |
| Immigrants | Bolivia | 98.9 /100 | #49 | Exceptional 7.7% |
Demographics Similar to Delaware by Family Poverty
In terms of family poverty, the demographic groups most similar to Delaware are Colombian (9.2%, a difference of 0.090%), Immigrants from Kenya (9.2%, a difference of 0.20%), Immigrants from Saudi Arabia (9.1%, a difference of 0.44%), South American Indian (9.1%, a difference of 0.45%), and Immigrants from Afghanistan (9.2%, a difference of 0.48%).
| Demographics | Rating | Rank | Family Poverty |
| Immigrants | Uganda | 43.4 /100 | #180 | Average 9.1% |
| Hmong | 40.2 /100 | #181 | Average 9.1% |
| Immigrants | Morocco | 40.2 /100 | #182 | Average 9.1% |
| Uruguayans | 39.2 /100 | #183 | Fair 9.1% |
| South American Indians | 38.7 /100 | #184 | Fair 9.1% |
| Immigrants | Saudi Arabia | 38.6 /100 | #185 | Fair 9.1% |
| Colombians | 36.1 /100 | #186 | Fair 9.2% |
| Delaware | 35.4 /100 | #187 | Fair 9.2% |
| Immigrants | Kenya | 34.0 /100 | #188 | Fair 9.2% |
| Immigrants | Afghanistan | 32.1 /100 | #189 | Fair 9.2% |
| Arabs | 31.5 /100 | #190 | Fair 9.2% |
| Ugandans | 28.7 /100 | #191 | Fair 9.3% |
| Spanish | 28.7 /100 | #192 | Fair 9.3% |
| Immigrants | Western Asia | 28.2 /100 | #193 | Fair 9.3% |
| South Americans | 28.1 /100 | #194 | Fair 9.3% |