Scandinavian vs Fijian Family Poverty
COMPARE
Scandinavian
Fijian
Family Poverty
Family Poverty Comparison
Scandinavians
Fijians
7.6%
FAMILY POVERTY
99.1/ 100
METRIC RATING
42nd/ 347
METRIC RANK
10.1%
FAMILY POVERTY
2.1/ 100
METRIC RATING
233rd/ 347
METRIC RANK
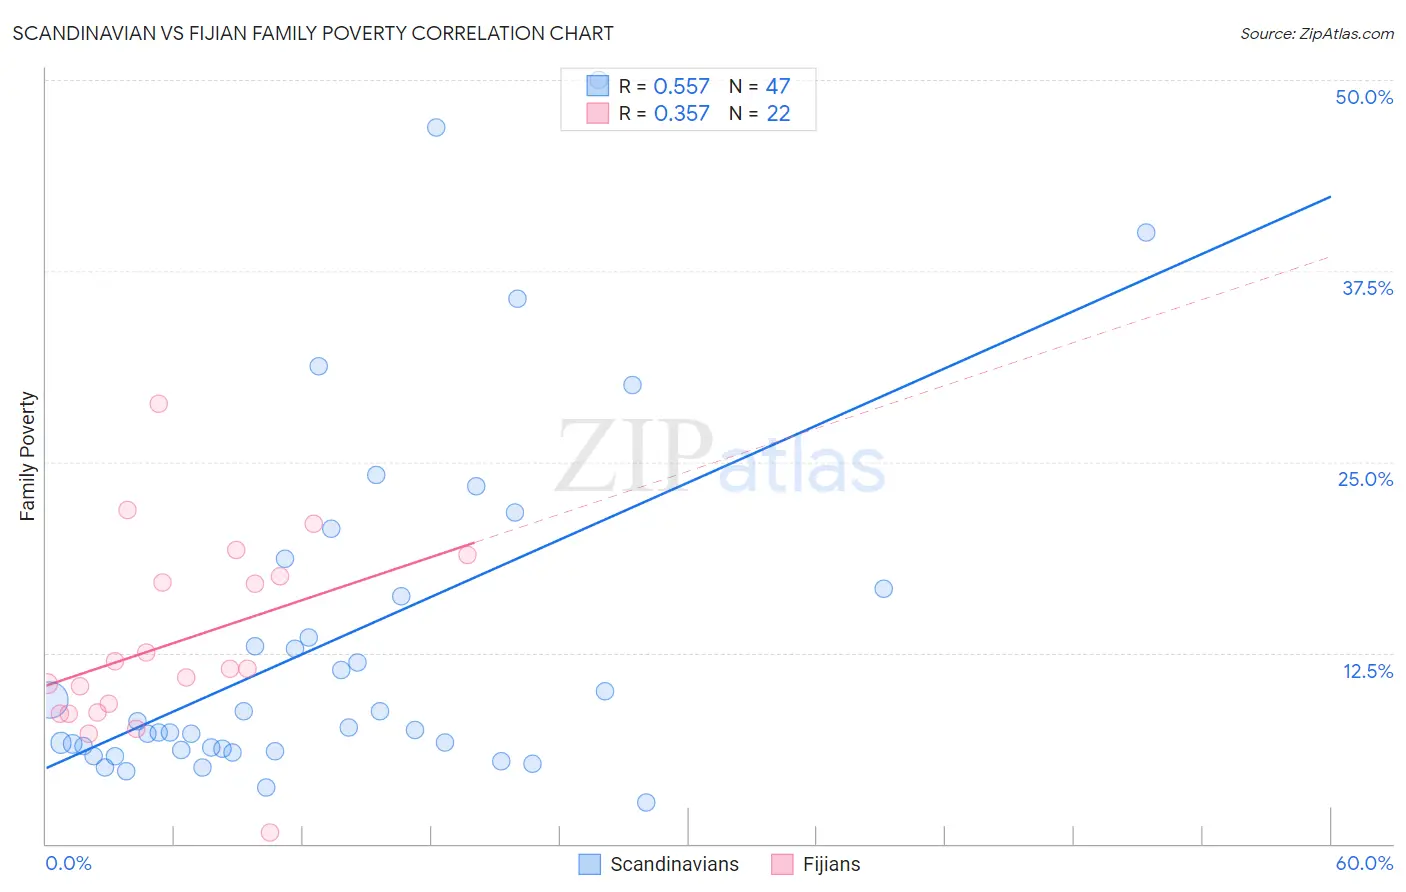
Scandinavian vs Fijian Family Poverty Correlation Chart
The statistical analysis conducted on geographies consisting of 470,471,633 people shows a substantial positive correlation between the proportion of Scandinavians and poverty level among families in the United States with a correlation coefficient (R) of 0.557 and weighted average of 7.6%. Similarly, the statistical analysis conducted on geographies consisting of 55,925,682 people shows a mild positive correlation between the proportion of Fijians and poverty level among families in the United States with a correlation coefficient (R) of 0.357 and weighted average of 10.1%, a difference of 33.0%.
Family Poverty Correlation Summary
| Measurement | Scandinavian | Fijian |
| Minimum | 2.7% | 0.73% |
| Maximum | 50.0% | 28.8% |
| Range | 47.3% | 28.0% |
| Mean | 13.3% | 13.2% |
| Median | 7.6% | 11.4% |
| Interquartile 25% (IQ1) | 6.2% | 8.6% |
| Interquartile 75% (IQ3) | 16.7% | 17.5% |
| Interquartile Range (IQR) | 10.5% | 8.9% |
| Standard Deviation (Sample) | 11.5% | 6.3% |
| Standard Deviation (Population) | 11.4% | 6.1% |
Similar Demographics by Family Poverty
Demographics Similar to Scandinavians by Family Poverty
In terms of family poverty, the demographic groups most similar to Scandinavians are Immigrants from Austria (7.6%, a difference of 0.24%), German (7.7%, a difference of 0.53%), Immigrants from Australia (7.6%, a difference of 0.63%), Okinawan (7.7%, a difference of 0.65%), and Tongan (7.7%, a difference of 0.67%).
| Demographics | Rating | Rank | Family Poverty |
| Greeks | 99.4 /100 | #35 | Exceptional 7.5% |
| Turks | 99.4 /100 | #36 | Exceptional 7.5% |
| Estonians | 99.4 /100 | #37 | Exceptional 7.5% |
| Bolivians | 99.3 /100 | #38 | Exceptional 7.5% |
| Carpatho Rusyns | 99.3 /100 | #39 | Exceptional 7.5% |
| Slovenes | 99.3 /100 | #40 | Exceptional 7.5% |
| Immigrants | Australia | 99.2 /100 | #41 | Exceptional 7.6% |
| Scandinavians | 99.1 /100 | #42 | Exceptional 7.6% |
| Immigrants | Austria | 99.1 /100 | #43 | Exceptional 7.6% |
| Germans | 99.0 /100 | #44 | Exceptional 7.7% |
| Okinawans | 98.9 /100 | #45 | Exceptional 7.7% |
| Tongans | 98.9 /100 | #46 | Exceptional 7.7% |
| Immigrants | Czechoslovakia | 98.9 /100 | #47 | Exceptional 7.7% |
| Immigrants | Sri Lanka | 98.9 /100 | #48 | Exceptional 7.7% |
| Immigrants | Bolivia | 98.9 /100 | #49 | Exceptional 7.7% |
Demographics Similar to Fijians by Family Poverty
In terms of family poverty, the demographic groups most similar to Fijians are Immigrants from Middle Africa (10.1%, a difference of 0.11%), Nigerian (10.1%, a difference of 0.14%), Immigrants from Sudan (10.1%, a difference of 0.25%), Immigrants from Nigeria (10.2%, a difference of 0.39%), and Immigrants from Laos (10.2%, a difference of 0.65%).
| Demographics | Rating | Rank | Family Poverty |
| Ottawa | 3.3 /100 | #226 | Tragic 10.0% |
| Immigrants | Armenia | 3.3 /100 | #227 | Tragic 10.0% |
| Sudanese | 3.1 /100 | #228 | Tragic 10.0% |
| Immigrants | Uzbekistan | 3.1 /100 | #229 | Tragic 10.0% |
| Immigrants | Panama | 3.1 /100 | #230 | Tragic 10.0% |
| Alaskan Athabascans | 2.7 /100 | #231 | Tragic 10.1% |
| Immigrants | Sudan | 2.3 /100 | #232 | Tragic 10.1% |
| Fijians | 2.1 /100 | #233 | Tragic 10.1% |
| Immigrants | Middle Africa | 2.1 /100 | #234 | Tragic 10.1% |
| Nigerians | 2.0 /100 | #235 | Tragic 10.1% |
| Immigrants | Nigeria | 1.9 /100 | #236 | Tragic 10.2% |
| Immigrants | Laos | 1.7 /100 | #237 | Tragic 10.2% |
| French American Indians | 1.5 /100 | #238 | Tragic 10.2% |
| Potawatomi | 1.5 /100 | #239 | Tragic 10.2% |
| Immigrants | Azores | 1.4 /100 | #240 | Tragic 10.3% |